Abstract
The effect of sampling time in the context of growth conditions on a dynamic metabolic system was investigated in order to assess to what extent a single sampling time may be sufficient for general application, as well as to determine if useful kinetic information could be obtained. A wild type yeast strain (W) was compared to a snf1Δ mutant yeast strain (S) grown in high glucose medium (R) and in low glucose medium containing ethanol (DR). Under these growth conditions, different metabolic pathways for utilizing the different carbon sources are expected to be active. Thus, changes in metabolite levels relating to the carbon source in the growth medium were anticipated. Furthermore, the Snf1 protein kinase complex is required to adapt cellular metabolism from fermentative R conditions to oxidative DR conditions. So, differences in intracellular metabolite levels between the W and S yeast strains were also anticipated. Cell extracts were collected at four time points (0.5, 2, 4, 6 h) after shifting half of the cells from R to DR conditions, resulting in 16 sample classes (WR, WDR, SR, SDR) × (0.5, 2, 4, 6 h). The experimental design provided time course data, so temporal dependencies could be monitored in addition to carbon source and strain dependencies. Comprehensive twodimensional (2D) gas chromatography coupled to time-of-flight mass spectrometry (GC×GC-TOFMS) was used with discovery-based data mining algorithms1, 2 to locate regions within the 2D chromatograms (i.e., metabolites) that provided chemical selectivity between the 16 sample classes. These regions were mathematically resolved using parallel factor analysis (PARAFAC) to positively identify the metabolites and to acquire quantitative results. With these tools, 51 unique metabolites were identified and quantified. Various time course patterns emerged from these data and principal component analysis (PCA) was utilized as a comparison tool to determine the sources of variance between these 51 metabolites. The effect of sampling time was investigated with separate PCA analyses using various subsets of the data. PCA utilizing all of the time course data, averaged time course data, and each individual time point data set independently were performed to discern the differences. For the yeast strains examined in the current study, data collection at either 4 h or 6 h provided information comparable to averaged time course data, albeit with a few metabolites missing using a single sampling time point.
INTRODUCTION
Studies of the metabolome, the complete collection of low molecular weight molecules present in a cell of a particular state exposed to a specific environmental condition, provide information to better understand cellular processes.3–5 The inner workings of a cell are controlled by a number of feedback mechanisms involving the genome, transcriptome, proteome, and metabolome.6 Studying and integrating as many of these as possible would provide the most complete picture of the cellular physiology.7–9 The metabolome is often thought to best describe the phenotype because it is a collection of the end products of the various physiological processes. Changes in gene expression can be amplified at the metabolite level10 and post translational and transcriptional modifications may be apparent in the metabolome that might not be seen at the genome or proteome levels.11 Metabolome studies present unique challenges because of the magnitude of molecular species present, the large dynamic range of concentrations, and the compositional heterogeneity of metabolites. The metabolome consists of amino acids, fatty acids, sugar phosphates, carbohydrates, vitamins, lipids, inorganic species, and elements spanning many sizes, polarities, and volatilites.8, 12 Hence, there is no single chemical analysis method currently available to study all of the classes of metabolites simultaneously.12, 13
Comprehensive two-dimensional (2D) gas chromatography coupled to time-of-flight mass spectrometry (GC × GC-TOFMS) is a powerful tool that is well suited for complex samples, and has been employed for numerous metabolomic studies.1, 14–24 While this is not the only approach (nuclear magnetic resonance (NMR) spectroscopy, infrared (IR) spectroscopy, mass spectrometry (MS)),5, 25 chromatographic methods allow for more than a fingerprint analysis. GC methods with exceptional resolution and well-established mass spectral libraries have been touted as the “gold standard” even with a bias toward smaller metabolites and the need for a chemical derivatization step to improve metabolite volatility and thermal stability.8, 26 GC × GC provides excellent resolving power and increased peak capacity, generally by combining a longer non-polar column with a shorter polar column, i.e., a “traditional” arrangement; however, a reverse column arrangement could also be implemented.27–33
GC × GC-TOFMS creates a cube of data for each sample analyzed, with two dimensions of separation and a full mass spectrum at every point in 2D separation time. This cube of data contains numerous metabolite signals that can appear unmanageable when trying to determine differences between the samples. Using a hypothesis driven experimental design, with sample class membership known a priori, a discovery-based analysis approach is readily applied. Here, sample class refers to different sample types and/or conditions, and not to different classes of compounds. One of the first steps is to find the regions of the 2D chromatograms (i.e., analytes) that offer the most chemical selectivity to distinguish the sample type classes. There are a number of algorithms that can accomplish this.23, 24, 34–36 Principal component analysis (PCA), Fisher ratio analysis (F-ratio)1, and ratio of signal (S-ratio)2 are a few of the data analysis methods we have employed for data such as these. All of the methods locate metabolites within the data set that have the greatest differences between sample type classes. These metabolites, which offer the most insight to a biological system, are targeted for further investigation. Parallel factor analysis (PARAFAC) is a chemometric method for mathematical resolution (deconvolution) that provides resolved chromatographic peak profiles and mass spectra by removing background noise and overlapping analytes (and interferences).37–39 PARAFAC is applied to the sample class distinguishing data locations to provide metabolite identification and quantification. PARAFAC takes advantage of the inherent trilinear data structure for a GC × GC-TOFMS data cube, where an analyte signal is represented by the outer product of the peak profile on the first column, the peak profile on the second column, and the mass spectrum. This discovery-based approach combined with PARAFAC is applicable to any metabolic study in which differences between sample classes are sought.
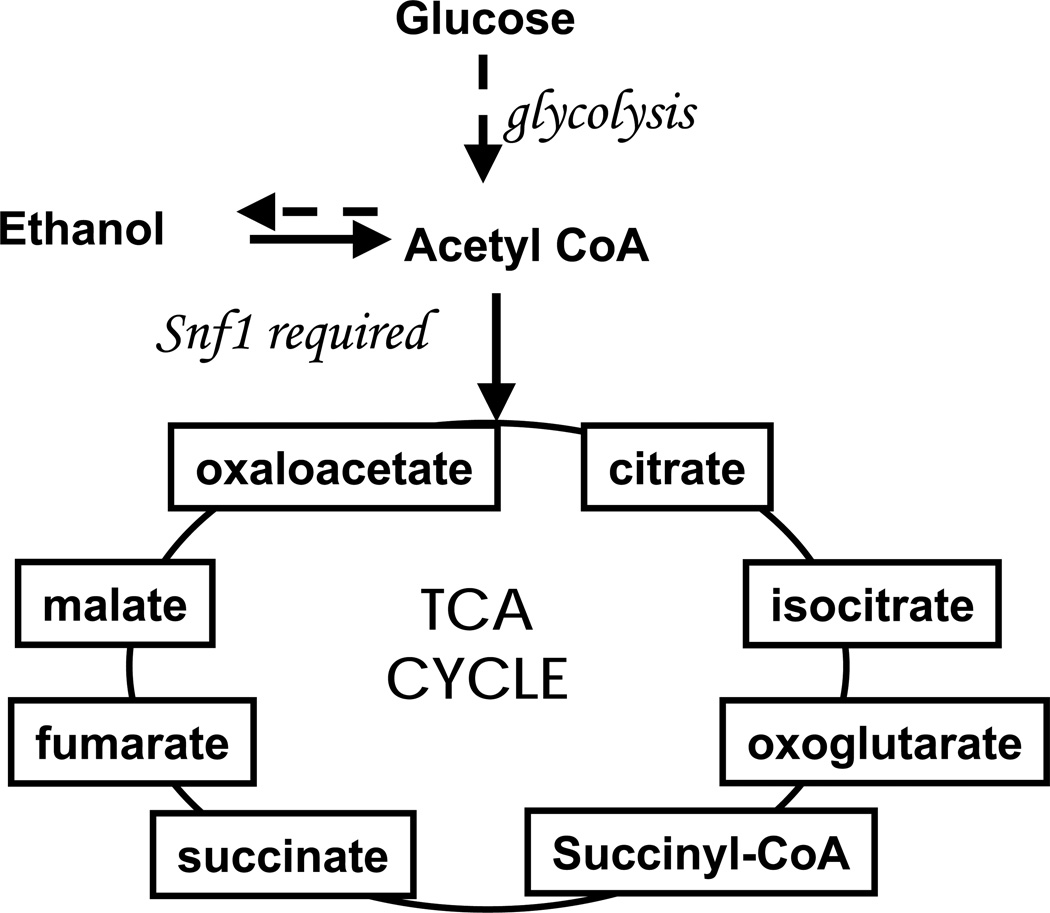
The yeast metabolome is dynamic and metabolite levels can change dramatically over time as environmental conditions change. Notably, yeast utilize different metabolic pathways depending on the available carbon source. Yeast Saccharomyces cerevisiae extract carbon and energy from glucose, the preferred carbon source,40 via fermentation (Figure 1). The metabolic activity of the yeast undergoes a profound reorganization when a fermentable carbon source is no longer available in the growth medium and non-fermentable carbon sources, such as ethanol or glycerol are oxidized via respiratory pathways. More than one quarter of the yeast transcriptome is altered during this switch from fermentative to oxidative pathways, termed the diauxic shift.41 These changes allow the yeast cells to feed the available non-fermentable carbon source into the tricarboxylic acid (TCA) cycle, the glyoxylate cycle, and gluconeogenesis, to generate energy and essential biosynthetic intermediates. When the concentration of glucose in the growth medium is high, the proteins required for these processes are not highly expressed, and the physiological state of the cells is referred to as glucose repressed (R). During the diauxic shift, when glucose is depleted from the growth medium, expression of proteins required for these processes is activated or derepressed (DR). The Snf1a protein kinase is one of the important players involved in the diauxic shift.40 The Snf1 complex is the yeast homolog of the AMP-activated protein kinase (AMPK) found in higher organisms.42 Snf1-dependent phosphorylation regulates the expression and activity of several metabolic enzymes and transcriptional factors required for the expression of many glucose-regulated genes involved in the utilization of non-fermentable carbon sources. This makes it essential for growth in the absence of glucose.40 Studies at the transcriptional level have shown that there are over 400 SNF1b-dependent genes, and of the 40 most glucose-repressed genes, 29 are also SNF1-dependent.41 Mutant cells lacking the Snf1 protein complex are an important topic for metabolomic studies because mutations in the activating subunit of the complex are implicated in cardiac disease, and the major drug used to treat diabetes, metformin, is an inhibitor of AMPK.43, 44 Metabolomic studies might identify new AMPK-dependent metabolic pathways and reveal some consequences of reduced AMPK activity. In addition, the primary signal that is used to sense the change in carbon source is thought to be one or more metabolites of glucose metabolism.
Figure 1.
Metabolic pathway activity based on available carbon source is illustrated. When glucose is present, cells ferment and follow the dashed line. The presence of glucose represses other metabolic pathways thus this condition is termed glucose repressed. When glucose is limited, cells become derepressed and low glucose respiratory enzymes are synthesized. This allows the cells to respire on ethanol, following the solid lines. The Snf1 protein complex is required to make the shift to utilize ethanol. In the absence of the Snf1 protein complex, cells are unable to respire effectively on ethanol.
In this report, GC × GC-TOFMS was used to determine differences in metabolite levels between wild type yeast cells (W) and snf1Δ mutant cells (S) in repressing (R) and derepressing (DR) conditions, resulting in four strain/condition classes (WR, WDR, SR, SDR). Time course data were generated at 0.5, 2, 4 and 6 h to follow the dynamic, time-dependent changes after shifting from repressing to derepressing conditions, for each strain/growth condition resulting in 16 sample classes overall. The previously reported data mining tool referred to as the S-ratio method2 was used to find sample class distinguishing locations in the 2D GC separation space and PARAFAC was used to identify and quantify these metabolites providing insight to the Snf1 protein complex. A non-polar to polar column arrangement was implemented in order to utilize an in-house library of retention times (from prior studies) to support the mass spectral identification of metabolites. The effect of sampling time was investigated using PCA as a comparison tool. Careful analysis of the results at various time points will illustrate the dynamic nature of the yeast metabolome, providing insight into how to discern which time point(s) may provide the most useful information for routine analysis.
EXPERIMENTAL
Yeast cells and culture conditions
A wild type yeast strain W303-1a (MATa ade2 can1-100-his3-11,15 leu2-13,112 trp1-1 ura3-1) and a mutant yeast strain of W303-1a having the SNF1 open reading frame completely replaced with a kanMX gene cassette (snf1Δ) were analyzed in this study. Both strains were initially grown in repressing (R) synthetic complete (SC) medium containing 5% glucose as the sole carbon source. At time 0 h, the cell cultures were divided in half, harvested by centrifugation at 4 °C and washed once with cold sterile synthetic medium, SM, (SC lacking amino acids or carbon source). One aliquot of cells from each culture was suspended in fresh R medium pre-warmed to 30 °C, while the remaining aliquot was suspended in pre-warmed derepressing (DR) medium which contained 3% ethanol and 0.05% glucose as carbon sources. The cell density of each culture was monitored by measuring the optical density at 600 nm and comparing to a calibration curve of optical density plotted against cell number per mL of serial dilutions counted with a hemocytometer. Glucose consumption was monitored by analyzing aliquots of medium every h with a PGO enzymes kit (Sigma Aldrich, St. Louis, Missouri). Three cultures of both wild type and snf1Δ cells were monitored for glucose levels in R conditions and one culture of each for DR conditions.
Extraction
At times 0.5 h, 2 h, 4 h, and 6 h, the metabolic activity was quenched and small polar molecules (metabolites) were extracted from the cells with the extraction procedure previously described.45 At each time point, 1 mL of each cell culture was rapidly diluted into 4 mL of −40 °C quenching buffer (10 mM tricene, pH 7.4, in 60% methanol). These cell suspensions were spun at 1000 × g in a Sorvall RC-5B Plus centrifuge at −20 °C for 3 min. Each cell pellet was washed with 1 mL of −40 °C quenching buffer and resuspended in 1 mL of 80 °C extraction buffer (0.5 mM tricine, pH 7.4, in 75% ethanol). The suspended pellet was held at 80 °C for ~3 min before being cooled on ice for 5 min. Large cellular debris was removed by spinning the suspension twice at high speed in a microcentrifuge. A volume of each ethanol metabolite extract corresponding to 1 × 10⁷ cells was dried in a SpeedVac at room temperature and stored at −80 °C under argon.
Derivatization of metabolites
After retrieval from the −80 °C freezer, any traces of water condensate on the sample tubes were removed by drying in a SpeedVac at room temperature for 1 h prior to derivatization. The metabolites were methoximated by adding 30 µL of a 20 mg/mL methoxyamine solution in pyridine and heating at 30 °C for 90 min to protect carbonyl groups. The methoximated extracts were then trimethylsilyated by adding 70 µL of BFTSA/TMCS (99:1) reagent and heating to 60 °C for 60 min.46
Instrument Parameters
The yeast extracts were analyzed via GC × GC-TOFMS instrumentation, which employed an Agilent 6890N gas chromatograph with an Agilent 7683 auto injector (Agilent Technologies, Palo Alto, CA) in conjunction with a LECO Pegasus III TOFMS upgraded with the commercially available 4D thermal modulator (LECO, St. Joseph, MI). The first column was 20 m×250 µm i.d.×0.5 µm RTX-5MS phase coating (Restek, Bellefonte, PA) and the second column was 2 m×180 µm i.d.×0.2 µm RTX-200MS phase coating (Restek, Bellefonte, PA). The GC inlet and transfer line were set to 280 °C. The first column was set at 60 °C for 0.25 min and the second column was set at 70 °C for 0.25 min at the commencement of the analysis. Both columns were temperature programmed at a rate of 8 °C/min to 280 °C where the columns were held constant for 10 min. The modulation period between the first and second columns was 1.5 s and the modulator was kept 40 °C higher than the first column. A constant flow rate of 1 mL/min hydrogen gas was maintained at the head of the first column. The TOFMS ion source was set to 250 °C. Mass channels 40–500 m/z were collected at 100 spectra/s after a 5 min solvent delay. Three injections of 1 µL were made for each of the 16 sample extracts for a total of 48 chromatographic runs.
Data Analysis
The GC × GC-TOFMS data were collected with the LECO ChromaTOF software v2.2.1 (LECO, St. Joseph, MI). The data were then exported to Matlab v.7.0.4 (Mathworks, Natick, MA) for S-ratio analysis. The S-ratios were calculated using a modification to the previously published algorithm.2 The S-ratio method was initially designed as a data analysis tool for yeast cells that demonstrated metabolic cycling behavior. For the previous cycling study, the S-ratios provided information relating to the depth-of-modulation (i.e., the maximum compared to the minimum) over two complete cycles. A large S-ratio corresponds to a large difference between the maximum and minimum data values across all sample classes. In this study, cyclical behavior was not anticipated so one maximum and minimum was located rather than two. Four lists were generated by calculating S-ratios for all sample types (WR, WDR, SR, SDR) at each time point. Using the LECO ChromaTOF software, the locations with the largest S-ratio values were further investigated. The S-ratio list was complemented with a comprehensive list of metabolites with differing levels between R and DR conditions from previous work in our group.22, 47 Using the LECO software, the mass spectra at these chromatographic locations were searched against the National Institute of Standards and Technology (NIST) library along with standard metabolite libraries created in-house for preliminary identification. An in-house developed target-analyte PARAFAC Graphical User Interface (GUI) implementing the N-way toolbox was used to deconvolute overlapping chromatographic peak profiles and mass spectra.38 The algorithm isolates the pure component peak profile and the pure mass spectrum of an individual component from overlapping peaks and background noise for quantification and identification, respectively. The full mass spectrum for one sample type at each sampled time point was examined using PARAFAC to obtain a full mass spectrum for a more confident identification of metabolites. Selected mass channels were then used with PARAFAC for quantification purposes. Raw PARAFAC peak volumes (i.e., signals) were normalized to the Total Ion Current (TIC). TIC-normalized data are presented in some figures as indicated. For PCA analysis to investigate the effect of time course sampling time, these TIC-normalized PARAFAC volumes for a given metabolite were mean-centered for ease of comparison via PCA.
RESULTS and DISCUSSION
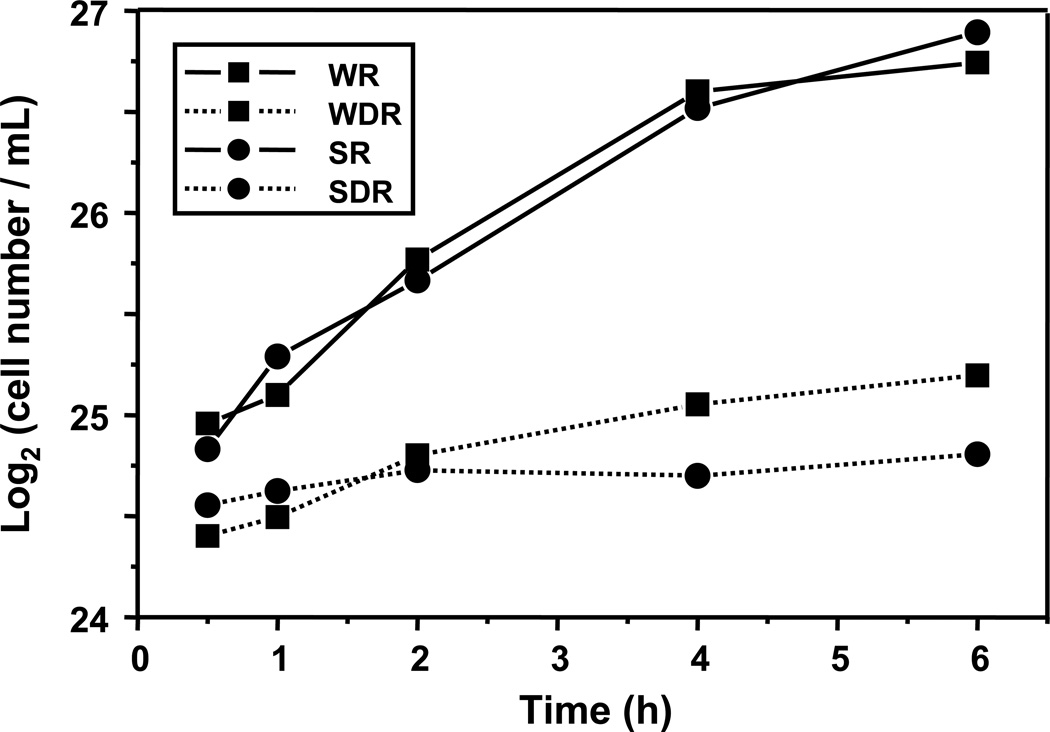
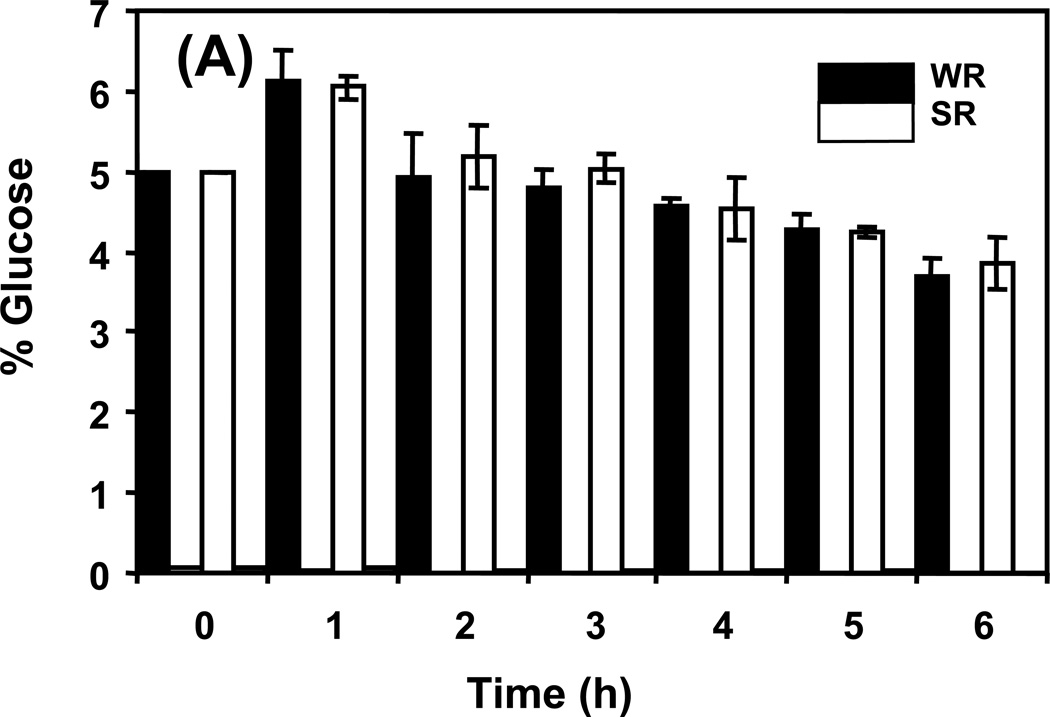
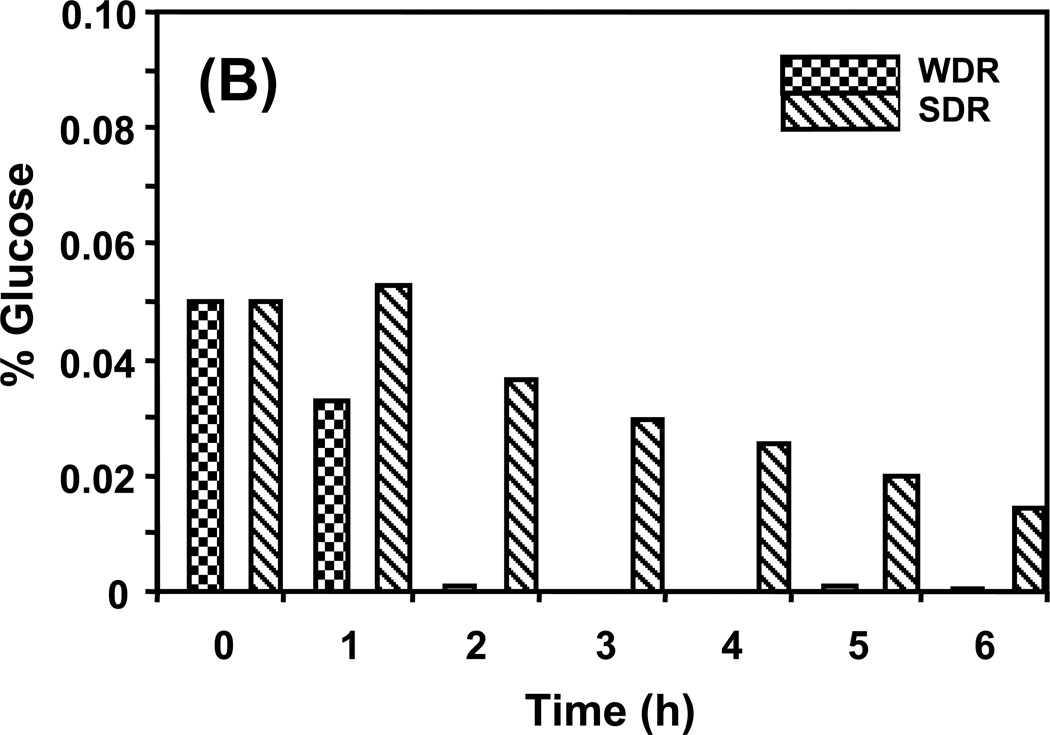
The experimental design used in this study allowed for the observation of changing metabolite levels as cells moved from a repressed metabolic state towards a derepressed state. This approach provided an opportunity for an in-depth look at the Snf1 protein complex, time dependencies, and the impact of sampling time. Figure 2 shows cell concentration as a function of time during the experiment. During the first 4 h, the number of both wild type and snf1Δ mutant cells in R medium doubled at the same rate, every 2 h. Between 4 and 6 h the growth of both slowed appreciably, a sign that the cells were exiting exponential growth and starting to enter stationary phase. As shown in Figure 3A, the concentration of glucose in the R medium at this time was approximately 80% of the initial value indicating that the cells were still subject to glucose repression. In DR medium, wild type cells grew considerably faster than snf1Δ mutant cells for the first 2 h with an estimated doubling time of 3.6 h compared to 8.8 h for the snf1Δ mutant cells. At 2 h, wild type cells had almost exhausted the 0.05% glucose present in the DR medium, as shown in Figure 3B, and their growth slowed to an estimated doubling time of 10 h. During this time, the snf1Δ mutant cells were very slowly utilizing the 0.05% glucose in the DR medium and essentially stopped growing, having a calculated doubling time of 26 h. These observations are consistent with the known requirement of the Snf1 protein kinase for the utilization of limiting glucose and ethanol as carbon sources.
Figure 2.
Cell growth over 6 h. The strains in repressed conditions grew faster than the strains in derepressed conditions. By the 6 h time point, the wild type and snf1Δ strains were entering stationary phase in repressed conditions.
Figure 3.
Available glucose in the medium in (A) repressed conditions, and in (B) derepressed conditions. Strains in repressed conditions have adequate glucose to remain repressed over the course of the experiment. The small amount of glucose provided in derepressed conditions is used by 2 h in the wild type cells and slowly diminished over the 6 h in the snf1Δ strain.
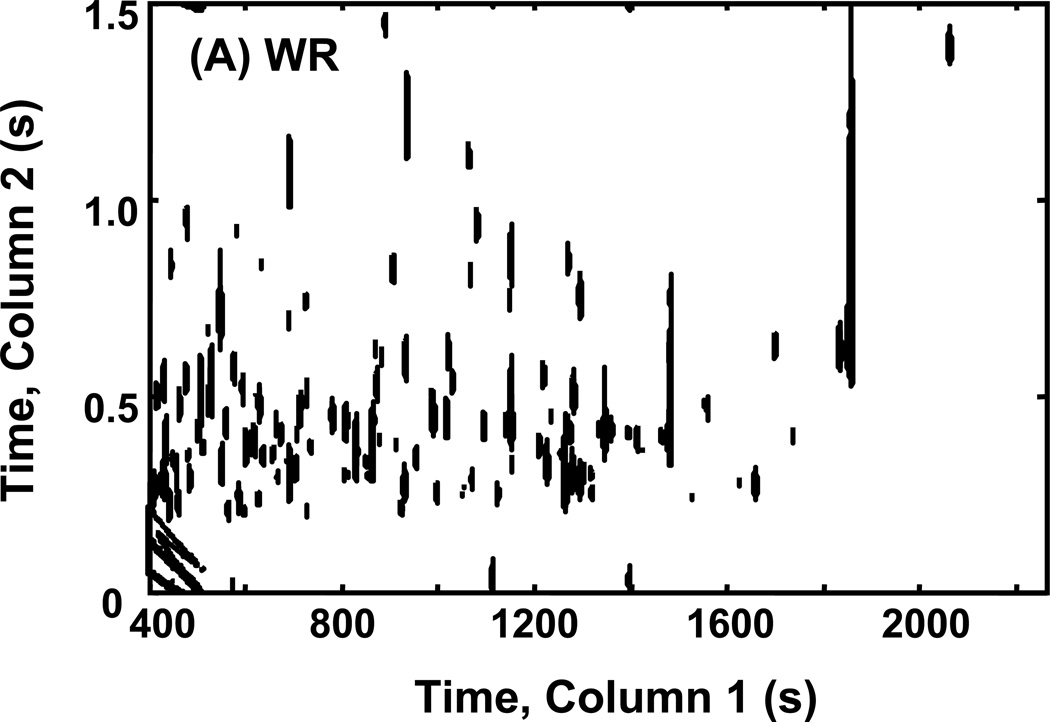
Figure 4A shows a GC × GC-TOFMS chromatogram contour plot at mass channel 73 (indicative of the trimethylsilyl group added during derivatization) of a WR sample at 6 h. Some of the largest reagent artifacts have been filtered out for clarity. Representative chromatograms of the other strain/growth conditions (WDR, SDR, SR) at time 6 h are provided in Supporting Information (Figures S1A, S1B, and S1C.) A comparison of these plots shows that by 6 h significant differences could be observed between the chromatograms of the various strains/growth conditions. Many of the peaks in the wild type strains have higher intensity than those in the snf1Δ strain. It is possible by eye to identify some metabolites that help to distinguish sample classes. However, metabolites with lower S/N may not be visible at this mass channel and threshold that may have important differences between strain/growth conditions. One possibility for finding more metabolites is to view selective mass channels, but more powerful chemometric tools are better suited to fully glean the desired information from the data.
Figure 4.
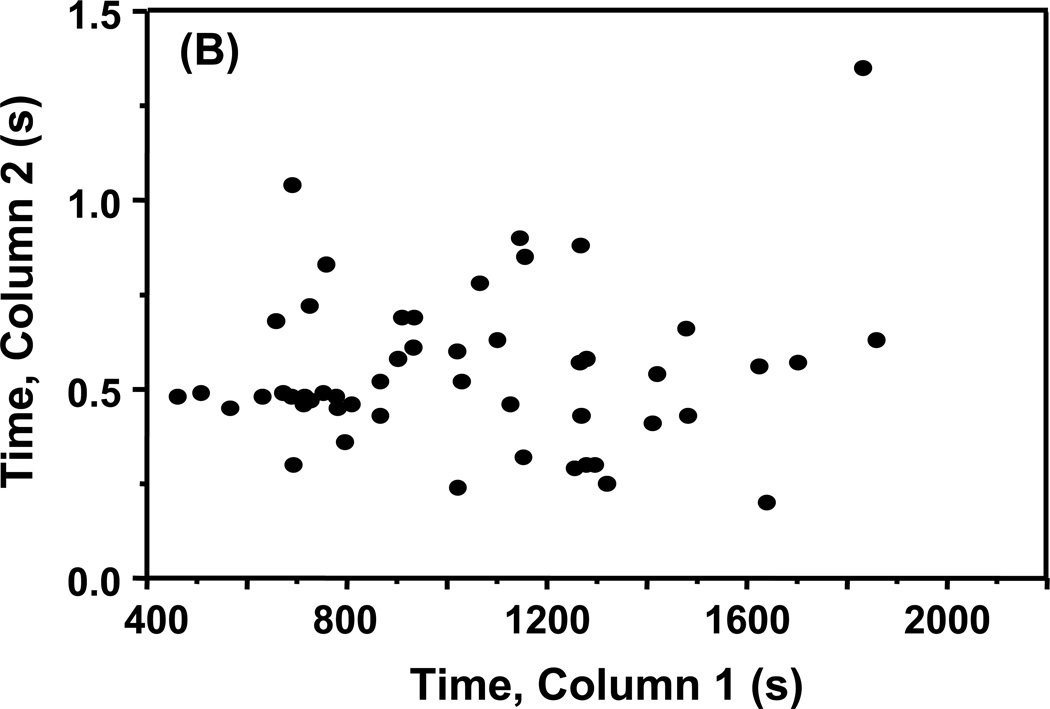
Location of analytes in the 2D separation space. A contour plot of mass channel 73 shows the ion indicative of trimethylsilyl (TMS) group for a (A) wild type cells in repressed conditions at 6 h. (B) The chromatographic location of the 51 metabolites identified in this study.
Data reduction methods are used to identify the most interesting regions of the 2D separation space that distinguish one sample class from another and provide insight to the biological function. S-ratio analysis located the regions offering the greatest chemical selectivity between classes. Initially, the data sets for the 0.5 h and 4 h time points were examined more extensively. Using the S-ratio results for the 0.5 h time point ensured that metabolites differing early after derepression were located regardless of whether they differed late after derepression. Conversely, using the results for the 4 h time point ensured that metabolites differing later after derepression were located even if they did not differ early after derepression. The 4 h time point was selected for the late time point because the concentration of some of the metabolites began to drop by the 6 h time point. This may reflect the slowing of growth and the entry into stationary phase of the cells growing in R medium. Locations with S-ratios greater than 5.0 were investigated. An S-ratio of 5 represents a particular metabolite that is 5-fold more concentrated between two of the samples. This discovery-based software approach located 51 sample class-distinguishing metabolites as presented in Table 1. Figure 4B shows these 51 metabolites in the 2D chromatographic space. Match values are presented from deconvoluted PARAFAC mass spectra and retention times were confirmed with standards as indicated. Investigating metabolites with an S-ratio less than 5 could be done, and a few more metabolites found, however, for the purpose of this study we used this S-ratio threshold for brevity, since it was providing complementary metabolites from our previous report.2, 22, 47
Table 1.
Identified metabolites with first column and apparent second column retention times and mass spectral match values. 51 metabolites were located using the data mining techniques. They were identified and quantified using PARAFAC.
| Metabolite Name | Kegg | MV 0.5 h | MV 2 h | MV 4 h | MV 6 h | Col. 1 tR | Col. 2 tR |
|---|---|---|---|---|---|---|---|
| lactate | c00186 | 870 | 861 | 876 | 784 | 462.0 | 0.48 |
| * alanine | c00041 | 819 | 856 | 925 | 926 | 508.5 | 0.49 |
| 3-hydroxy butyric acid | 820 | 811 | 771 | 765 | 567.0 | 0.45 | |
| * valine | c00183 | 942 | 948 | 924 | 945 | 631.5 | 0.48 |
| benzoic acid | 904 | 885 | 922 | 917 | 659.0 | 0.68 | |
| octanoic acid | 912 | 903 | 893 | 911 | 673.0 | 0.49 | |
| * leucine | c00123 | 938 | 946 | 876 | 934 | 690.0 | 0.48 |
| * CoA fragment | c00010 | 958 | 850 | 946 | 944 | 691.0 | 1.04 |
| * glycerol | c00116 | 958 | 949 | 955 | 954 | 693.0 | 0.3 |
| * isoleucine | c00407 | 945 | 941 | 935 | 941 | 714.0 | 0.46 |
| * proline | c00148 | 858 | 833 | 850 | 851 | 716.0 | 0.48 |
| * succinate | c00042 | 951 | 935 | 943 | 942 | 726.0 | 0.72 |
| * glycine | c00037 | 923 | 835 | 712 | 727.5 | 0.47 | |
| * uracil | c00106 | 917 | 925 | 905 | 891 | 753.0 | 0.49 |
| * fumarate | c00122 | 895 | 828 | 778 | 932 | 759.0 | 0.83 |
| o-toluic acid | 863 | 842 | 870 | 864 | 779.0 | 0.48 | |
| * serine | c00065 | 788 | 826 | 865 | 782.0 | 0.45 | |
| pyrrole-2-carboxylic acid | 748 | 722 | 761 | 796.5 | 0.36 | ||
| * threonine | c00188 | 969 | 963 | 953 | 956 | 810.0 | 0.46 |
| * arginine | c00062b | 907 | 961 | 961 | 952 | 867.0 | 0.52 |
| homoserine | 786 | 727 | 836 | 814 | 867.0 | 0.43 | |
| * malate | c00149 | 913 | 904 | 898 | 921 | 902.5 | 0.58 |
| 2-piperidinecarboxylic acid | 727 | 737 | 714 | 720 | 910.5 | 0.69 | |
| * aspartic acid | c00049 | 954 | 950 | 921 | 950 | 933.0 | 0.61 |
| * methionine | c00073 | 935 | 881 | 948 | 900 | 934.5 | 0.69 |
| * glutamic acid | c00025 | 963 | 971 | 947 | 948 | 1021.0 | 0.6 |
| ribofuranose | 812 | 724 | 1022.0 | 0.24 | |||
| * phenylalanine | c00079 | 962 | 956 | 942 | 937 | 1030.0 | 0.52 |
| * asparginine | c00152 | 924 | 929 | 941 | 946 | 1066.0 | 0.78 |
| * UDP/glucose | c00029 | 900 | 889 | 842 | 920 | 1101.0 | 0.63 |
| orotic acid | 819 | 807 | 856 | 746 | 1127.0 | 0.46 | |
| * glycerol-3-phosphate | c00093b | 893 | 882 | 913 | 927 | 1146.0 | 0.9 |
| * glucose-1-phosphate | c00103 | 871 | 868 | 900 | 909 | 1153.0 | 0.32 |
| * glutamine | c00064 | 951 | 955 | 945 | 941 | 1156.0 | 0.85 |
| * galactose | 906 | 942 | 895 | 1255.5 | 0.29 | ||
| gluconic acid | 814 | 780 | 1266.0 | 0.57 | |||
| * histidine | c00135 | 808 | 871 | 931 | 929 | 1267.5 | 0.88 |
| * lysine | c00047 | 964 | 954 | 951 | 939 | 1269.0 | 0.43 |
| * glucose b | c00031b | 926 | 916 | 951 | 949 | 1279.0 | 0.3 |
| * tyrosine | c00082b | 945 | 802 | 959 | 946 | 1279.5 | 0.58 |
| * mannitol | c00392 | 942 | 918 | 940 | 945 | 1296.0 | 0.3 |
| glucose | 889 | 859 | 901 | 876 | 1320.0 | 0.25 | |
| heptadecanoic acid | 882 | 864 | 883 | 881 | 1411.5 | 0.41 | |
| * D-ribulose-5-phosphate | c00199 | 736 | 765 | 819 | 725 | 1420.5 | 0.54 |
| tryptophan | 894 | 938 | 880 | 930 | 1479.0 | 0.66 | |
| * stearic acid | c01530 | 947 | 839 | 894 | 942 | 1482.0 | 0.43 |
| * 6-phospho-D-gluconate | c00345 | 857 | 913 | 886 | 787 | 1624.5 | 0.56 |
| methanamine | 713 | 677 | 744 | 718 | 1639.5 | 0.2 | |
| glucose-6-phosphate | 862 | 829 | 852 | 816 | 1702.5 | 0.57 | |
| * fructose-1,6-bisphosphate | c05378 | 808 | 867 | 835 | 1832.0 | 1.35 | |
| * trehalose | 949 | 934 | 958 | 955 | 1858.8 | 0.63 |
Metabolites further confirmed by retention time are indicated with an asterisk.
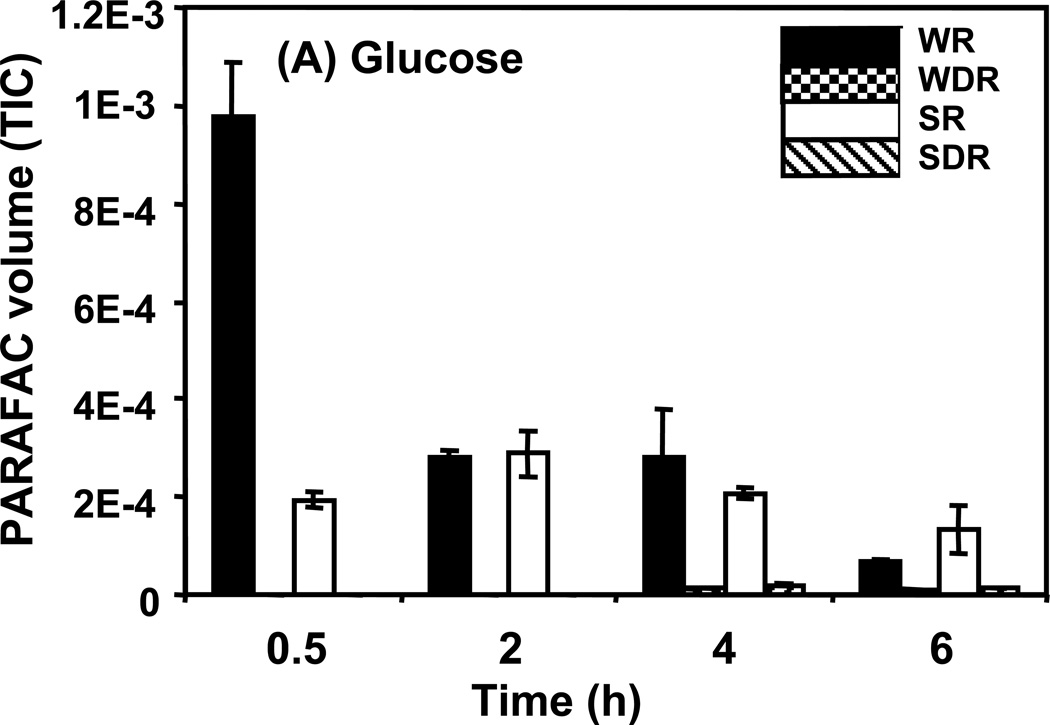
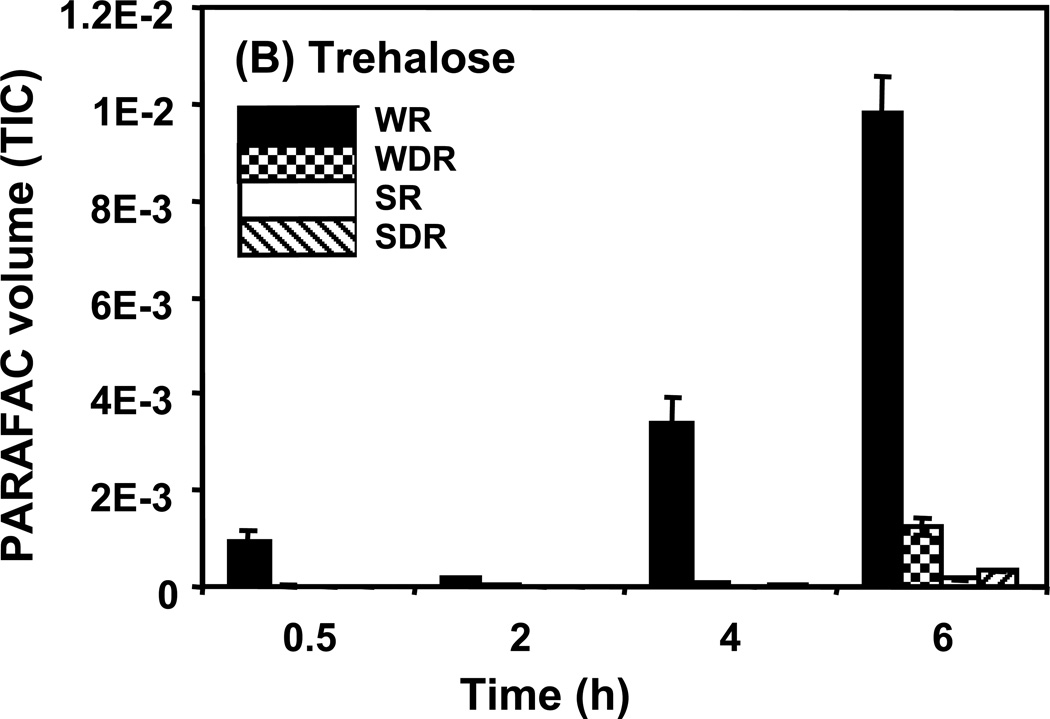
Using the prior list of metabolites based on the locations found with the S-ratio method (discovery-based) software and our previous studies, metabolites were identified and quantified using the PARAFAC target analyte GUI. The PARAFAC peak volumes obtained were normalized to the TIC to correct for injection and detection variation. The TIC was independent of yeast strain or growth condition with an average value of 5.9×10⁹ and 13% RSD. TIC normalization was more precise than use of 13C labeled internal standards (alanine and serine). The dynamic nature of the metabolome is again highlighted by the presence of four different time course patterns observed for the 51 metabolites, referred to as time decay, time increase, peak, and un-patterned. Representative examples of these patterns are shown in Figure 5. The following are descriptions of these representative time course examples in relation to potential biological implications.
Figure 5.
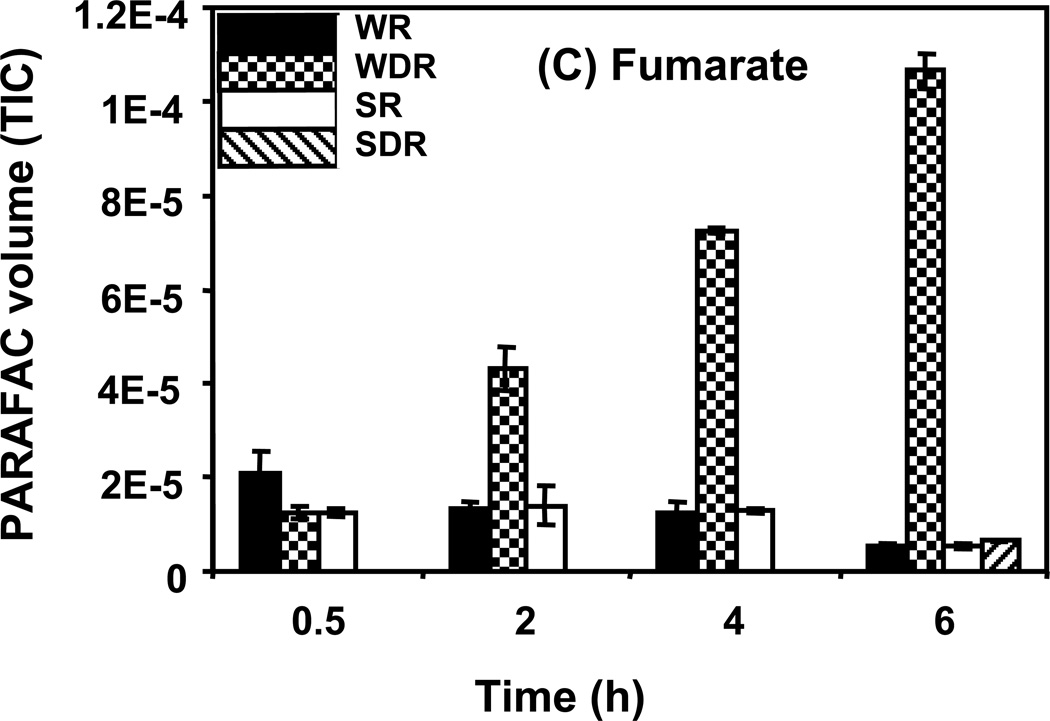
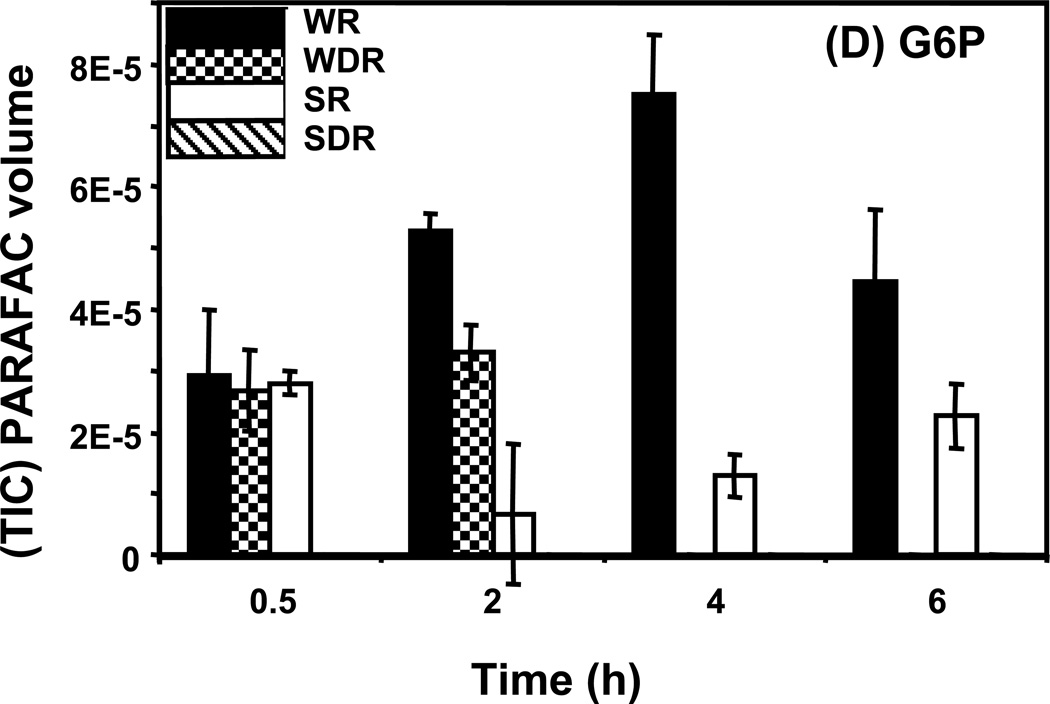
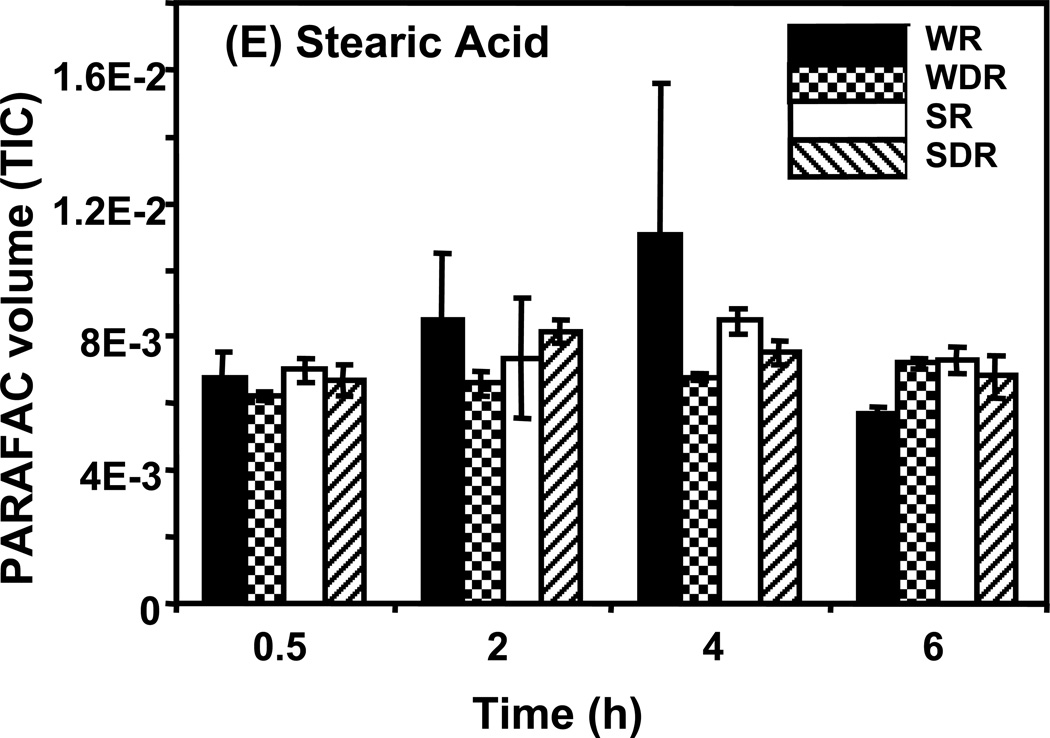
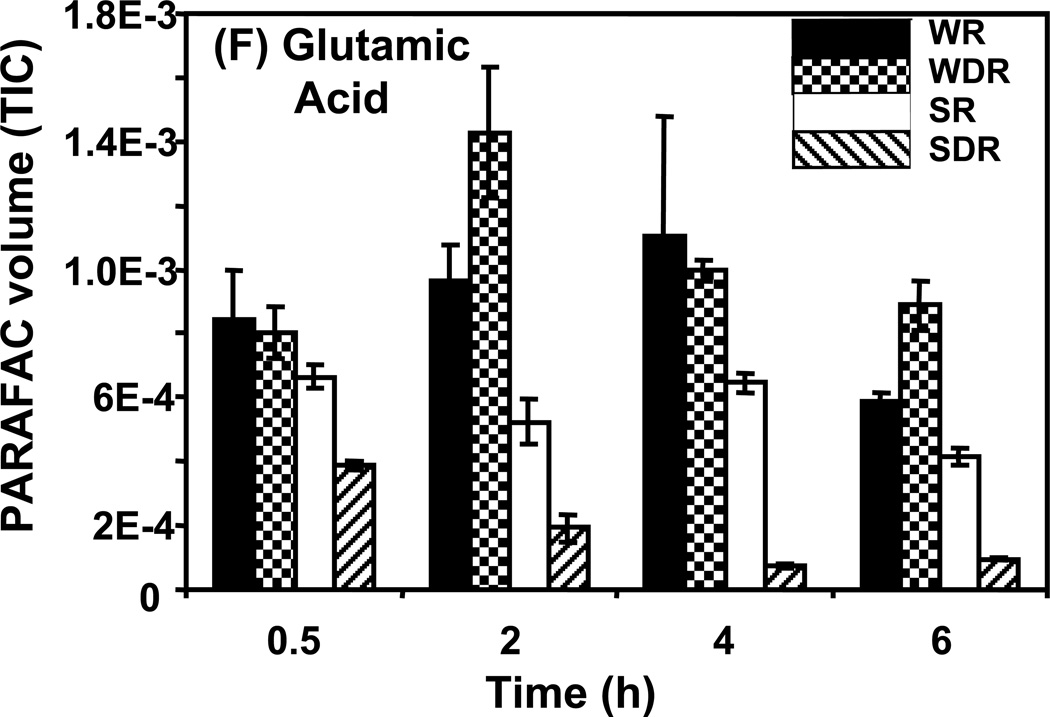
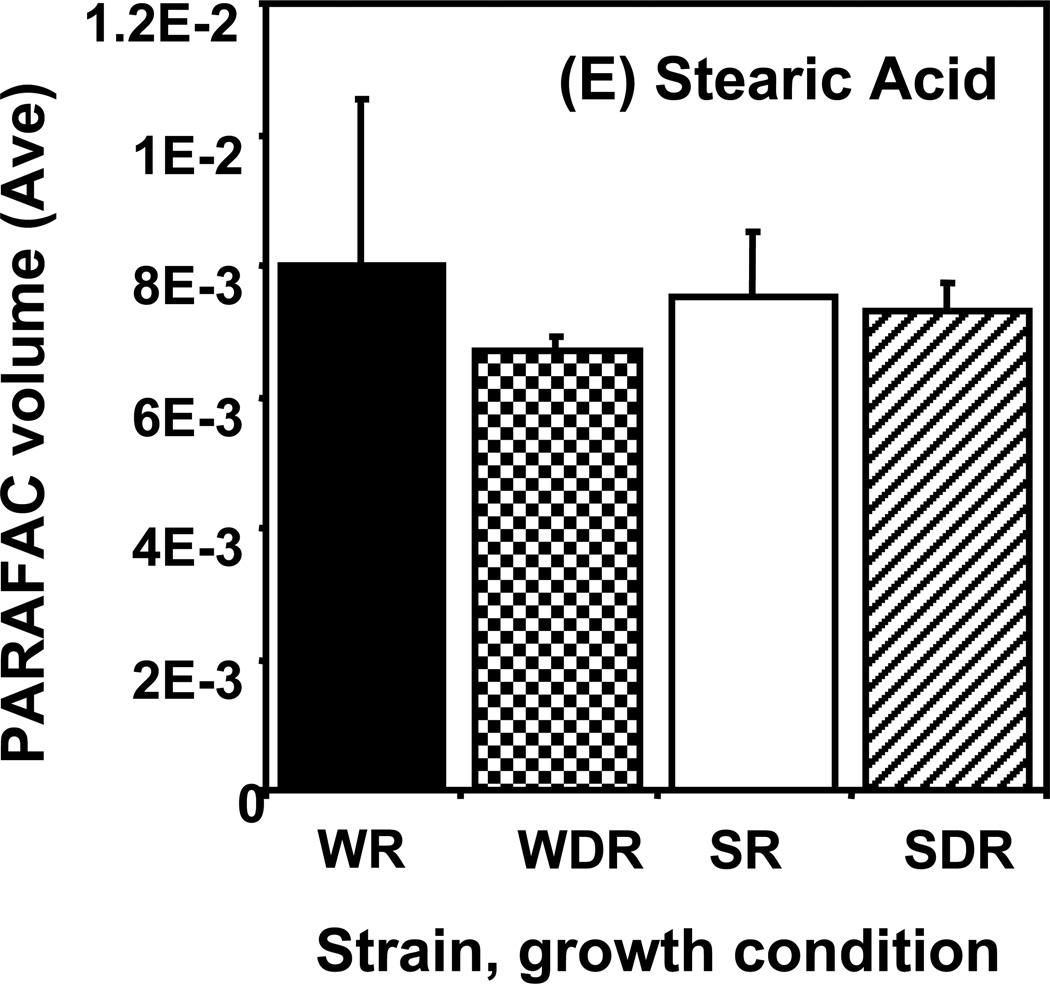
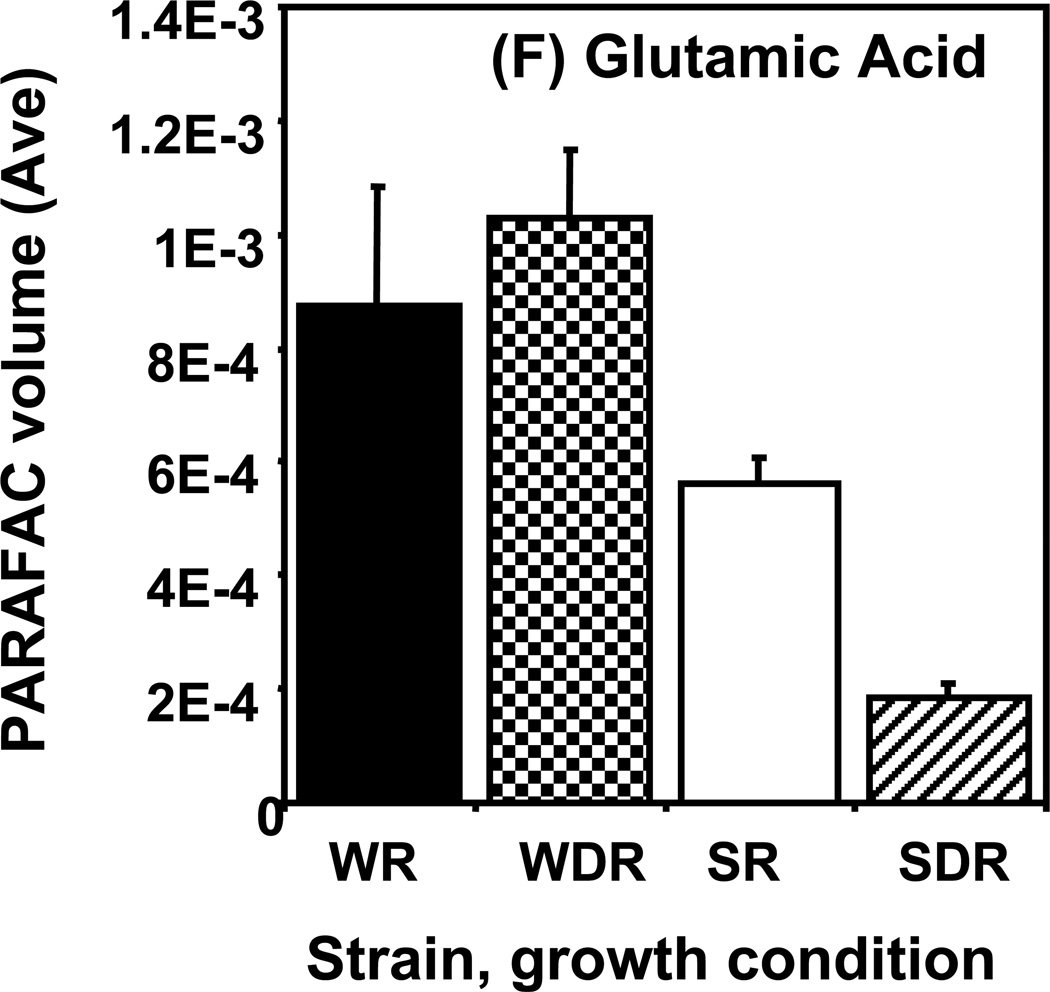
Time course data for selected metabolites is presented, normalized to TIC only. (A) Glucose is shown elevated in both wild type and mutant in R conditions. (B) Trehalose is a major carbohydrate storage molecule. The relative concentrations increased over time in the WR cells. This result was confirmed in three additional biological replicates. Additionally, a tps1Δ strain was analyzed and the absence of this peak was observed. (C) Fumarate is a member of the TCA cycle. The relative peak volumes increase steadily in WDR, but remain low in the other classes. (D) Glucose-6-phosphate (G6P) is a member of glycolysis. The WR peak profile is elevated compared to all other classes. (E) Stearic Acid remains essentially constant between classes and time points. (F) Glutamic acid is an amino acid. Wild-type is elevated over the mutant for both R and DR.
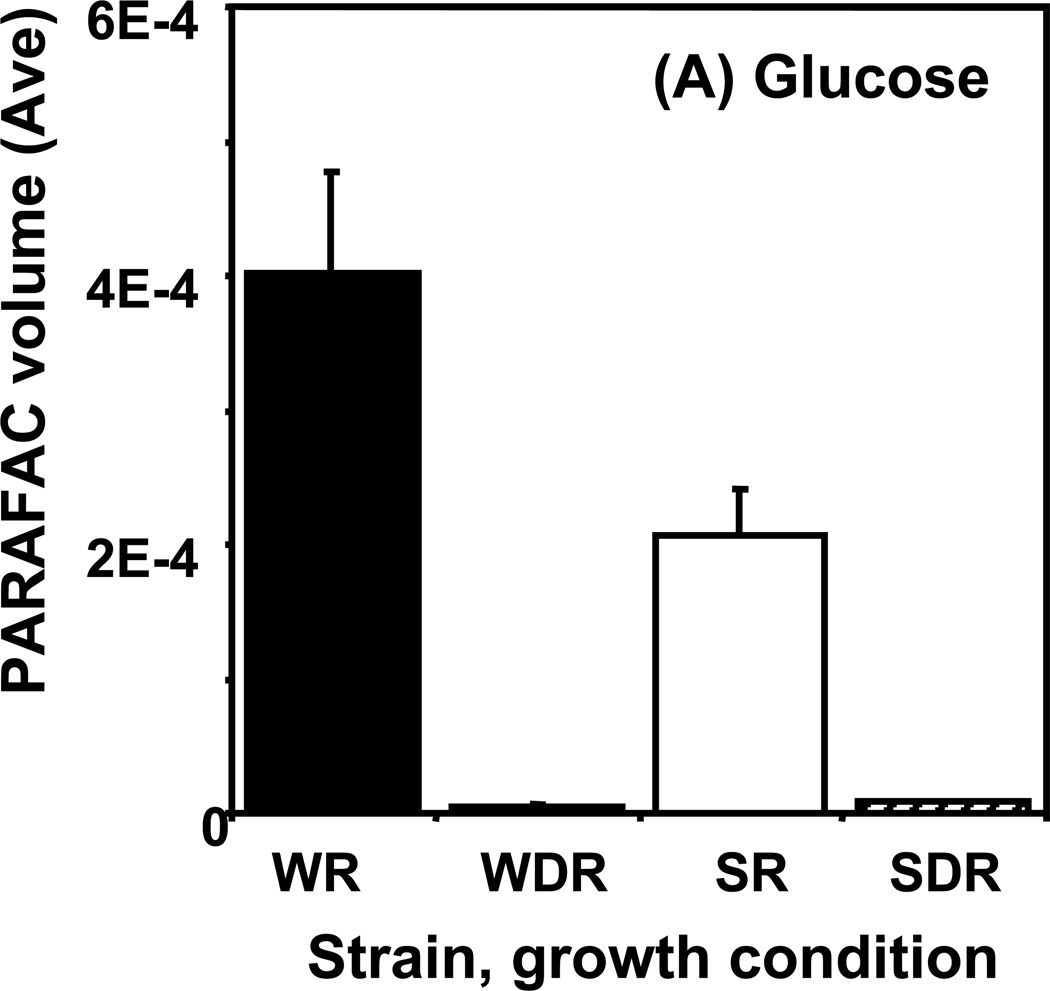
An example of a metabolite exhibiting a “time decay” pattern is glucose, shown in Figure 5A. Of the metabolites identified in our analysis, it had the highest S-ratio value, 79, at the 0.5 h time point. It was most abundant in extracts from R cells with the largest difference from DR cells seen at the 0.5 h time point. The DR/R ratio (i.e., concentration ratio) for glucose was very low in both the wild type and the snf1Δ mutant strains. Glucose is provided as the fermentable carbon source in R medium. However, simple contamination of the cells with R medium cannot fully account for the elevated level of glucose in wild type R cells because snf1Δ R cells have a 5-fold lower amount of detectable glucose and contamination levels should be the same for both cell types. This difference in glucose levels may reveal a previously not described SNF1-dependent glucose uptake system that is not glucose repressed. Little glucose was detected in metabolite extracts from DR cells. This is not surprising since DR growth medium contains only 1% the amount of glucose as the R medium.
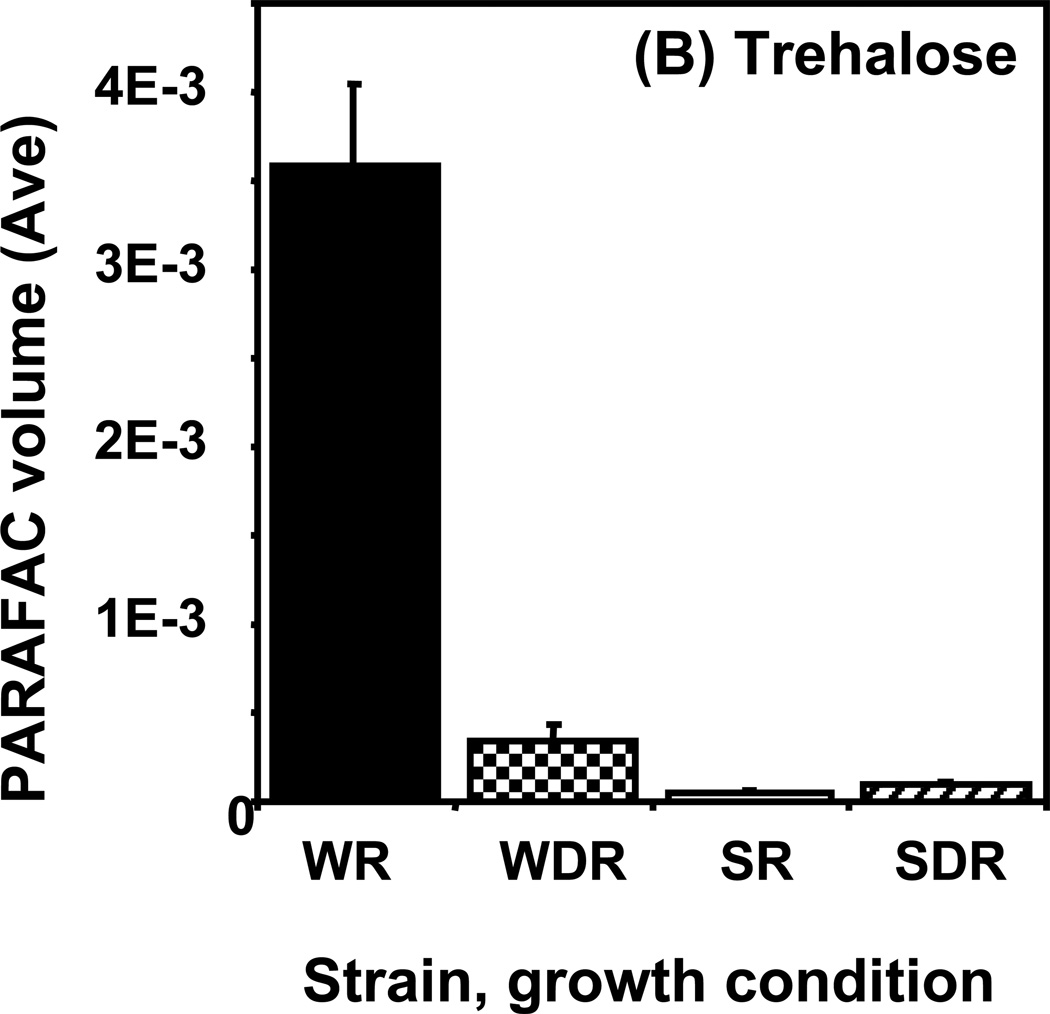
Trehalose is an example of a metabolite exhibiting a “time increase” pattern, shown in Figure 5B. Of the metabolites identified, trehalose had the highest S-ratio, 148, at the 4 h (and 6 h) time point. The relative concentration in WR cells increased over time becoming most significantly elevated at the 4 and 6 h time points. As for glucose, the overall DR/R ratio was low. However, in contrast to glucose in Figure 5A, the level of trehalose increased with time instead of decreasing. There was also a significant difference between the wild type and the snf1Δ mutant strain with the mutant strain having much less trehalose. In previous studies of wild type cells, higher levels of trehalose were observed in DR as compared to R conditions at 6 h.22 While the cells were treated differently in this study, confirmation of a different trend was warranted. This result was verified in three additional biological replicates of the experiment. The peak was further confirmed as trehalose by co-migration with a trehalose standard that had been added to the sample (standard addition method). Additionally, a strain that is unable to synthesize trehalose because it lacks the TPS1 gene, which is required for the conversion of G6P and UDPG into trehalose-6-phosphate, a precursor of trehalose, was analyzed and shown to lack the putative trehalose peak. Trehalose is a non-reducing disaccharide that can serve as a carbohydrate energy storage molecule and a protectant from heat, starvation, osmotic stress, and other stresses.48 Accumulation of trehalose in the WR cells at the late time points is consistent with the observed slowing of growth and entry into the stationary growth phase, as shown in Figure 2, in the presence of glucose. A surprising observation from these results is that Snf1 seems to be required for the accumulation of trehalose in medium with abundant glucose, conditions where it is thought to be inactive. There is evidence in the literature that Snf1 may play a role in response to stress even when glucose is not growth-limiting.49
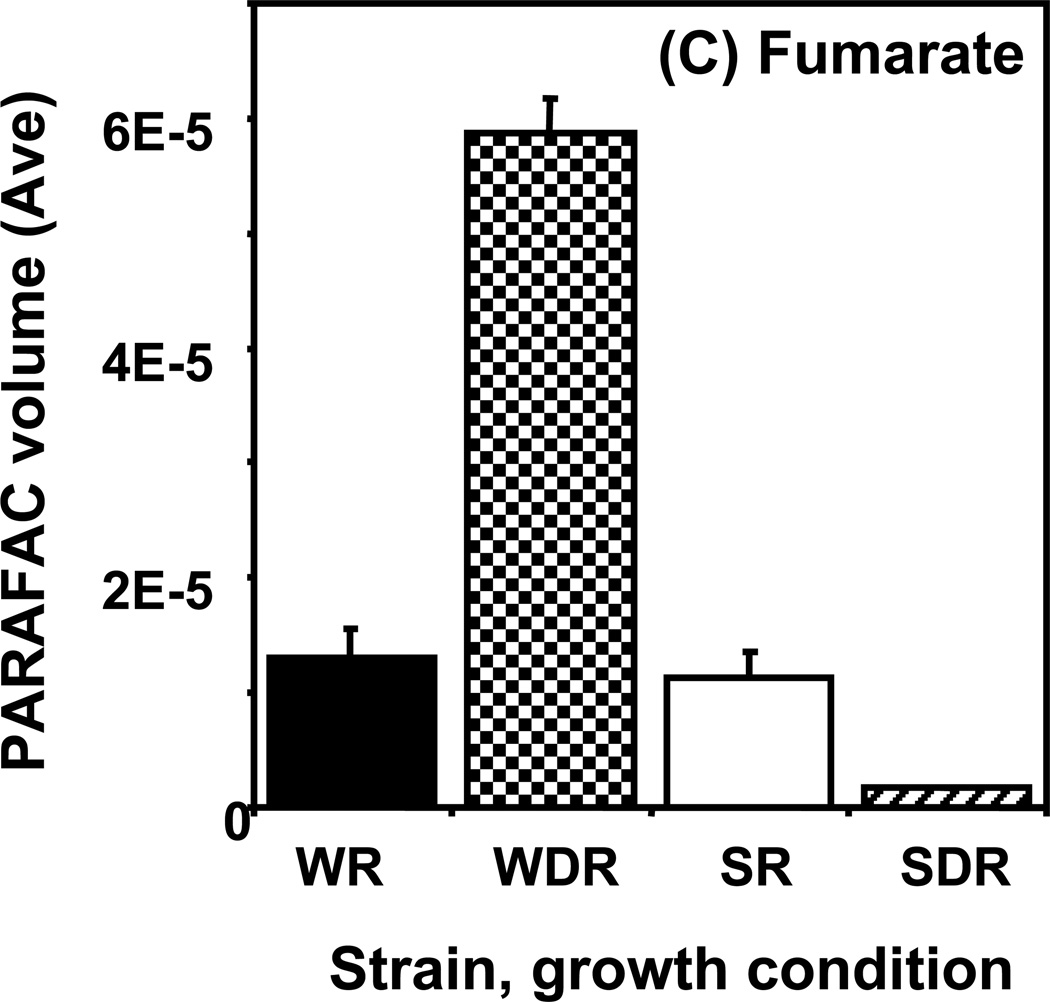
As for trehalose, fumarate demonstrated a “time increase” pattern as shown in Figure 5C. The amount of fumarate detected in wild type cells showed a large increase with time that was not observed in the snf1Δ mutant cells. This is reflected in the high DR/R ratio for wild type cells at the 6 h time point and a ratio of close to 1 for the snf1Δ mutant cells. Fumarate is an intermediate of the TCA cycle, which is most active when cells are growing on non-fermentable carbon sources in the absence of glucose. The Snf1 protein kinase is required for maximal expression of a number of genes encoding TCA cycle proteins under these growth conditions.41 Our observations are consistent with the prediction that snf1Δ mutant cells should have lower amounts of TCA cycle intermediates. The other detected members of the TCA cycle also displayed a time-dependent increase that was absent in snf1Δ mutant cells. Taken together, these results suggest that carbon flow through the TCA cycle is severely reduced in the absence of the Snf1 protein kinase.
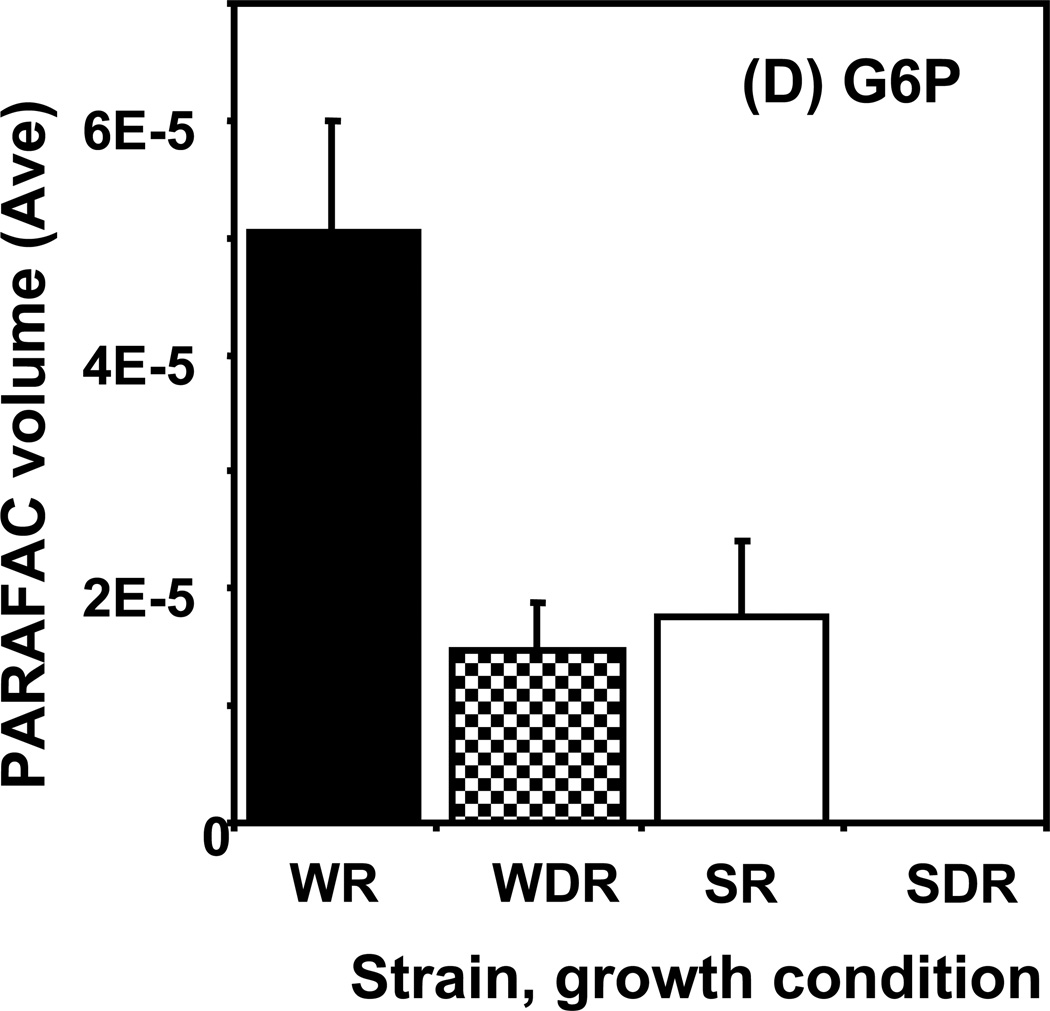
An example of the “time peak” pattern is provided by glucose-6-phosphate (G6P) shown in Figure 5D. The amount of G6P in wild type R cells was observed to increase from the early time points until it reached its highest level by 4 h, 2.5-fold higher than the level at 0.5 h. It then decreased almost 2-fold by the 6 h time point. The decrease in G6P in R wild type cells observed at the later time points is consistent with a decreasing flow of carbon through glycolysis that accompanies entry into stationary phase. In wild type DR cells, G6P was detected at early time points. However, after 2 h, when the glucose of the DR medium was fully exhausted, the level of G6P became undetectable. G6P in R snf1Δ mutant cells did not increase as in the wild type cells, remaining relatively constant during the course of the experiment and was undetectable in DR snf1Δ mutant cells. G6P is the first cellular metabolite formed when glucose in taken up by yeast cells. It is located at the beginning of the glycolytic and the pentose phosphate pathways and can be used to synthesize trehalose in response to environmental stresses.48 Cellular level of G6P appear to be carefully regulated to avoid excess intracellular G6P that seems to be toxic to cells.50 The peak in G6P corresponds to the beginning of the trehalose accumulation in wild type R cells at the 4 h time point. This is nicely predicted by the hypothesis that trehalose synthesis can be used by yeast to sequester G6P so that it does not accumulate in excess and cause a toxic metabolic imbalance.
Examples of “unpatterned” metabolites are stearic acid and glutamic acid. Stearic acid is an 18 carbon saturated fatty acid whose amount remained essentially constant between sample classes and time points as shown in Figure 5E. The DR/R ratio was approximately 1, the wild type and mutant levels were also approximately equal at all time points. Similar results were obtained for the amino acid, glutamic acid, as shown in Figure 5F. However, unlike for stearic acid, the level of glutamic acid in the DR wild type strain was elevated compared to the level in the DR snf1Δ mutant strain. Glutamic acid is directly synthesized from oxoglutarate, an intermediate of the TCA cycle. Results presented earlier show that the levels of TCA cycle intermediates are significantly reduced in DR snf1Δ mutant cells. This may account for the observed lower level of glutamic acid.
The time course patterns offer interesting insight to the dynamic changes in metabolite levels and perhaps how levels between metabolites are related to each other (i.e., G6P and trehalose). However, the time course patterns can overshadow the overriding strain/growth condition trends, which are also of interest. In order to comprehensively identify metabolite concentration differences between yeast strain and growth conditions over the course of the experiment TIC-normalized time point data were averaged together for each of the four strain and growth condition combinations. The same six metabolites from Figure 5 are shown in Figure 6 after time course averaging. Approaching the data in this way, the overall relationship between the various metabolite levels and the condition and strain was clarified.
Figure 6.
Averages of time course data are shown for the same metabolites as in Figure 5: (A) glucose, (B) trehalose, (C) fumarate, (D) glucose-6-phosphate (G6P), (E) stearic acid, and (F) glutamic acid.
Since it was impractical to show all of the metabolites found to change significantly per growth condition and yeasts strain, PCA was employed as a data comparison tool to determine similarities between metabolites and to investigate time dependencies. This is a different approach to PCA than is typically used because the metabolites are not expected to form tight clusters or groups. Instead the relative position in the PCA plot of the metabolites to each other can be used to discern trends and patterns. This provides a qualitative platform to discuss both similarities between metabolites and the impact of sampling time on metabolite classifications and the conclusions drawn from the data. Each point in a given PCA plot represents one metabolite. The metabolites’ coordinates are provided in Supporting Information (Table S1). Using these coordinates, other metabolites of interest can be compared to the patterns for the six metabolites selected as representatives in Figures 5 and 6.
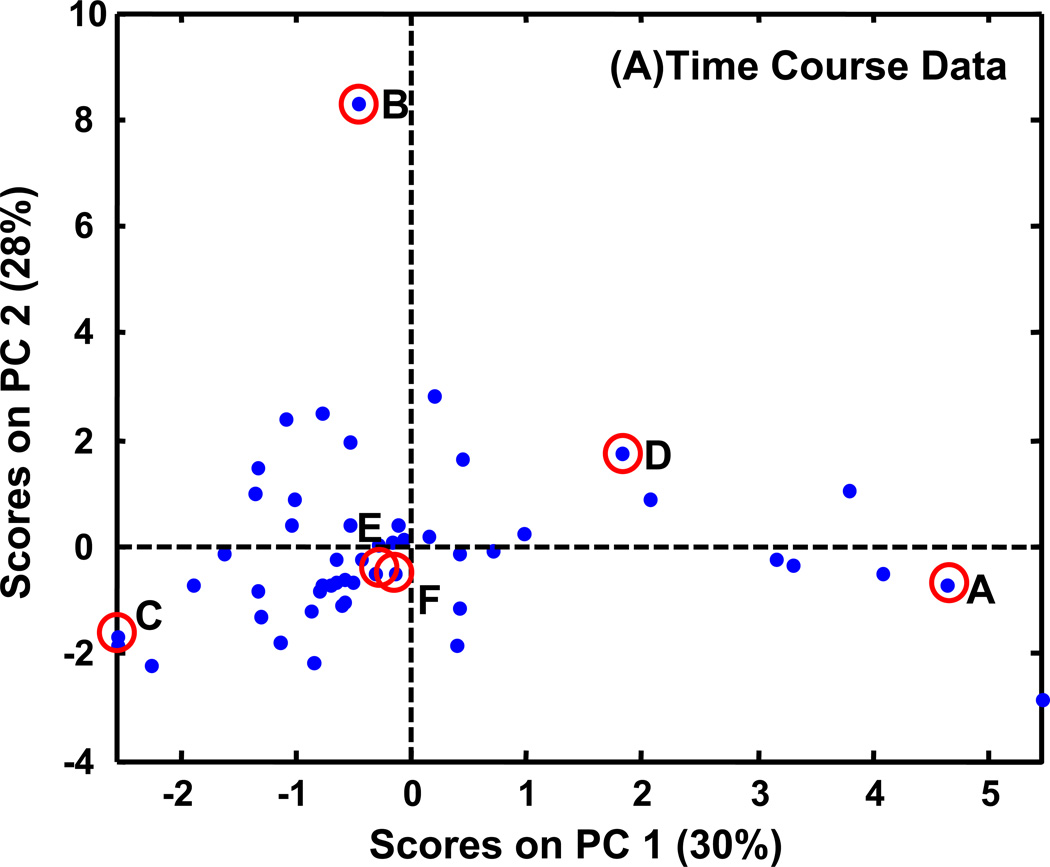
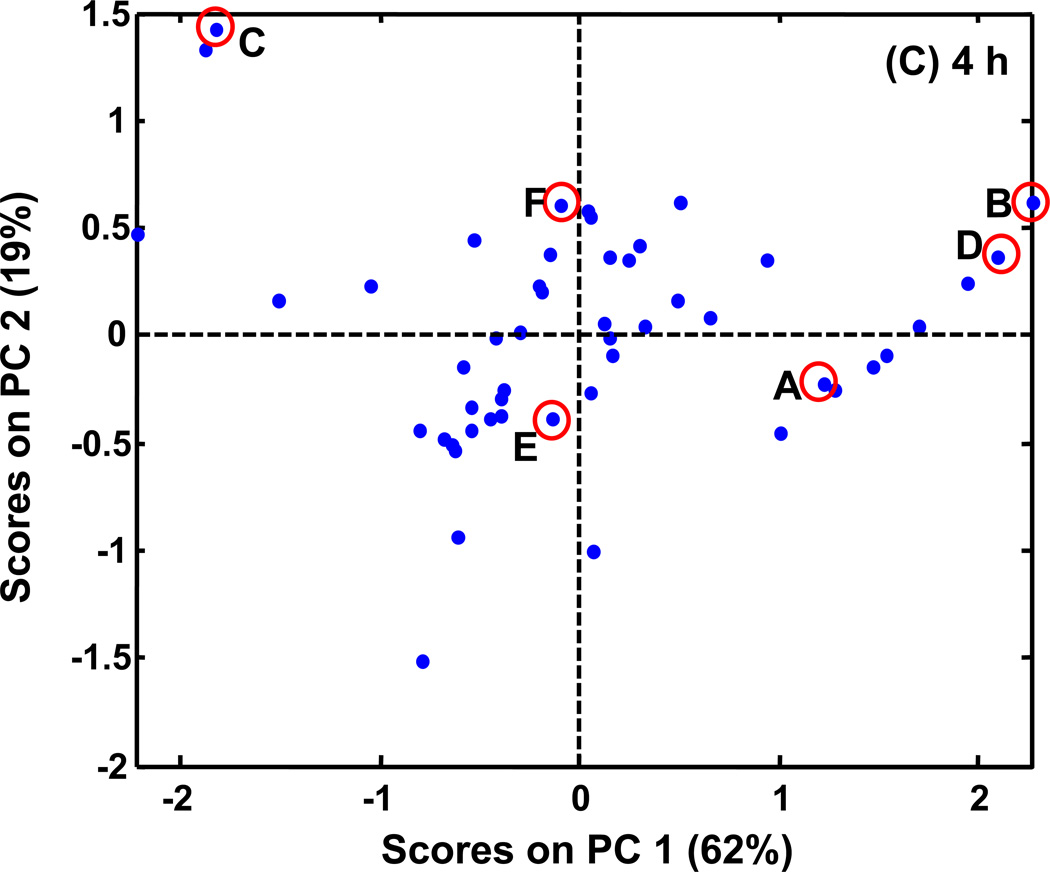
For all of the PCA plots, the data values were mean centered to eliminate the undue influence of data intensity and focus instead on data patterns. Figure 7A shows the results of the first analysis approach of using all of the time course data without time course averaging. PC1 captured only 30% of the variance. Note that in this figure, and other PCA scores plots presented, that PCA is used to discern trends in the metabolite patterns and not necessarily to expect clustering, so in this regard it is a comparison tool and not a classification tool. Using the same six metabolites shown in Figure 5, indicated in the PCA plot, it was determined that PC1 captured the various time patterns creating a continuum between one extreme and another. Trehalose (B) and fumarate (C) that both exhibit a time growth pattern have negative scores on PC1, while glucose (A) with a time decay pattern has the most positive score on PC1. Stearic acid (E) and glutamic acid (F) that do not show a distinct time course pattern fall near the PC1 center axis and G6P (D) that shows the time peak pattern has a positive score on PC1. The time patterns of the other metabolites can be discerned based on their relative position in the scores plot to the six representative metabolites.
Figure 7.
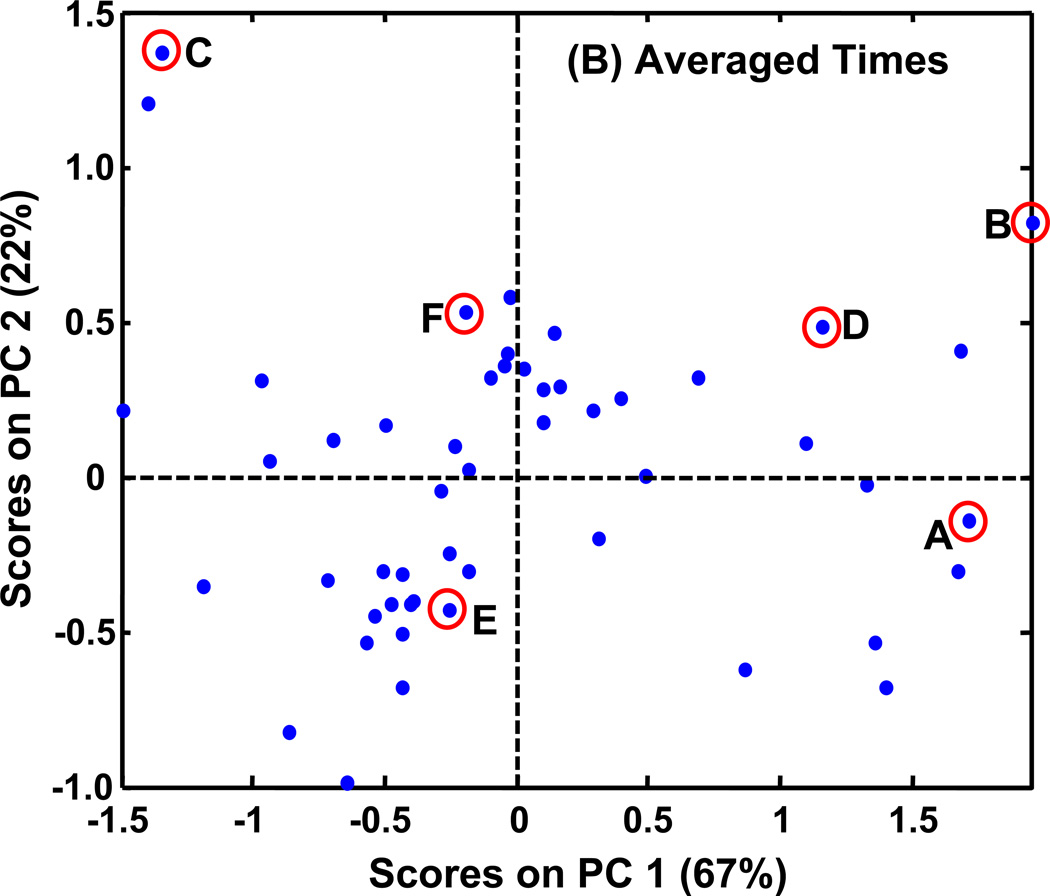
PCA scores plots of PARAFAC signal volume patterns for each metabolite, normalized as explained in the text. The same six metabolites shown in Figures 5 (and 6) are indicated on these plots with letters corresponding to Figures 5 (and 6). (A) PCA results with time course information when only injection replicates are averaged. There are 16 classes (WR, WDR, SR, SDR) × (0.5, 2, 4, 6 h). (B) PCA results when all injections, and time points are averaged for a given growth condition and yeast strain. There are four classes (WR, WDR, SR, SDR). (C) PCA results for a single time, 4 h. There are four classes (WR, WDR, SR, SDR).
Removing the time dependency from the data by time point averaging clarified the relationship between the growth conditions and the strains, as demonstrated by the selected metabolites in Figure 6. The PCA scores plot in Figure 7A was also clarified by prior time point averaging, as shown in Figure 7B. This data analysis approach would be analogous to pooling samples prior to analysis. Mapping the six metabolites onto the scores plot allows one to discern the source of variance. With the time patterns averaged out, PC1 captured 67% of the variance and primarily captured the differences between DR and R conditions. Fumarate (C) with a high DR/R ratio has a negative score on PC1. Stearic acid (E) and glutamic acid (F) with DR/R ratios approximately equal to 1 are close to the PC1 axis. Additionally, glucose (A), trehalose (B), and G6P (D) that have low DR/R ratios all have positive scores on PC1. PC2 captured an additional 22% of the variance that can be attributed to differences between the snf1Δ mutant strain and the wild type strain. The metabolites with positive scores on PC2 (B, C, D, F) all had lower levels in the mutant strain than in the wild type strain. Glucose (A) and stearic acid (E), which have comparable levels in the mutant and wild type cells, have negative scores on PC2. This plot does not directly show any time course information, but instead it contains a summary of all the time course data. This is an important benefit over probing only one time point because a metabolite data point is not lost from the plot as it might be if it is not present at a given time point.
Many experiments in the literature do not collect time course data or pool samples but instead only investigate a single time point. In order to determine if a single time point would provide as comprehensive a data set as time point averaged data, PCA plots for each individual time point were examined. The PCA results from time 4 h are shown in Figure 7C. The results are most similar to those from the time course averages (Figure 7B). PC1 again captured the differences between R and DR resulting in 62% of the variance. Additionally, PC2 captured the differences between the mutant and the wild type strains (another 19% of the variance). The six metabolites map onto the scores plot in the same way as in the summed averages plot.
Results from time 6 h and 2 h are also similar and are provided in Supporting Information (Figure S2A and S2B). For example, at time 2 h, 48% and 30% variance are captured by the first 2 PCs, respectively. The differences observed at 2 h between the strain/growth conditions are less distinct than they become at later time points. At time 6 h, the first two PCs capture 59% and 22%, respectively. However, some of the metabolites with the “time peak” pattern have started to drop in concentration by 6 h, so the scores plot at time 4 h is more similar to the average plot. While there are some differences between these time points, the PCs still capture variance based on the same trends. This is not the case for the scores plot at time 0.5 h provided in Supporting Information (Figure S2C). This plot is quite different from all the other scores plots. The variance captured on PC1 was primarily related to the number of different classes in which the metabolite was present. Metabolites with negative scores on PC1 have information in all four classes, as the scores on PC1 become more positive there are fewer classes that contain information. Trehalose (B) has the most positive score on PC1 and can only be detected in WR conditions at 0.5 h while stearic acid (E) has one of the more negative scores on PC1 and can be detected in all four conditions/strains. Because PCA focuses on this trend, rather than strain, growth condition, or time pattern, conclusions made from only the 0.5 h time point would be misleading in regards to strain and condition patterns.
These results suggest that PCA can be used to observe metabolite patterns. There are a number of ways to approach a rich time course data set such as this. PCA performed on the time course information is most useful to see time patterns and less useful to see strain/growth condition patterns. PCA on a time course averaged data set loses the time course pattern information but is better to identify trends between strains and conditions. Averaging time course data yields more effective data comparisons than using a single time point. And, as stated earlier, one could also pool samples taken over a time course prior to analysis to obtain the averaging effect while using less instrument time. Further yet, it is possible to substitute a single time point for averaged time course data with the penalty of losing a small subset of metabolites that are not detected at that time in the analysis. Additionally, because the metabolome is dynamic, not all time point data sets will provide the same information. Initial investigation should be done to determine the best time point for a given study.
For the yeast strains and growth conditions tested in this study if a single time point were to be substituted, data collection at either 4 h or 6 h provided the most information. With all of these results it was observed that carbon flow through the TCA cycle in DR conditions is severely reduced in the absence of the Snf1 protein complex as expected. A surprising observation is that the absence of the Snf1 protein complex altered metabolite levels in R conditions as well where it was not thought to play a role.
Supplementary Material
ACKNOWLEDGMENT
This work was supported by grants from the National Institute of Health (GM26079 and DK67276 to ETY) and also by the LECO Corporation (to RES).
Footnotes
A capital letter followed by lowercase letters of a gene name indicates a protein (Snf1).
A capital letter followed by uppercase letters, in italics, of a gene name indicates a normal or wild-type gene (SNF1); gene names in italicized lower case letters indicate a defective or deleted gene (snf1).
SUPPORTING INFORMATION AVAILABLE
Additional information as noted in the text is provided. This information is available free of charge via the Internet at http://pubs.acs.org.
LITERATURE CITED
- 1.Pierce KM, Hoggard JC, Hope JL, Rainey PM, Hoofnagle AN, Jack RM, Wright BW, Synovec RE. Analytical Chemistry. 2006;78:5068–5075. doi: 10.1021/ac0602625. [DOI] [PubMed] [Google Scholar]
- 2.Mohler RE, Tu BP, Dombek KM, Hoggard JC, Young ET, Synovec RE. Journal of Chromatography A. 2008;1186:401–411. doi: 10.1016/j.chroma.2007.10.063. [DOI] [PMC free article] [PubMed] [Google Scholar]
- 3.Goodacre R, Vaidyanathan S, Dunn WB, Harrigan GG, Kell DB. Trends in Biotechnology. 2004;22:245–252. doi: 10.1016/j.tibtech.2004.03.007. [DOI] [PubMed] [Google Scholar]
- 4.Weckwerth W, Morgenthal K. Drug Discovery Today. 2005;10:1551–1558. doi: 10.1016/S1359-6446(05)03609-3. [DOI] [PubMed] [Google Scholar]
- 5.Dunn WB, Bailey NJ, Johnson HE. The Analyst. 2005;130:606–625. doi: 10.1039/b418288j. [DOI] [PubMed] [Google Scholar]
- 6.Hollywood K, Brison DR, Goodacre R. Proteomics. 2006;6:4716–4723. doi: 10.1002/pmic.200600106. [DOI] [PubMed] [Google Scholar]
- 7.Bino RJ, Hall RD, Fiehn O, Kopka J, Saito K, Draper J, Nikolau BJ, Mendes P, Roessner-Tunali U, Beale MH, Trethewey RN, Lange BM, Wurtele ES, Sumner LW. Trends in Plant Science. 2004;9:418–425. doi: 10.1016/j.tplants.2004.07.004. [DOI] [PubMed] [Google Scholar]
- 8.Fiehn O. Plant Molecular Biology. 2002;48:155–171. [PubMed] [Google Scholar]
- 9.Sweetlove LJ, Last RL, Fernie AR. Plant Physiology. 2003;132:420–425. doi: 10.1104/pp.103.022004. [DOI] [PMC free article] [PubMed] [Google Scholar]
- 10.Raamsdonk LM, Teusink B, Broadhurst D, Zhang N, Hayes A, Walsh MC, Berden JA, Brindle KM, Kell DB, Rowland JJ, Westerhoff HV, van Dam K, Oliver SG. Nature Biotechnology. 2001;19:45–50. doi: 10.1038/83496. [DOI] [PubMed] [Google Scholar]
- 11.ter Kuile BH, Westerhoff HV. Federation of European Biochemical Societies Letters. 2001;500:169–171. doi: 10.1016/s0014-5793(01)02613-8. [DOI] [PubMed] [Google Scholar]
- 12.Dunn WB, Ellis DI. Trends in Analytical Chemistry. 2005;24:285–294. [Google Scholar]
- 13.Weckwerth W, Fiehn O. Current Opinions in Biotechnology. 2002;13:156–160. doi: 10.1016/s0958-1669(02)00299-9. [DOI] [PubMed] [Google Scholar]
- 14.Hope JL, Prazen BJ, Nilsson EJ, Lidstrom ME, Synovec RE. Talanta. 2005;65:380–388. doi: 10.1016/j.talanta.2004.06.025. [DOI] [PubMed] [Google Scholar]
- 15.Sinha AE, Prazen BJ, Fraga CG, Synovec RE. Journal of Chromatography A. 2003;1019:79–87. doi: 10.1016/j.chroma.2003.08.047. [DOI] [PubMed] [Google Scholar]
- 16.Shellie R, Marriott P, Morrison P. Analytical Chemistry. 2001;73:1336–1344. doi: 10.1021/ac034492k. [DOI] [PubMed] [Google Scholar]
- 17.van Deursen M, Beens J, Reijenga J, Lipman P, Cramers C, Blomberg J. Journal of High Resolution Chromatography. 2000;23:507–510. [Google Scholar]
- 18.Dalluge J, van Rijn M, Beens J, Vreuls RJ, Brinkman UA Th. Journal of Chromatography A. 2002;965:207–217. doi: 10.1016/s0021-9673(01)01324-3. [DOI] [PubMed] [Google Scholar]
- 19.Dalluge J, Vreuls RJ, Beens J, Brinkman UA Th. Journal of Separation Science. 2002;25:201–214. [Google Scholar]
- 20.Welthagen W, Shellie R, Spranger J, Ristow M, Zimmermann R, Fiehn O. Metabolomics. 2005;1:65. doi: 10.1016/j.chroma.2005.05.088. [DOI] [PubMed] [Google Scholar]
- 21.Sinha AE, Hope JL, Prazen BJ, Fraga CG, Nilsson EJ, Synovec RE. Journal of Chromatography A. 2004;1056:145–154. [PubMed] [Google Scholar]
- 22.Mohler RE, Dombek KM, Hoggard JC, Young ET, Synovec RE. Analytical Chemistry. 2006;78:2700–2709. doi: 10.1021/ac052106o. [DOI] [PMC free article] [PubMed] [Google Scholar]
- 23.Sinha AE, Hope JL, Prazen BJ, Nilsson EJ, Jack RM, Synovec RE. Journal of Chromatography A. 2004;1058:209–215. [PubMed] [Google Scholar]
- 24.Shellie R, Welthagen W, Zrostlikova J, Spranger J, Ristow M, Fiehn O, Zimmermann R. Journal of Chromatography A. 2005;1086:83–90. doi: 10.1016/j.chroma.2005.05.088. [DOI] [PubMed] [Google Scholar]
- 25.Kell DB. Current Opinions in Microbiology. 2004;7:296–307. doi: 10.1016/j.mib.2004.04.012. [DOI] [PubMed] [Google Scholar]
- 26.Guttman A, Varoglu M, Khandurina J. Drug Discovery Today. 2004;9:136–144. doi: 10.1016/S1359-6446(03)02972-6. [DOI] [PubMed] [Google Scholar]
- 27.Murphy RE, Schure MR, Foley JP. Analytical Chemistry. 1998;70:1585–1594. doi: 10.1021/ac980719d. [DOI] [PubMed] [Google Scholar]
- 28.Liu Z, Phillips JB. Journal of Chromatographic Science. 1991;29:227. [Google Scholar]
- 29.Kinghorn RM, Marriott PJ. Journal of High Resolution Chromatography. 1998;21:620–622. [Google Scholar]
- 30.Beens J, Adahchour M, Vreuls RJJ, van Altena K, Brinkman UA Th. Journal of Chromatography A. 2001;919:127–132. doi: 10.1016/s0021-9673(01)00785-3. [DOI] [PubMed] [Google Scholar]
- 31.Bruckner CA, Prazen BJ, Synovec RE. Analytical Chemistry. 1998;70:2796–2804. [Google Scholar]
- 32.Seeley JV, Kramp F, Hicks CJ. Analytical Chemistry. 2000;72:4346–4352. doi: 10.1021/ac000249z. [DOI] [PubMed] [Google Scholar]
- 33.Shellie R, Mondello L, Marriott P, Dugo G. Journal of Chromatography A. 2002;970:225–234. doi: 10.1016/s0021-9673(02)00653-2. [DOI] [PubMed] [Google Scholar]
- 34.Jonsson P, Gullberg J, Nordstrom A, Kusano M, Kowalczyk M, Sjostrom M, Moritz T. Analytical Chemistry. 2004;76:1738–1745. doi: 10.1021/ac0352427. [DOI] [PubMed] [Google Scholar]
- 35.Jonsson P, Johansson AI, Gullberg J, Trygg J, A J, Grung B, Marklund S, Sjostrom M, Antti H, Moritz T. Analytical Chemistry. 2005;77:5635–5642. doi: 10.1021/ac050601e. [DOI] [PubMed] [Google Scholar]
- 36.Sinha AE, Prazen BJ, Synovec RE. Analytical and Bioanalytical Chemistry. 2004;378:1948–1951. doi: 10.1007/s00216-004-2503-7. [DOI] [PubMed] [Google Scholar]
- 37.Bro R. Chemometrics and Intelligent Laboratory Systems. 1997;38:149–171. [Google Scholar]
- 38.Hoggard JC, Synovec RE. Analytical Chemistry. 2007;79:1611–1619. doi: 10.1021/ac061710b. [DOI] [PubMed] [Google Scholar]
- 39.Sinha AE, Fraga CG, Prazen BJ, Synovec RE. Journal of Chromatography A. 2004;1027:269–277. doi: 10.1016/j.chroma.2003.08.081. [DOI] [PubMed] [Google Scholar]
- 40.Carlson M. Current Opinions in Biotechnology. 1999;2:202–207. [Google Scholar]
- 41.Young ET, Dombek KM, Tachnibana C, Ideker T. The Journal of Biological Chemistry. 2003;278:26146–26158. doi: 10.1074/jbc.M301981200. [DOI] [PubMed] [Google Scholar]
- 42.Kemp BE, Mitchelhill KI, Stapleton D, Michell BJ, Chen Z-P, Witters LA. Trends in Biochemical Sciences. 1999;24:22–25. doi: 10.1016/s0968-0004(98)01340-1. [DOI] [PubMed] [Google Scholar]
- 43.Hardie DG. Nature Reviews Molecular Cell Biology. 2007;8:774–785. doi: 10.1038/nrm2249. [DOI] [PubMed] [Google Scholar]
- 44.Hardie DG. Annual Review of Pharmacology and Toxicology. 2007;47:185–210. doi: 10.1146/annurev.pharmtox.47.120505.105304. [DOI] [PubMed] [Google Scholar]
- 45.Castrillo JI, Hayes A, Mohammed S, Gaskell SJ, Oliver SG. Phytochemistry. 2003;62:929–937. doi: 10.1016/s0031-9422(02)00713-6. [DOI] [PubMed] [Google Scholar]
- 46.Fiehn O, Kopka J, Tretheway RN, Willmitzer L. Analytical Chemistry. 2000;72:3573–3580. doi: 10.1021/ac991142i. [DOI] [PubMed] [Google Scholar]
- 47.Mohler RE, Dombek KM, Hoggard JC, Pierce KM, Young ET, Synovec RE. The Analyst. 2007;132:756–767. doi: 10.1039/b700061h. [DOI] [PubMed] [Google Scholar]
- 48.Voit EO. Journal of Theoretical Biology. 2003;223:55–78. doi: 10.1016/s0022-5193(03)00072-9. [DOI] [PubMed] [Google Scholar]
- 49.Hong S-P, Carlson M. Journal of Biological Chemistry. 2007;282:16838–16845. doi: 10.1074/jbc.M700146200. [DOI] [PubMed] [Google Scholar]
- 50.Vanderpool CK. Current Opinion in Microbiology. 2007;10:146–151. doi: 10.1016/j.mib.2007.03.011. [DOI] [PubMed] [Google Scholar]
Associated Data
This section collects any data citations, data availability statements, or supplementary materials included in this article.


