

Abstract
Background
Osteosarcoma is the most common primary tumor of bone. It is a highly vascular and extremely destructive malignancy mainly affecting children and young adults. We performed microarray-based comparative genomic hybridization (aCGH) and carried out pathway analysis to gain a systemic view on the pathway alterations of the genetically altered genes.
Methods
Recurrent amplified and deleted genes detected by aCGH were subjected to the Kyoto Encyclopedia of Genes and Genomes (KEEG) pathway analysis to identify the altered pathways. Among enriched pathways, vascular endothelial growth factor (VEGF) pathway genes were collectively amplified and the alterations of this pathway were validated by fluorescence in situ hybridization (FISH) and immunohistochemistry in 58 formalin-fixed and paraffin-embedded osteosarcoma archival tissues with clinical follow-up information.
Results
the pathway enrichment analyses of the aCGH data revealed that VEGF pathway genes, including vascular endothelial growth factor A(VEGFA) gene itself, were significantly amplified in osteosarcoma. Genetic amplification of the VEGFA gene, both focally and in larger fragment, was validated by FISH. Notably, amplification of VEGFA gene and elevated expression of the VEGFA protein were significantly associated with microvascular density (MVD) and adverse tumor-free survival in osteosarcoma.
Conclusions
We reported for the first time that VEGF pathway genes including VEGFA gene are amplified in osteosarcoma. Amplification of the VEGFA gene is not only an important mechanism for elevated VEGFA protein expression, but also a poor prognostic factor for tumor-free survival. Combined classification of VEGFA gene amplification and positive VEGFA protein expression might provide more accurate patient stratification method for selection of anti-VEGF therapy for osteosarcoma.
Keywords: Osteosarcoma, Vascular endothelial growth factor A, gene amplification, Fluorescent in situ hybridization, microarray-based comparative genomic hybridization
Introduction
Osteosarcoma is the most common primary tumor of bone affecting approximately 1,500 individuals per year in the United States (Surveillance, Epidemiology, and End Results database, National Cancer Institute). According to the latest statistics of Tianjin Cancer Registry Center in 2006, in Tianjin, the third largest city of China, there were 56 osteosarcoma patients among the population of 9,488,900. Osteosarcoma affects primarily those in the second decade of life with a steady, gradual decrease thereafter 1. Because survival rates in patients with metastatic osteosarcoma have not been improved significantly in recent years, identifying the key genetic and molecular events for osteosarcoma is critical to the development of effective therapeutics 2. Increased vascular endothelial growth factor A (VEGFA) expression has been associated with osteosarcoma development and metastasis. Furthermore, inhibition of vascular endothelial growth factor (VEGF) signaling has resulted in suppression of both tumor-induced angiogenesis and tumor growth 3, 4. A number of preclinical and clinical studies have provided evidence that antiangiogenic therapies such as antibodies and small molecule inhibitors against the VEGF-VEGFR axis are promising strategies in the treatment of osteosarcoma 3-5. A number of transcriptional factors, including hypoxia inducible factor 1, alpha subunit (HIF-1alpha) and retinoblastoma 1 (RB1), have been reported to activate the VEGF expression and angiogenesis in cancer cells 6. However, despite numerous studies reporting chromosomal and gene aberrations in human osteosarcoma, no genetic aberrations of the VEGF pathway have been reported in this tumor type 7-10. In this study, we interrogated the genome-wide microarray-based comparative genomic hybridization (aCGH) profiling data acquired from osteosarcoma with a pathway analysis and found that VEGF pathway genes including VEGFA were amplified. We further determined the clinical significance of amplification of VEGFA gene in osteosarcoma.
Materials and methods
Osteosarcoma tissues and clinical information
We collected clinicopathologic data and formalin-fixed and paraffin-embedded (FFPE) tissue sections from 58 primary conventional central osteosarcoma cases at the Tianjin Medical University Cancer Institute and Hospital in Tianjin, China. The clinical and pathological characters included the age, gender, locations, Enneking staging, and follow-up (Table 1). All neoadjuvant and adjuvant chemotherapy had been administered according to the Rosen T10 regimen 11, 12. Disease-free and overall survival rates ranged from 0 to 94 months, with medians of 9 months and 13 months, respectively. In addition, we obtained 10 frozen biopsy samples (from 9 patients) from the Tissue Bank of the Tianjin Medical University Cancer Institute and Hospital to perform the aCGH microarray analysis (Gene Expression Omnibus ID 19180 in GEO database, GSE19180) 2. All of the tissue and information collection took place at Tianjin Medical University Cancer Institute and Hospital with Institutional Review Board (IRB) approved protocols and the patients' consent.
Table 1. the clinical and pathological features in 58 human conventional osteosarcomas.
| N | Disease free survival | Overall survival | ||||||||
|---|---|---|---|---|---|---|---|---|---|---|
|
|
|
|||||||||
| P | HR | 95.0% CI | P | HR | 95.0% CI | |||||
| L | U | L | U | |||||||
| Sex | Male | 29 | 0.86 | 0.07* | ||||||
| Female | 29 | 0.86 | 1.11 | 0.36 | 3.44 | 0.08 | 3.49 | 0.86 | 14.28 | |
| Age group | <=15y | 14 | 0.76 | 0.79 | ||||||
| 15-20y | 23 | 0.94 | 1.10E+04 | 0 | 1.40E+116 | 0.5 | 1.82 | 0.32 | 10.42 | |
| 21-30y | 11 | 0.94 | 3.70E+04 | 0 | 4.40E+116 | 0.72 | 0.73 | 0.13 | 4.05 | |
| 31-40y | 1 | 0.93 | 5.30E+04 | 0 | 6.40E+116 | 0.97 | 0 | 0 | 1.90E+282 | |
| >40y | 9 | 1 | 1.02 | 0 | 3.90E+225 | 0.99 | 0 | 0 | . | |
| Tumor location | limbs | 51 | 0.28 | 0.97 | ||||||
| Others | 7 | 0.48 | 23.34 | 0.004 | 1.60E+05 | 0.97 | 0.97 | 0.12 | 7.72 | |
| Enneking stage | 1 | 4 | 0.96 | 0.43 | ||||||
| IIA | 19 | 0.78 | 0.71 | 0.06 | 7.88 | 0.17 | 0.1 | 0.004 | 2.74 | |
| IIB | 2 | 0.631 | 0.59 | 0.07 | 5.01 | 0.1 | 0.09 | 0.01 | 1.61 | |
| III | 1 | 0.897 | 0.83 | 0.05 | 13.39 | 0.99 | 0 | 0 | ||
| Neoadjuvant | No | 10 | 0.51 | 1.5E-4* | ||||||
| chemotherapy | Yes | 30 | 0.51 | 1.51 | 0.44 | 5.15 | 0.003 | 11.85 | 2.36 | 59.45 |
| Adjuvant | No | 3 | 0.21 | 0.41 | ||||||
| chemotherapy | Yes | 19 | 0.43 | 0.04 | 0 | 129.34 | 0.61 | 0.04 | 0 | 1.20E+04 |
| recurrence | No | 50 | 0.49 | |||||||
| Yes | 8 | 0.49 | 2.05 | 0.26 | 16.26 | |||||
| Metastasis | No | 38 | 0.045* | |||||||
| Yes | 11 | 0.436 | 0.01 | 0 | 2.40E+03 | |||||
Significantly different;
L: lower; U: upper
Array CGH hybridization and Kyoto Encyclopedia of Genes and Genomes (KEGG) Pathways analysis
Array comparative genomic hybridization of osteosarcoma genomic DNA was performed on Agilent Human Genome CGH Microarrays (4×44k) (Agilent Technologies, Palo Alto, CA). All aCGH analyses were performed with R 2.10.0. as previously described 2. Briefly, the median-normalized log-2 ratio data were first subjected to a circular binary segmentation (CBS) algorithm 13 to reduce the effect of noise. Then, the CGHcall algorithm 14 was used to call segments of DNA sequences as amplified or deleted in each sample. A permutation analysis was further applied to call recurrent copy number aberration in osteosarcoma 2. In addition, we obtained raw aCGH data (GEO database ID, GSE9654) of another 10 biopsy samples10. Both datasets were measured on Agilent Human Genome CGH Microarrays. Another set of bacterial artificial chromosome (BAC) clone–based aCGH array data from 36 cases of osteosarcoma were also analyzed to confirm the overall recurrent gene copy alteration patterns 15.
Pathway enrichment analysis was performed separately on the recurrent amplified and deleted gene lists from gene sets GSE19180 and GSE 9654. Here, we used the gene annotations data in the Kyoto Encyclopedia of Genes and Genomes (KEGG). Pathways that had more annotations in our gene list than expected (Fisher's exact test, P<0.05) were considered to be significantly enriched with amplified or deleted genes.
FISH detection and analysis
A 5- TAMRA dUTP-labeled BAC clone RP1-261G23 (conjugated to produce an orange signal) covering CHR6: 43709997-43882030 was used for the VEGFA probe (Empire Genomics, Buffalo, New York, USA). A chromosome enumeration probe 6 (CEP6) (D6Z1) Spectrum Green Probe (Abbott Molecular, Abbott Park, IL, USA) was used for the reference probe. The CEP 6 probe showing green signal indicates the chromosome 6 centromere and the VEGFA probe shows orange signal representing the VEGFA gene copy number. FISH was performed and analyzed in 58 FFPE tissues as described in previous published papers with some modifications 16, 17. Briefly, after pretreatment of the slides using the Paraffin Pretreatment Kit II (Abbott Molecular, Illinois) and the following denaturation of the specimen DNA in denaturing solution (70% formamide/2×SSC, PH 7.0), 10–20μl of mixed denatured VEGFA probe and CEP 6 probe were applied to the slides in an approximately 1cm2 area selected for a pure tumor population (>90% tumor cells), and hybridization was performed at 37°C overnight in a moist chamber. Excess probe was washed and the nuclei were counterstained with 4′,6-diamidino-2-phenylindole dihydrochloride (DAPI). Slides were analyzed using a multi-filtered fluorescence microscope (Olympus BX5, Applied Imaging) and Cytovision Genus 4.0 software (Applied Imaging, San Jose, CA, USA) using a × 10 ocular and × 63 oil immersion lenses following standard procedures. Staining of experimental slides was accompanied concurrently with positive and negative control slides to monitor assay performance and to assess the accuracy of signal enumeration.
The copy number alteration of VEGFA gene was evaluated according to the established methods by two pathologists in a blinded fashion 18, 19. Briefly, copy number alteration in which >90% of nuclei showed hybridization signals were considered informative. In the informative cases, if the ratio of orange signals to green signals higher than 1 and there were more than two orange and green signals in each single tumor cell, it was considered focal VEGFA amplification. If the ratio was 1 and there were more than two green and orange signals in each single tumor cells, it was considered large fragment amplification. If the ratio was lower than 1 or there were only two green and orange signals in each single tumor cells, it was considered no VEGFA amplification.
Immunohistochemical analysis and determination of microvascular density
The 58 FFPE tissues were sectioned for immunohistochemical staining as described previously 2. Antibodies of VEGFA and CD34, products of the Abcam Company (Cambridge, CB4 0WN, UK), were used at dilutions of 1:100 and 1:150. Known VEGFA and CD34 positive control slides were also stained as quality control. Assessment of VEGFA expression was made based on the overall intensity of membranous and cytoplasmic staining within the tumor cells and the percentage of cells stained 20. The intensity of cytoplasmic immunostaining was assessed and graded as follows: 0, no staining; 1, weak; 2, moderate; and 3, strong staining. The percentage of cells stained for VEGFA was calculated by comparing the number of positively stained cells relative to the number of nuclei (0, no cells stained; 1, 1-25%; 2, 26-50%; and 3, >50%). By combining the two scores, the degree of VEGFA protein expression was determined; a score of lower than 2 represents negative expression (-); 2, weak positive expression (+); 3-4, moderate/multifocal positive (++); and 5-6, strong/diffuse positive expression (+++). It should be noted that although some tumors were designated as negative for VEGFA expression based on this criteria, there was no cases where VEGFA staining was completely absent. Because of the subjectivity and semi-quantitative nature of immunohistochemistry, such grading system is commonly used to indicate the relative levels of a marker staining. Anti-CD34 antibody was used for immunohistochemical staining of endothelial cells in tumor sections to determine the microvascular density (MVD), as previously described 20.
Statistics
Comparisons of means were performed by using Student's t-test or ANOVA. Comparisons of frequencies were performed by using the Chi-square test or Fisher's exact test when necessary. Kaplan-Meier and Cox regression analysis were used to examine the relationship between survival rate and the following variables: age, sex, tumor site, metastasis, recurrence, treatments, protein expression, and gene amplification. A P value of less than 0.05 was considered statistically significant in multivariate analysis. All these analyses were performed by using SPSS software version 16.0. All aCGH analyses were performed in R 2.10.0.
Results
Osteosarcomas of diverse populations share common genetic defects
To gain insight into the most common genetic changes at the chromosomal level in osteosarcoma, we carried out a whole-genome aCGH analysis of fresh osteosarcoma samples from Chinese patients and identified major regions of genetic alterations (GSE19180) 2. Our analysis showed that the pattern of overall copy number alterations from our set of aCGH data was strikingly similar to that from an independent aCGH dataset (GSE9654) of osteosarcoma samples obtained from Canadian patients10. Notably, one recently published BAC array CGH dataset obtained from 36 Norwegian patients exhibits a very similar pattern at chromosomal level with the two Agilent aCGH datasets from the Chinese and Canadian patients 15. This suggests that osteosarcomas from diverse populations, surprisingly, share common and distinct genetic alterations. This unexpected similarity is highly significant because unlike other cancer types, osteosarcoma samples are technically difficult to acquire, and thus the small sample size issue commonly associated with most cancer types may not be so serious for osteosarcoma. In this study, we combined the two high resolution Agilent aCGH datasets for subsequent analysis to acquire the most commonly altered genes at the gene copy level (Figure 1, A and B). BAC aCGH dataset was not used because of its low resolution at gene level 15.
Figure 1. Chromosomal and gene aberrations of 20 human osteosarcomas.
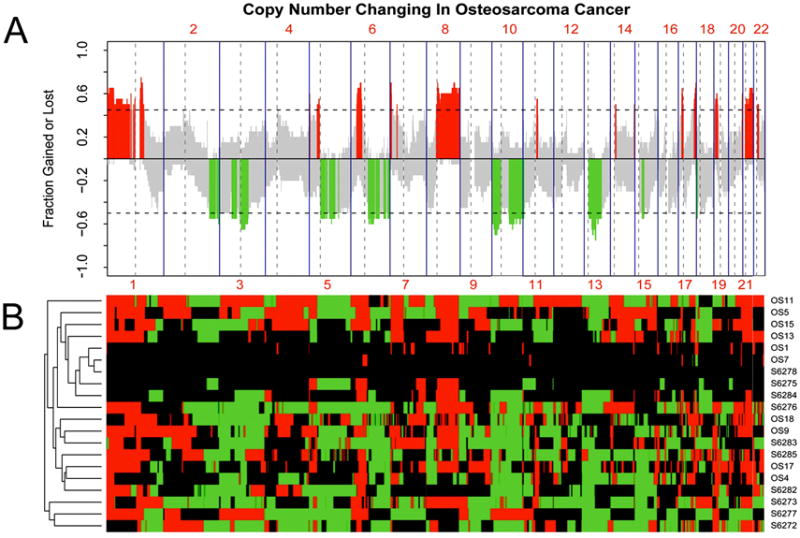
(A) The recurrence pattern of copy number alterations (CNAs) in two aCGH datasets (GSE19180 and GSE9654). The x-axis denotes chromosome numbers; the y-axis shows frequency of aberration of gains (positive) and losses (negative) for each measured aCGH probe arranged based on their genomic coordinates along the x-axis. Dashed lines indicate the thresholds for significant recurrent aberrations. Measured sequences with aberration frequency exceeding the thresholds are color-coded to emphasize the locations of significantly recurrent aberrations. Red denotes significantly recurrent amplification, and green denotes significantly recurrent deletion. Gray represents nonsignificant recurrence of aberrations. (B) Heatmap of genetic aberrations corresponding to CNAs shown in A. The columns denote the measured aCGH probes which are arranged based on their genomic coordinates in chromosome order; the rows show the case ID of the 20 OS samples. Red denotes the probe is amplified in corresponding sample, and green denotes deleted. Black represents no copy number aberrations.
Genetic alterations of VEGF pathway including VEGFA gene in osteosarcoma
Our analysis of the pooled GSE19180 and GSE9654 datasets led to the identification of the amplifications of 1p, 6p, 18q, and 21q, as well as the deletions of 2q, 4q, 6q,10p, 10q, and 13q (Figure 1, A and B). These alterations included 3,795 genes (2,519 significantly amplified and 1,276 significantly deleted genes) that showed statistically significant aberration among the 20 osteosarcoma samples. To gain a systemic insight into the genetic preferences that allow emergence of osteosarcoma, we performed a KEEG pathway enrichment analysis of these amplified and deleted genes. This analysis identified 33 key pathways that had multiple component genes altered at chromosomal levels. These pathways included VEGF signaling, mammalian target of rapamycin (mTOR), cellular adhesion molecules (CAMs), Adherens junction, wingless-type MMTV integration site family (Wnt) signaling, and Hedgehog signaling pathways (Table 2). Among them, the VEGF pathway was top ranked with 13 amplified genes, including VEGFA itself (Figure 2, A and B). The genes with copy number aberrations in the VEGF pathway were indicated in the pathway graph shown in Figure 2B. The top ranking of VEGF pathway genes for genetic alteration in osteosarcoma is novel but not entirely surprising because osteosarcoma is a highly vascular tumor type. The only other known related case is a report that shows VEGFA-containing 6p21 chromosomal overrepresentation in 27-51% of uveal melanoma 21 and it is not clear whether the other genes in the VEGF pathway are also amplified in these uveal melanomas.
Table 2. KEEG Pathway analysis of genetic aberrations in osteosarcoma.
| KEEG pathways | Gain P value | Deletion P value |
|---|---|---|
| 1. VEGF signaling pathway | 0.000612 | 0.994021 |
| 2. Tight junction | 0.044333 | 0.719851 |
| 3. mTOR signaling pathway | 0.024894 | 0.676616 |
| 4. Hedgehog signaling pathway | 0.609822 | 0.012811 |
| 5. Cell adhesion molecules (CAMs) | 0.630 | 0.05 |
| 6. Adherens junction | 0.119062 | 0.014329 |
| 7. Wnt signaling pathway | 0.81461 | 0.01039 |
| 8. alpha-Linolenic acid metabolism | 0.003363 | 1 |
| 9. Asthma | 0.003038 | 1 |
| 10. Ether lipid metabolism | 0.006548 | 1 |
| 11. Nitrogen metabolism | 0.007842 | 0.48671 |
| 12. Peptidoglycan biosynthesis | 0.017208 | 1 |
| 13. Synthesis and degradation of ketone bodies | 0.019871 | 1 |
| 14. Alzheimer's disease | 0.020851 | 0.290129 |
| 15. Biosynthesis of unsaturated fatty acids | 0.021314 | 0.198297 |
| 16. Arachidonic acid metabolism | 0.022277 | 0.323251 |
| 17. Systemic lupus erythematosus | 2.49E-06 | 0.997392 |
| 18. Glycan structures-biosynthesis 2 | 0.025972 | 0.806243 |
| 19. Antigen processing and presentation | 0.028228 | 0.984565 |
| 20. C21-Steroid hormone metabolism | 0.042216 | 0.166058 |
| 21. Fc epsilon RI signaling pathway | 0.000481 | 0.899467 |
| 22. Allograft rejection | 0.046891 | 0.250208 |
| 23. Insulin signaling pathway | 0.047775 | 0.331333 |
| 24. GnRH signaling pathway | 0.048738 | 0.812648 |
| 25. PPAR signaling pathway | 0.052305 | 0.039963 |
| 26. ECM-receptor interaction | 0.457871 | 0.032505 |
| 27. T cell receptor signaling pathway | 0.539028 | 0.020903 |
| 28. Non-homologous end-joining | 0.552678 | 0.001607 |
| 29. Phosphatidylinositol signaling system | 0.714791 | 0.040426 |
| 30. Melanogenesis | 0.960398 | 0.007761 |
| 31. Basal cell carcinoma | 0.978857 | 0.00088 |
| 32. Metabolism of xenobiotics by cytochrome P450 | 0.999938 | 0.006437 |
| 33. Monoterpenoid biosynthesis | 1 | 0.004507 |
Figure 2. Genes with copy number aberrations in the VEGF pathway.
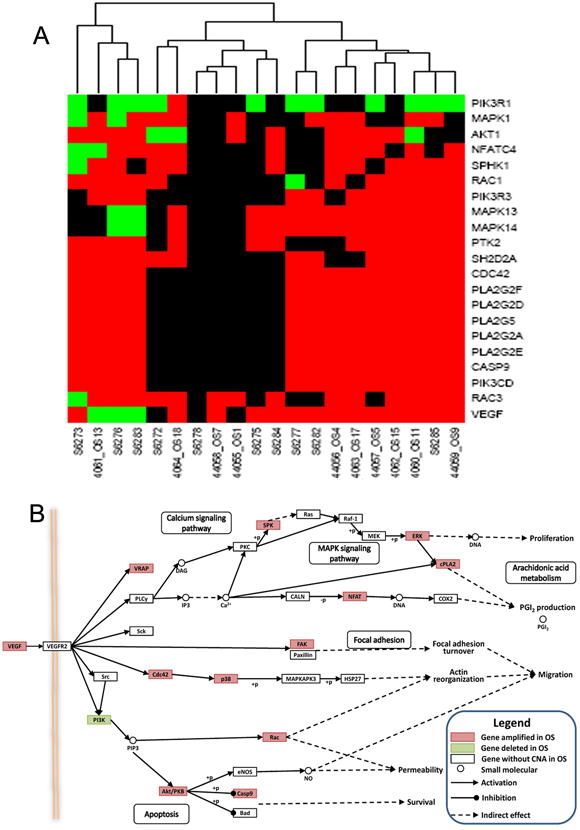
A. The copy number aberration status of genes involved in VEGF pathway in 20 OS samples. Red denotes amplification, and green denotes deletion. Black represents no copy number aberration. Significantly altered genes in the VEGF pathway are indicated on the right, and samples are indicated on the bottom. B. The visualization of the location of altered genes in the VEGF pathway. Pink indicates genes with significantly recurrent amplification, and green denotes genes with significantly recurrent deletion.
Validation of VEGFA amplification by FISH
Because VEGFA is the best characterized prototype gene in the VEGF pathway, we next focused our investigation on VEGFA. The aCGH data analysis (GSE19180 and GSE9654) showed that the VEGFA gene amplification was found in 12 of 20 cases in the two aCGH datasets (Figure 3A). To validate this finding, we carried out FISH analysis on 58 FFPE samples (including 10 samples used previously for aCGH analysis) using VEGFA and CEP 6 probe (Figure 3B).
Figure 3. Validation of VEGFA gene amplification by FISH.
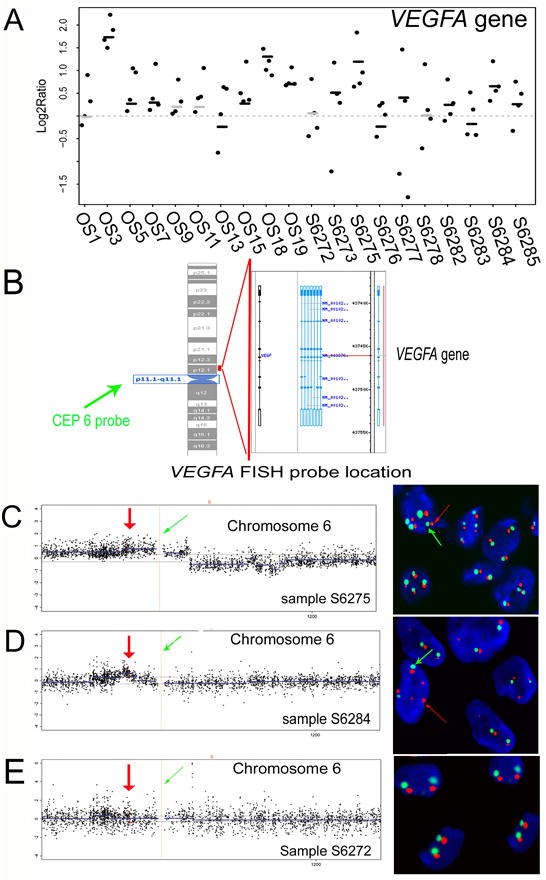
A: VEGF gene copy number aberrations in osteosarcomas. Sample IDs of the 20 OS samples in aCGH datasets GSE9654 and GSE19180 are indicated on the bottom. OS1-19 represent the case IDs in GSE9654 and S6272-6285 represent the case IDs in GSE19180. Scatters denote the copy number change of VEGFA gene. Lines in black and grey color denote the regional copy number value estimated by the circular binary segmentation (CBS) algorithm. Black lines denote significant amplification or deletion, whereas grey lines denote non-significant amplification or deletion. Twelve samples show amplification of the VEGF gene. B: Location of the CEP 6 probe and VEGFA gene FISH probe. The green arrow shows the FISH CEP 6 probe located to the chromosome 6 centromere. The right red line shows the location of the VEGFA gene FISH probe. C, D, and E: Validation of the different patterns of VEGFA gene status in aCGH and FISH assay. The aCGH probes of chromosome 6 are ordered on the basis of their genomic position (x-axis). Scatters denote the copy number change (y-axis) of probes. Dashed lines indicate the thresholds for significant aberrations. Blue lines denote regional copy number value estimated by CBS. Blue lines above or below the break line indicate amplification or deletion in the corresponding region. The dashed red line and the green arrows (left) denote the location of centromere 6. The red dots and arrows (left) denote four probes corresponding to the VEGFA gene and its location on chromosome 6 in aCGH analysis. CEP 6 FISH probe showing a green signal indicates the chromosome 6 centromere in FISH detection and is indicated with green arrows in the right panels. The VEGFA gene FISH probe shows an orange signal representing the VEGFA gene copy number, which is indicated with red arrows in the right panels. C, Pattern 1: VEGFA gene amplifications with ploysomy 6. Sample S6275 harbors ploysomy 6 with amplifications of the VEGFA gene. D, Pattern 2: focal amplification of the VEGFA gene. The genetic amplifications of the VEGFA gene are detected in local fragments in sample S6284. FISH detection shows that sample S6284 harbors disomy 6 with amplifications of the VEGFA gene. E: No VEGFA gene amplification. Two green signals with two orange signals suggest there is no VEGFA gene amplification in S6272.
We detected VEGFA gene amplifications in 32 of the 50 evaluable samples (results were not available in 8 samples due to loss of tissues during the pretreatment process) (Table 3, Figure 3, C and D). In our 6 samples that were shown to have VEGFA amplification based on aCGH data analysis, VEGFA gene amplifications were detected in 5 of them by FISH assay. The detectable ratios of VEGFA amplification in these two methods were significantly consistent (x2 = 6.667, P = 0.048, R = 0.816). Only one sample was inconsistent, perhaps due to the different regions of samples that were used for aCGH and FISH assays and to the fact that various parts of the same tumor can be heterogeneous.
Table 3. the VEGFA gene amplification, VEGFA protein expression, and MVD in osteosarcoma.
| N | Disease free survival | Overall survival | |||||||||
|---|---|---|---|---|---|---|---|---|---|---|---|
| P | HR | 95.0 % CI | P | HR | 95.0% CI | ||||||
| L | U | L | U | ||||||||
| VEGFA | No amplification | 18 | 0.04* | 0.24 | |||||||
| Amplification | Focal | 15 | 32 | 0.04 | 0.25 | 0.06 | 1.03 | 0.25 | 0.43 | 1 | 1.83 |
| Large fragment | 17 | ||||||||||
| VEGFA protein Expression | negative | 15 | 0.04* | 0.76 | |||||||
| weak | 23 | 0.17 | 0.2 | 0.02 | 2.02 | 0.35 | 2.37 | 0.39 | 14.3 | ||
| moderate | 7 | 0.23 | 0.38 | 0.078 | 1.82 | 0.85 | 1.18 | 0.21 | 6.56 | ||
| strong | 13 | 0.08 | 4.67 | 0.811 | 26.91 | 0.87 | 1.22 | 0.11 | 13.54 | ||
| VEGFA status | Low | 20 | 0.037* | 0.23 | |||||||
| High | 30 | 0.05 | 0.25 | 0.06 | 1 | 0.24 | 0.42 | 1 | 1.79 | ||
|
| |||||||||||
| MVD | 58 | 0.92 | 1 | 0.97 | 1.04 | 0.32 | 0.98 | 0.93 | 1.02 | ||
|
| |||||||||||
| VEGFA amplification | |||||||||||
|
| |||||||||||
| No | Yes | ||||||||||
|
| |||||||||||
| VEGFA protein expression | Negative | 9 | 2 | ||||||||
| Weak positive | 5 | 16 | |||||||||
| Moderate positive | 1 | 5 | |||||||||
| Strong positive | 3 | 9* | |||||||||
| VEGFA protein expression | Negative | 9 | 2 | ||||||||
| Positive | 9 | 30* | |||||||||
|
| |||||||||||
| MVD (per 0.26mm2) | Mean | 22 | |||||||||
| Median | 19 | ||||||||||
| Minimum | 2 | 15.8±3.3 | 22.3±2.6* | ||||||||
| Maximum | 60 | ||||||||||
Significantly different;
L: lower; U: upper;
In the 32 samples harboring VEGFA amplifications, 15 samples had focal amplifications while the other 17 were amplified with a large fragment (Table 3). Detailed analysis of the aCGH and FISH results of the same 10 samples further validated the two different patterns of VEGFA amplification in osteosarcoma (Figure 3, C and D). In aCGH data analysis, three samples (S6273, S6275, and S6277) showed amplification of a large chromosomal fragment containing the VEGFA gene as well as the centromere of chromosome 6 (Figure 3C, left). FISH hybridization showed that in these three samples, multiple tumor cells exhibited polysomy of chromosome 6 and multiple VEGFA gene amplifications (Figure 3C, right). In contrast, we observed focal genetic amplification of the VEGFA gene in aCGH analysis in sample S6284 and S6282 (Figure 3D, left). FISH analysis in these samples detected primarily disomy with multiple VEGFA gene copy amplifications (Figure 3D, right). We also observed heterogeneity in VEGFA gene amplification in different cells of the same samples. The other 5 samples, such as S6272, did not show VEGFA gene amplification in either aCGH or FISH analysis (Figure 3E).
VEGFA gene amplification, elevated VEGFA protein expression, angiogenesis, and tumor-free survival in human osteosarcoma
We compared the VEGFA gene amplification, VEGFA expression, and angiogenesis by determining the CD34 positive MVD in the 58 FFPE osteosarcoma tissue samples. As shown in Figure 4A (upper panel), abundant expression of VEGFA was found in 74.1% (43/58) of the osteosarcoma cases (Table 3). The MVD of osteosarcoma ranged from 2 to 60 microvessels per 0.26 mm2, with a mean of 22.7 microvessels per 0.26 mm2 (median, 19 microvessels per 0.26 mm2) (Table 3, Figure 4A, lower panel). The samples with positive VEGFA protein staining (including the weak, moderate, and strong positive) showed significantly higher MVD than did negative cases (F = 4.927, = 0.04, Figure 4B). Kaplan-Meier survival analysis showed that patients with positive VEGFA expression had significantly worse tumor-free survival rates than did patients with negative expression (Figure 4C). These results are consistent with those of other published studies showing that the abundant expression of VEGFA protein and high MVD are associated with reduced tumor-free and overall survival rates in osteosarcoma 3, 20, 22.
Figure 4. Correlations of VEGFA gene amplification, VEGFA protein, microvascular density (MVD), and disease-free survival in human osteosarcoma.
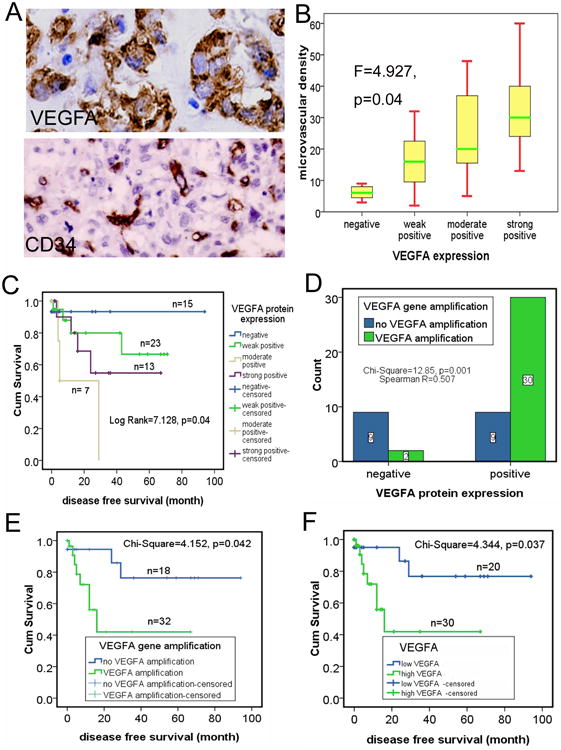
A: Strong positive expression of VEGFA protein was detected by immunohistochemical staining, and MVD was measured by scoring CD34-positive cells. Magnification, ×40. Upper panel: VEGFA protein; lower panel: CD34. B: Numbers of MVD in the VEGFA protein–positive cases were significantly higher than in the negative ones. C: Kaplan-Meier survival analysis showed that positive VEGF expression was significantly associated with adverse tumor-free survival. D: Concordance of VEGFA gene amplifications with VEGFA protein expression. E: Kaplan-Meier survival analysis showed that VEGFA gene amplifications were significantly associated with adverse tumor-free survival. F: Kaplan-Meier survival analysis showed that high VEGFA was significantly associated with adverse tumor-free survival.
To assess the correlation of VEGFA gene amplification with the VEGFA protein expression and angiogenesis, we grouped all the 58 samples into positive VEGFA protein expression group (including the weak, moderate, and strong positive expression) and negative VEGFA protein expression group according to the immunohistochemical staining results of VEGFA protein, and then examined their correlations with VEGFA gene amplification. The analysis showed that VEGFA gene amplification had significantly positive correlation with the abundant VEGFA protein expression (Figure 4D). Furthermore, the MVD in VEGFA amplification samples (22.3±2.6 microvessels per 0.26mm2) was much higher than those with no VEGFA amplification samples (15.8±3.3 microvessels per 0.26mm2) (Table 3). These results suggested that VEGFA gene amplification significantly contributed to the elevated expression of VEGFA and the vascular feature in osteosarcoma.
To explore whether VEGFA FISH results could be used to identify patients with poor outcomes who need novel treatment approaches, we performed a Kaplan-Meier survival analysis and found that patients with VEGFA amplification had significantly worse disease-free survival rates (Figure 4E).
Joint consideration of VEGFA gene amplification and positive VEGFA protein expression for patient stratification
Targeted therapy often requires measurement of target status to determine who will receive the therapy. Our studies showed that there are two independent assays, FISH and immunohistochemical analysis, for measuring VEGFA status in osteosarcoma. This is similar to the case of v-erb-b2 erythroblastic leukemia viral oncogene homolog 2 (HER2, ERBB2) in breast cancer, in which both gene amplification and protein overexpression are evaluated for targeted therapy 23. To explore whether joint consideration of VEGFA gene amplifications and positive VEGFA protein expression provide additional benefit for the osteosarcoma patients in the possible anti-VEGFA treatment selection in the future, we stratified the cases into high-VEGFA if both VEGFA gene amplification and positive VEGFA protein expression (including weak, moderate, and strong positive) were detected (Table 3). All of the others were classified as low-VEGFA. Kaplan-Meier survival analysis showed that patients with high-VEGFA had significantly worse tumor-free survival rates than did those with low-VEGFA (Figure 4F, All the information of the VEGFA gene amplification, VEGFA protein expression, and MVD were summarized and list case by case in Table 4). Furthermore, the difference in the survival time between these two groups was more significant than when either VEGFA amplifications or VEGFA protein expression alone was used, with a median tumor-free survival time of 16.0 ± 4.5 months versus 11.3 ± 2.3 and 5.0 ± 1.4 months, respectively. This result thus justifies consideration of a clinical trial in osteosarcoma patients in order to explore the activity of an anti-vascular agent. If validated in future studies, combined VEGFA amplification and VEGFA protein expression may be the most effective way of selecting osteosarcoma patients for anti-VEGF or other anti-vascular therapy.
Table 4. the VEGFA gene amplification, VEGFA protein expression, and MVD information in 58 osteosarcomas.
| Case | VEGFA protein expression (1=positive 0=negative) | aCGH ID | VEGFA gene amplification (1=positive, 0=negative) | VEGFA gene amplification type (1=focal, 2=large fragment) | MVD | VEGFA protein expression (1=weak, 2=moderate, 3=strong) | VEGFA status (1=high VEGFA, 0=low VEGFA |
|---|---|---|---|---|---|---|---|
| 1 | 1 | 26282 | 1 | 1 | 20 | 3 | 1 |
| 2 | 1 | 1 | 1 | 23 | 1 | 1 | |
| 3 | 1 | 26272 | 1 | 2 | 60 | 3 | 1 |
| 4 | 1 | 1 | 2 | 40 | 3 | 1 | |
| 5 | 1 | 1 | 2 | 13 | 3 | 1 | |
| 6 | 1 | 1 | 1 | 30 | 3 | 1 | |
| 7 | 1 | 42 | 3 | ||||
| 8 | 1 | 1 | 2 | 17 | 1 | 1 | |
| 9 | 1 | 1 | 1 | 9 | 1 | 1 | |
| 10 | 1 | 0 | 0 | 31 | 3 | 0 | |
| 11 | 1 | 1 | |||||
| 12 | 0 | 1 | 1 | 7 | 0 | 0 | |
| 13 | 1 | 1 | 2 | 59 | 3 | 1 | |
| 14 | 1 | 1 | 1 | 24 | 3 | 1 | |
| 15 | 1 | 26273 | 1 | 2 | 11 | 2 | 1 |
| 16 | 1 | 1 | 2 | 32 | 1 | 1 | |
| 17 | 1 | 1 | 1 | 15 | 1 | 1 | |
| 18 | 0 | 0 | 0 | 3 | 0 | 0 | |
| 19 | 1 | 26275 | 1 | 2 | 40 | 2 | 1 |
| 20 | 1 | 26283 | 1 | 2 | 20 | 2 | 1 |
| 21 | 1 | 1 | 2 | 20 | 2 | 1 | |
| 22 | 1 | 1 | 2 | 16 | 1 | 1 | |
| 23 | 1 | 1 | 2 | 27 | 1 | 1 | |
| 24 | 1 | 0 | 0 | 36 | 3 | 0 | |
| 25 | 0 | 26276 | 0 | 0 | 4 | 0 | 0 |
| 26 | 1 | 1 | 1 | 15 | 3 | 1 | |
| 27 | 1 | 1 | 1 | 5 | 2 | 1 | |
| 28 | 1 | 1 | 1 | 10 | 1 | 1 | |
| 29 | 1 | 1 | 1 | 17 | 1 | 1 | |
| 30 | 1 | 0 | 0 | 48 | 2 | 0 | |
| 31 | 1 | 0 | 0 | 12 | 1 | 0 | |
| 32 | 1 | 1 | 2 | 27 | 1 | 1 | |
| 33 | 1 | 26284 | 1 | 1 | 22 | 1 | 1 |
| 34 | 1 | 1 | 1 | 10 | 1 | 1 | |
| 35 | 1 | 1 | 1 | 1 | 1 | ||
| 36 | 1 | 0 | 0 | 29 | 3 | 0 | |
| 37 | 1 | 0 | 0 | 30 | 1 | 0 | |
| 38 | 1 | 0 | 0 | 26 | 1 | 0 | |
| 39 | 0 | 26277 | 1 | 1 | 46 | 0 | 0 |
| 40 | 0 | 0 | 0 | 6 | 0 | 0 | |
| 41 | 0 | 0 | 0 | 5 | 0 | 0 | |
| 42 | 0 | 0 | 0 | 7 | 0 | 0 | |
| 43 | 0 | 0 | 0 | 8 | 0 | 0 | |
| 44 | 0 | 0 | 0 | 3 | 0 | 0 | |
| 45 | 1 | 1 | |||||
| 46 | 0 | 0 | |||||
| 47 | 0 | 8 | 0 | ||||
| 48 | 0 | 49 | 0 | ||||
| 49 | 1 | 26285 | 34 | 2 | |||
| 50 | 1 | 1 | 1 | 8 | 1 | 1 | |
| 51 | 0 | 0 | 0 | 5 | 0 | 0 | |
| 52 | 0 | 0 | 0 | 9 | 0 | 0 | |
| 53 | 1 | 1 | 2 | 27 | 3 | 1 | |
| 54 | 1 | 0 | 0 | 4 | 1 | 0 | |
| 55 | 0 | 60 | 0 | ||||
| 56 | 1 | 1 | 2 | 20 | 1 | 1 | |
| 57 | 1 | 0 | 0 | 18 | 1 | 0 | |
| 58 | 1 | 1 | 1 | 2 | 1 | 1 |
Discussion
Osteosarcoma is the most common primary malignant bone tumor in children and young adults and is characterized by an aggressive clinical course. Pulmonary metastases, central presentation and local non-resectable relapse cause a fatal outcome in the majority of patients24. Several studies have focused on the role of angiogenesis in osteosarcoma, albeit with controversial results20, 22, 25. Angiogenesis is known to be a fundamental factor in the local growth of tumors and in progression with metastases, and is most commonly assessed by measuring either the expression of VEGFA in cancer cells or tumor CD31- or CD34-positive MVD. Cancer cells respond to an early hypoxic stage by activating signaling pathways that induce cell proliferation, the production of angiogenic factors such as VEGFA and new endothelial cell formation in order to provide a new vascular supply26, 27. In this study, by using integrated microarray-based comparative genomic hybridization (aCGH), fluorescent in situ hybridization (FISH), and immunohistochemistry analyses, we reported for the first time that VEGF pathway genes including VEGFA gene are amplified in osteosarcoma.
This is the first report of VEGFA gene amplification in osteosarcoma. However, VEGFA protein overexpression has been previously observed. This situation is similar to a number of other key signaling molecules important for cancer such as EGFR and ERBB2. For ERBB2, both gene amplification and immunohistochemical staining results have been used to identify breast cancer patients for Herceptin treatment 23, 28. However, due to the subjectivity associated with immunohistochemistry, gene amplification as detected by FISH has been shown as a more accurate readout for patient stratification for treatment 29, 30. An anti-VEGF antibody Bevacizumab (Avastin, Genentech, Inc), when used in combination with chemotherapy, has been shown to significantly improve survival and response rates in patients with metastatic colorectal cancer 31. Anti-VEGF treatment has not been commonly used to treat osteosarcoma. If such a treatment were studied in osteosarcoma, it would be critical to know the relationship between VEGFA gene amplification by FISH and VEGFA protein expression by immunohistochemistry and their association with prognosis and response to anti-vascular therapy. Our data suggest that the amplification of the VEGFA gene is a poor prognostic factor for tumor-free survival. Furthermore, combined classification of VEGFA gene amplification and elevated VEGFA protein expression, if validated in future studies, might provide a valuable stratification method for selection of anti-vascular therapy for patients with osteosarcoma.
Although VEGFA overexpression and the regulations of its expression have been reported in multiple cancer types including osteosarcoma, previous reports mainly focus on its regulations by the transcriptional factors such as HIF-1A 32. The present study showed that similar to what EGFR amplification is involved in a high proportion of cases with EGFR protein overexpression 33, VEGFA gene amplification is a key mechanism for VEGFA protein overexpression in osteosarcoma. Given that VEGFA expression is governed by numerous environmental factors (e.g., hypoxia, oxidative stress) and gene alterations (e.g., K-Ras, p53) 34, it would be worthwhile to determine in the future how these known factors contribute to VEGF expression in osteosarcoma and whether both genetic and environmental factors contribute to heightened angiogenesis in osteosarcoma.
The discovery of signal-transduction pathways and their importance in a variety of cancers has led to the development of many new targeted agents. With regard to osteosarcoma, signal transduction pathways activated by binding of growth factors to their receptors are of particular interest 35. The KEEG analysis of aCGH data identifies 33 genetically altered pathways in osteosarcomas in present study. Genetic amplifications of VEGF and mTOR pathway genes involve in VEGFA, AKT1, and other genes, suggesting genetic amplifications of these genes and pathways are associated the tumor development and progression. Data from preclinical studies have shown that rapamycin and its analogues inhibit cell growth in human cancer cell line derived from osteosarcoma and tumor models in vivo 36, 37. Furthermore, recently rapamycin has been shown to inhibit the expression of HIF-1α and VEGFA in vitro and to inhibit metastatic tumor growth and angiogenesis in in vivo mouse models by reducing translational production of VEGFA36, 38, 39. So our data about the genetic aberrations involved in mTOR pathway not only give more evidence of the utility of anti-mTOR therapy, but also supply more therapeutic targets of this pathway because of the significantly amplifications of VEGFA, AKT1, PI3K3CD, MAPK1, and PIK3R3 gene in osteosarcoma. Similarly, our investigations about genetic aberrations of Wnt, Hedgehog, CAMs, Tight junction, and Adherens junction pathways might supply other potential targets for osteosarcoma.
Acknowledgments
Financial support: This work was partially supported by a grant from the Liddy Shriver Sarcoma Initiative (J. Yang and W. Zhang) and the Development of Science and Technology Funds of the Tianjin Education Bureau (20070218, J. Yang). This research is supported in part by the National Institutes of Health through M. D. Anderson's Cancer Center Support Grant CA016672. The Tissue Bank of Tianjin Medical University Cancer Institute and Hospital is partially supported by the National Foundation for Cancer Research (US). J. Yang is a recipient of the Connie & Jim Walter Fellowship in Sarcoma Research.
We thank Limei Hu and David Cogdell for performing aCGH experiments and Haixin Li and Jin Zhang for assisting with clinical data analysis. We thank Ms. Tamara Locke from the Department of Scientific Publication at The University of Texas M. D. Anderson Cancer Center for editing this manuscript.
We also thank Dr. Xishan Hao for his support of this project.
References
- 1.Unni K Krishnan, I CY. Dahlin's bone tumours. Sixth. Vol. 123 Philadelphia: Lippincott Williams & Wilkins; 2010. [Google Scholar]
- 2.Yang J, Cogdell D, Yang D, Hu L, Li H, Zheng H, et al. Deletion of the WWOX gene and frequent loss of its protein expression in human osteosarcoma. Cancer Lett. 291(1):31–8. doi: 10.1016/j.canlet.2009.09.018. [DOI] [PubMed] [Google Scholar]
- 3.Quan GM, Choong PF. Anti-angiogenic therapy for osteosarcoma. Cancer Metastasis Rev. 2006;25(4):707–13. doi: 10.1007/s10555-006-9031-1. [DOI] [PubMed] [Google Scholar]
- 4.Dvorak HF. Vascular permeability factor/vascular endothelial growth factor: a critical cytokine in tumor angiogenesis and a potential target for diagnosis and therapy. J Clin Oncol. 2002;20(21):4368–80. doi: 10.1200/JCO.2002.10.088. [DOI] [PubMed] [Google Scholar]
- 5.Zangari M, Anaissie E, Stopeck A, Morimoto A, Tan N, Lancet J, et al. Phase II study of SU5416, a small molecule vascular endothelial growth factor tyrosine kinase receptor inhibitor, in patients with refractory multiple myeloma. Clin Cancer Res. 2004;10(1 Pt 1):88–95. doi: 10.1158/1078-0432.ccr-0221-3. [DOI] [PubMed] [Google Scholar]
- 6.Budde A, Schneiderhan-Marra N, Petersen G, Brune B. Retinoblastoma susceptibility gene product pRB activates hypoxia-inducible factor-1 (HIF-1) Oncogene. 2005;24(10):1802–8. doi: 10.1038/sj.onc.1208369. [DOI] [PubMed] [Google Scholar]
- 7.Man TK, Lu XY, Jaeweon K, Perlaky L, Harris CP, Shah S, et al. Genome-wide array comparative genomic hybridization analysis reveals distinct amplifications in osteosarcoma. BMC Cancer. 2004;4:45. doi: 10.1186/1471-2407-4-45. [DOI] [PMC free article] [PubMed] [Google Scholar]
- 8.Fechter A, Buettel I, Kuehnel E, Schwab M, Savelyeva L. Cloning of genetically tagged chromosome break sequences reveals new fragile sites at 6p21 and 13q22. Int J Cancer. 2007;120(11):2359–67. doi: 10.1002/ijc.22564. [DOI] [PubMed] [Google Scholar]
- 9.Pasic I, Shlien A, Durbin AD, Stavropoulos DJ, Baskin B, Ray PN, et al. Recurrent focal copy-number changes and loss of heterozygosity implicate two noncoding RNAs and one tumor suppressor gene at chromosome 3q13.31 in osteosarcoma. Cancer Res. 70(1):160–71. doi: 10.1158/0008-5472.CAN-09-1902. [DOI] [PubMed] [Google Scholar]
- 10.Squire JA, Pei J, Marrano P, Beheshti B, Bayani J, Lim G, et al. High-resolution mapping of amplifications and deletions in pediatric osteosarcoma by use of CGH analysis of cDNA microarrays. Genes Chromosomes Cancer. 2003;38(3):215–25. doi: 10.1002/gcc.10273. [DOI] [PubMed] [Google Scholar]
- 11.Meyers PA, Heller G, Healey J, Huvos A, Lane J, Marcove R, et al. Chemotherapy for nonmetastatic osteogenic sarcoma: the Memorial Sloan-Kettering experience. J Clin Oncol. 1992;10(1):5–15. doi: 10.1200/JCO.1992.10.1.5. [DOI] [PubMed] [Google Scholar]
- 12.Boussen H, Mezzi F, Gamoudi A, Daldoul O, Ben Hamida H, Mezlini A, et al. Primary chemotherapy with the Rosen T10 protocol before conservative surgery in limb primitive osteosarcomas: results about 56 cases. Bull Cancer. 2000;87(2):183–8. [PubMed] [Google Scholar]
- 13.Olshen AB, Venkatraman ES, Lucito R, Wigler M. Circular binary segmentation for the analysis of array-based DNA copy number data. Biostatistics. 2004;5(4):557–72. doi: 10.1093/biostatistics/kxh008. [DOI] [PubMed] [Google Scholar]
- 14.Van Wieringen WN, Van De Wiel MA, Ylstra B. Weighted clustering of called array CGH data. Biostatistics. 2008;9(3):484–500. doi: 10.1093/biostatistics/kxm048. [DOI] [PubMed] [Google Scholar]
- 15.Kresse SH, Ohnstad HO, Paulsen EB, Bjerkehagen B, Szuhai K, Serra M, et al. LSAMP, a novel candidate tumor suppressor gene in human osteosarcomas, identified by array comparative genomic hybridization. Genes Chromosomes Cancer. 2009;48(8):679–93. doi: 10.1002/gcc.20675. [DOI] [PubMed] [Google Scholar]
- 16.Summersgill B, Clark J, Shipley J. Fluorescence and chromogenic in situ hybridization to detect genetic aberrations in formalin-fixed paraffin embedded material, including tissue microarrays. Nat Protoc. 2008;3(2):220–34. doi: 10.1038/nprot.2007.534. [DOI] [PubMed] [Google Scholar]
- 17.Wang WL, Mayordomo E, Zhang W, Hernandez VS, Tuvin D, Garcia L, et al. Detection and characterization of EWSR1/ATF1 and EWSR1/CREB1 chimeric transcripts in clear cell sarcoma (melanoma of soft parts) Mod Pathol. 2009;22(9):1201–9. doi: 10.1038/modpathol.2009.85. [DOI] [PubMed] [Google Scholar]
- 18.Freeman SS, Allen SW, Ganti R, Wu J, Ma J, Su X, et al. Copy number gains in EGFR and copy number losses in PTEN are common events in osteosarcoma tumors. Cancer. 2008;113(6):1453–61. doi: 10.1002/cncr.23782. [DOI] [PMC free article] [PubMed] [Google Scholar]
- 19.Kersting C, Tidow N, Schmidt H, Liedtke C, Neumann J, Boecker W, et al. Gene dosage PCR and fluorescence in situ hybridization reveal low frequency of egfr amplifications despite protein overexpression in invasive breast carcinoma. Lab Invest. 2004;84(5):582–7. doi: 10.1038/labinvest.3700077. [DOI] [PubMed] [Google Scholar]
- 20.Ek ET, Ojaimi J, Kitagawa Y, Choong PF. Does the degree of intratumoural microvessel density and VEGF expression have prognostic significance in osteosarcoma? Oncol Rep. 2006;16(1):17–23. [PubMed] [Google Scholar]
- 21.Abdel-Rahman MH, Craig EL, Davidorf FH, Eng C. Expression of vascular endothelial growth factor in uveal melanoma is independent of 6p21-region copy number. Clin Cancer Res. 2005;11(1):73–8. [PubMed] [Google Scholar]
- 22.DuBois S, Demetri G. Markers of angiogenesis and clinical features in patients with sarcoma. Cancer. 2007;109(5):813–9. doi: 10.1002/cncr.22455. [DOI] [PubMed] [Google Scholar]
- 23.Sauter G, Lee J, Bartlett JM, Slamon DJ, Press MF. Guidelines for human epidermal growth factor receptor 2 testing: biologic and methodologic considerations. J Clin Oncol. 2009;27(8):1323–33. doi: 10.1200/JCO.2007.14.8197. [DOI] [PubMed] [Google Scholar]
- 24.Ferrari S, Smeland S, Mercuri M, Bertoni F, Longhi A, Ruggieri P, et al. Neoadjuvant chemotherapy with high-dose Ifosfamide, high-dose methotrexate, cisplatin, and doxorubicin for patients with localized osteosarcoma of the extremity: a joint study by the Italian and Scandinavian Sarcoma Groups. J Clin Oncol. 2005;23(34):8845–52. doi: 10.1200/JCO.2004.00.5785. [DOI] [PubMed] [Google Scholar]
- 25.Kreuter M, Bieker R, Bielack SS, Auras T, Buerger H, Gosheger G, et al. Prognostic relevance of increased angiogenesis in osteosarcoma. Clin Cancer Res. 2004;10(24):8531–7. doi: 10.1158/1078-0432.CCR-04-0969. [DOI] [PubMed] [Google Scholar]
- 26.Mizobuchi H, Garcia-Castellano JM, Philip S, Healey JH, Gorlick R. Hypoxia markers in human osteosarcoma: an exploratory study. Clin Orthop Relat Res. 2008;466(9):2052–9. doi: 10.1007/s11999-008-0328-y. [DOI] [PMC free article] [PubMed] [Google Scholar]
- 27.Rennel E, Waine E, Guan H, Schuler Y, Leenders W, Woolard J, et al. The endogenous anti-angiogenic VEGF isoform, VEGF165b inhibits human tumour growth in mice. Br J Cancer. 2008;98(7):1250–7. doi: 10.1038/sj.bjc.6604309. [DOI] [PMC free article] [PubMed] [Google Scholar]
- 28.Wolff AC, Hammond ME, Schwartz JN, Hagerty KL, Allred DC, Cote RJ, et al. American Society of Clinical Oncology/College of American Pathologists guideline recommendations for human epidermal growth factor receptor 2 testing in breast cancer. J Clin Oncol. 2007;25(1):118–45. doi: 10.1200/JCO.2006.09.2775. [DOI] [PubMed] [Google Scholar]
- 29.Arena V, Pennacchia I, Carbone A, Capelli A. Fluorescent in situ hybridization for human epidermal growth factor receptor 2 assessment in breast cancer: is it applicable as a primary test? J Clin Oncol. 2009;27(19):e8. doi: 10.1200/JCO.2009.23.2249. author reply e9-10. [DOI] [PubMed] [Google Scholar]
- 30.Arena V, Pennacchia I, Monego G, Carbone A, Capelli A. Fluorescent in situ hybridization as a primary test for HER2 status in breast cancer: controversies. J Clin Oncol. 28(5):e83–4. doi: 10.1200/JCO.2009.25.1397. author reply e85-8. [DOI] [PubMed] [Google Scholar]
- 31.Hicklin DJ, Ellis LM. Role of the vascular endothelial growth factor pathway in tumor growth and angiogenesis. J Clin Oncol. 2005;23(5):1011–27. doi: 10.1200/JCO.2005.06.081. [DOI] [PubMed] [Google Scholar]
- 32.Du R, Lu KV, Petritsch C, Liu P, Ganss R, Passegue E, et al. HIF1alpha induces the recruitment of bone marrow-derived vascular modulatory cells to regulate tumor angiogenesis and invasion. Cancer Cell. 2008;13(3):206–20. doi: 10.1016/j.ccr.2008.01.034. [DOI] [PMC free article] [PubMed] [Google Scholar]
- 33.Suzuki S, Dobashi Y, Sakurai H, Nishikawa K, Hanawa M, Ooi A. Protein overexpression and gene amplification of epidermal growth factor receptor in nonsmall cell lung carcinomas. An immunohistochemical and fluorescence in situ hybridization study. Cancer. 2005;103(6):1265–73. doi: 10.1002/cncr.20909. [DOI] [PubMed] [Google Scholar]
- 34.Konishi T, Huang CL, Adachi M, Taki T, Inufusa H, Kodama K, et al. The K-ras gene regulates vascular endothelial growth factor gene expression in non-small cell lung cancers. Int J Oncol. 2000;16(3):501–11. doi: 10.3892/ijo.16.3.501. [DOI] [PubMed] [Google Scholar]
- 35.O'Day K, Gorlick R. Novel therapeutic agents for osteosarcoma. Expert Rev Anticancer Ther. 2009;9(4):511–23. doi: 10.1586/era.09.7. [DOI] [PubMed] [Google Scholar]
- 36.Humar R, Kiefer FN, Berns H, Resink TJ, Battegay EJ. Hypoxia enhances vascular cell proliferation and angiogenesis in vitro via rapamycin (mTOR)-dependent signaling. FASEB J. 2002;16(8):771–80. doi: 10.1096/fj.01-0658com. [DOI] [PubMed] [Google Scholar]
- 37.Wan X, Mendoza A, Khanna C, Helman LJ. Rapamycin inhibits ezrin-mediated metastatic behavior in a murine model of osteosarcoma. Cancer Res. 2005;65(6):2406–11. doi: 10.1158/0008-5472.CAN-04-3135. [DOI] [PubMed] [Google Scholar]
- 38.Guba M, von Breitenbuch P, Steinbauer M, Koehl G, Flegel S, Hornung M, et al. Rapamycin inhibits primary and metastatic tumor growth by antiangiogenesis: involvement of vascular endothelial growth factor. Nat Med. 2002;8(2):128–35. doi: 10.1038/nm0202-128. [DOI] [PubMed] [Google Scholar]
- 39.Houghton PJ, Morton CL, Kolb EA, Gorlick R, Lock R, Carol H, et al. Initial testing (stage 1) of the mTOR inhibitor rapamycin by the pediatric preclinical testing program. Pediatr Blood Cancer. 2008;50(4):799–805. doi: 10.1002/pbc.21296. [DOI] [PubMed] [Google Scholar]