

Abstract
Motivation: Comparing 3D structures of homologous RNA molecules yields information about sequence and structural variability. To compare large RNA 3D structures, accurate automatic comparison tools are needed. In this article, we introduce a new algorithm and web server to align large homologous RNA structures nucleotide by nucleotide using local superpositions that accommodate the flexibility of RNA molecules. Local alignments are merged to form a global alignment by employing a maximum clique algorithm on a specially defined graph that we call the ‘local alignment’ graph.
Results: The algorithm is implemented in a program suite and web server called ‘R3D Align’. The R3D Align alignment of homologous 3D structures of 5S, 16S and 23S rRNA was compared to a high-quality hand alignment. A full comparison of the 16S alignment with the other state-of-the-art methods is also provided. The R3D Align program suite includes new diagnostic tools for the structural evaluation of RNA alignments. The R3D Align alignments were compared to those produced by other programs and were found to be the most accurate, in comparison with a high quality hand-crafted alignment and in conjunction with a series of other diagnostics presented. The number of aligned base pairs as well as measures of geometric similarity are used to evaluate the accuracy of the alignments.
Availability: R3D Align is freely available through a web server http://rna.bgsu.edu/R3DAlign. The MATLAB source code of the program suite is also freely available for download at that location.
Supplementary information: Supplementary data are available at Bioinformatics online.
Contact: r-rahrig@onu.edu
1 INTRODUCTION
Alignments of homologous RNA sequences can provide great insight into the structures, functions and evolutionary histories of RNA molecules. As is the case for proteins, alignment procedures based solely on sequence similarity will also correctly align secondary structure features of RNA, when sequence similarity is high. But such methods are inadequate for RNA homologs that have diverged significantly in sequence, and alignment methods that take into account Watson–Crick base-pair co-variation are needed to obtain accurate alignments that reflect the conserved secondary structure. Homologous RNA molecules share a core conserved secondary structure and 3D structure. As more 3D structures of RNA homologs appear, robust methods for simultaneous alignment at multiple structural levels, sequence, secondary structure and 3D structure are needed that can reveal the common structural features. This knowledge, extracted from the extant 3D database, can in turn guide efforts aimed at efficiently aligning the exponentially growing number of homologs known only from sequence (Brown et al., 2009). For example, although only a handful of atomic-resolution 3D structures of ribosomal RNAs are known, hundreds of thousands of homologs have been sequenced.
We have 3D structures of three bacterial and one archaeal 23S rRNAs, the bacteria Thermus thermophilus (T.th.), Escherichia coli (E.coli) and Deinococcus radiodurans (D.r.) and the archaeon H.m. In previous work, we produced hand-crafted alignments of these structures, a non-trivial task for which no software existed at the time (Stombaugh et al., 2009). Because producing a hand-crafted alignment is a labor-intensive and time-consuming process, and in light of the rapid increase in 3D RNA structures in the PDB/NDB (Berman et al., 2002), we were motivated to develop automated tools to align RNA 3D structures in a robust manner. This article reports a successful effort to do so.
For the purposes of this article, an alignment of two RNA structures is a list of correspondences between individual nucleotides from the two RNAs. In every alignment, we require that the correspondences be well-ordered (if nucleotides i and j are aligned with nucleotides i′ and j′, respectively, then i < j if and only if i′ < j′) and uniquely assigned (no nucleotide should be aligned to more than one nucleotide from the other RNA).
A number of research groups have developed programs for aligning RNA 3D structures, and we briefly review previous work in this section.
DIAL (Ferre et al., 2007) aligns RNA 3D structures using a quadratic time dynamic programming algorithm that includes terms for similarity in nucleotide sequence, base pairing and nine torsional angles used to describe the RNA backbone. The nine torsional angles include six dihedral angles (α, β, γ, δ, ϵ, ζ) used to define RNA backbone conformations and the dihedral angle (χ) that describes rotation about the glycosidic bond (Hershkovitz et al., 2003). It also uses two additional virtual angles η and θ, introduced in (Olson, 1975) and reintroduced in (Duarte et al., 2003).
SARA (Capriotti and Marti-Renom, 2008) performs pairwise RNA 3D-to-3D alignment by implementing a unit-vector representation of RNA structures that calculates a set of vectors between consecutive atoms. Quadratic-time dynamic programming algorithms are then applied to the reduced unit-vector representation of the structure. The SARA algorithm was inspired by the MAMMOTH program for protein structure alignment (Ortiz et al., 2002).
SARSA (Chang et al., 2008) is a web tool that can be used to align two RNA structures using the PARTS application. PARTS reduces the 3D structure into a 1D sequence of letters selected from an RNA structural alphabet of 23 letters that represent distinct and common backbone conformations. Quadratic-time dynamic programming sequence alignment methods are then employed on these 1D encoded sequences.
Thus, the approach used by DIAL, SARA, and PARTS for constructing a 3D-to-3D alignment of RNA is to extract particular classes of information from the 3D structure, create a reduced, essentially linear, representation of the RNA structure, and then utilize a quadratic-time sequence alignment algorithm on the reduced representation. While these programs are certainly useful because they are able to produce alignments quickly, it has been noted that due to the complexity of RNA 3D structural alignment, one cannot rely on a quadratic time algorithm to be highly accurate (Ferre et al., 2007).
ARTS (Dror et al., 2005) represents each nucleotide by the position of the phosphorus atom in the backbone. ARTS seeks the single rigid transformation that maximizes a weighted scoring function based on both the number of corresponding nucleotides and base pairs. This method can be used to discover previously unknown common substructures. ARTS is not constrained to produce well-ordered alignments, enabling non-sequential common substructures to be discovered. ARTS is a heuristic algorithm of complexity O(n3).
In this article, we introduce a new methodology for alignment of RNA 3D structures and a web server, and program that implements this methodology. We call this program R3D Align, which stands for ‘RNA 3D Alignment’. A notable feature of R3D Align is that it is able to accommodate the flexibility that exists among RNA 3D structures. ARTS is not designed to align large, conformationally flexible RNA 3D structures because it uses a single rigid transformation to find corresponding nucleotides. Thus, ARTS typically leaves entire regions unaligned, even though the regions themselves may superpose very well locally. This will be illustrated in the Section 3.
R3D Align accommodates local conformational flexibility by using many superpositions of local neighborhoods rather than a single global superposition. The local neighborhoods are formed so as to take into account pairwise nucleotide interactions of all types, including non-Watson–Crick as well as Watson–Crick base pairs. In addition to local base pair interactions, the program considers long-range (tertiary) base pair and base-stacking contacts. Although we account for and use all local and long-range pairwise interactions, we work directly with the geometry of the 3D structures in order to maintain independence from any particular program for annotating base interactions since any such classification necessarily creates a dichotomy in which some interactions fall just beyond the classification cutoff.
R3D Align is intended for use where nucleotide to nucleotide alignments are meaningful, for instance, for aligning homologous molecules. In this respect, it differs from ARTS, which is primarily intended to find common substructures using a single rigid superposition of two structures. While R3D Align and ARTS can sometimes both be used in a meaningful way on the same structures, they are in fact complementary programs.
R3D Align has been designed to produce highly accurate alignments of homologous molecules. While the tradeoff of achieving more accurate alignments at the expense of greater computational costs is difficult to avoid, R3D Align employs several techniques to maintain computational feasibility (see Section 2). In fact, R3D Align can be used to accurately align very large RNA 3D structures, such as 23S rRNA, in a reasonable length of time (see Supplementary Material S4 and S5).
As noted in Ferre et al. (2007), a primary application of faster running quadratic-time algorithms may be to identify potential alignment regions which can then be processed by a more accurate, but computationally intensive, RNA structural alignment algorithm. R3D Align has the capability to fulfill this need (see Section 2).
The classical tool for 3D-to-3D alignment evaluation has been the average root-mean-square deviations (RMSD) after optimal superimposition of the atomic coordinates of the set of aligned nucleotides in each structure. While the RMSD does reveal information about the global structure of the aligned nucleotides, local neighborhoods may actually differ quite substantially, as the RMSD spreads errors over the whole structure. Using the global RMSD alone, it is difficult to analyze whether specific local regions are aligned sufficiently well or not. Also, the RMSD is not designed to give detailed information about the conservation of interactions among nucleotides between the two structures, whether they are local or long-range interactions.
These issues were recognized in Parisien et al. (2009), who introduced new tools based on specific RNA structural features rather than on global average measurements were introduced. These tools evaluate different modeling techniques and are useful for comparing a modeled structure with an experimentally resolved structure. Because R3D Align is used to align structures of different organisms, we introduce diagnostics to aid in structure comparison and alignment evaluation when the alignment is non-trivial (see Section 3).
In the following section, we present the algorithm upon which R3D Align is built and outline the implementation in the R3D Align web server and MATLAB program suite.
2 METHODS
2.1 Transformation into a maximum clique problem
Our objective is to produce the most complete global alignment of two homologous, structurally similar RNA 3D structures in which local neighborhoods locally superimpose well in 3D space. We meet this objective by finding the maximum clique of a specially defined graph.
We assemble a set NA of 4-nt neighborhoods from structure A in such a way that each nucleotide is a member of p neighborhoods, where p is an integer specified ahead of time by the user. The 4 nt in each neighborhood are listed in ascending order with respect to the 5′-end. The diameter of a neighborhood is the maximum distance between the geometric centers of the bases as previously described (Sarver et al., 2008). For each nucleotide i in A, we find the p neighborhoods of smallest diameter which include nucleotide i and add them to the set NA. Most neighborhoods will be added more than once, but we do not keep duplicates in the set NA. The 4-nt neighborhoods of small diameter will contain most pairwise interactions (e.g. base pairing, base stacking, base backbone) whether local or long range with respect to the sequence or secondary structure. For larger values of p, more of the local vicinity of each nucleotide will be represented in NA. The total number of neighborhoods of a molecule with n nucleotides is bounded by p × n, and so is of complexity O(n).
Given a second structure B that we wish to align with structure A, we construct in the same way its list of 4-nt neighborhoods, NB. We then compare the neighborhoods of NA and NB to determine which neighborhoods are structurally similar. We find that the geometric discrepancy (measured in Angstroms) that was developed in (Sarver et al., 2008) is suitable for determining the structural similarity between 4-nt neighborhoods. The geometric discrepancy is similar to RMSD, but accounts for base substitutions between the two structures in a consistent way. For each local neighborhood in NA, we calculate the geometric discrepancy with every local neighborhood in NB, and organize these discrepancy values into an m × n array, with m = |NA| and n = |NB| being the number of 4-nucleotide neighborhoods from each structure, respectively. Each entry of the array represents a possible pairing of one neighborhood from A and one neighborhood from B. Two neighborhoods are classified as being structurally similar if their geometric discrepancy is less than a pre-defined discrepancy cutoff parameter d.
We seek the alignment of structure A and structure B that aligns the largest number of structurally similar local neighborhoods. Finding the optimal alignment can be reduced to finding the maximum clique of a specially defined graph, which we call the ‘local alignment’ graph.
The construction and use of the local alignment graph is now explained in detail. Using the m × n array described above, we generate a vertex for the local alignment graph for each entry in the array that has geometric discrepancy less than the cutoff d. Because we have put the nucleotides in each neighborhood in 5′ to 3′ order, each vertex represents a uniquely assigned and well-ordered alignment of structurally similar neighborhoods from A and B. Each of these alignments has only 4 nt correspondences, but we can merge together many such local alignments to form a larger alignment of A and B. However, not all of these 4-nt alignments are compatible; some would lead to an alignment which either violates the well-ordered or uniquely assigned criterion; see Figure 1. We draw edges between two vertices in the local alignment graph if the 4-nt alignments which they represent are compatible with each other, in the sense that they could be merged together to form a larger valid (well-ordered and uniquely-assigned) alignment. Finding the optimal alignment then corresponds to finding the largest set of vertices such that every pair of vertices in the set are connected by an edge. That is, we want to find the maximum clique of the local alignment graph. This idea was first introduced with 2-amino acid alignments to solve the contact map overlap problem for proteins in (Strickland et al., 2005). Finding the maximum clique is computationally challenging, but standard routines may be employed, as we describe below.
Fig. 1.

Illustration of compatibility of alignments. Each vertex represents a four-nucleotide alignment, as in Alignment 1, Alignment 2 and Alignment 3 above. An alignment formed by merging Alignments 1 and 3 is neither a uniquely assigned nor a well-ordered alignment, while the merging of Alignments 2 and 3 violates the uniquely assigned criterion. Only alignments 1 and 2 can be merged to form a valid alignment, namely the aligning of nucleotides 1, 2, 3, 4, 5, 6, 7, 8 in the first structure with nucleotides1, 2, 3, 4, 7, 8, 9, 10 in the second structure, respectively.
2.2 R3D Align implementation
The ideas described in the previous section serve as the basis for the R3D Align program, which is accessible via web server at http://rna.bgsu.edu/R3DAlign. R3D Align is also available for download as a suite of MATLAB programs at that location. The R3D Align MATLAB code can be run in Octave, which is freely available. We have prepared a user manual that contains examples of how to use the program.
Specific details of the R3D Align implementation of the algorithm are provided next.
To find the maximum clique of the local alignment graph, R3D Align implements a branch and bound algorithm which is similar to the algorithm presented in (Babel and Tinhofer, 1990). Because the problem of finding the maximum clique problem is NP-complete (Garey and Johnson, 1979), algorithms that find the maximum clique, such as the branch and bound algorithm implemented by R3D Align, may have relatively long running times in certain cases. However, R3D Align implements a series of techniques to ensure an alignment will be produced in a reasonable length of time, which we now describe.
R3D Align uses heuristic graph coloring and clique-finding procedures to quickly eliminate vertices that cannot be part of the maximum clique before the branch and bound algorithm is run. This is a pre-processing step. A graph coloring is an assignment of colors to the vertices so that no two adjacent vertices have the same color. R3D Align uses the approach described in (Biggs, 1990) to color the local alignment graph in O(L2) time and a greedy clique-finding procedure (Babel and Tinhofer, 1990) to find a large clique in O(L2) time, where L is the number of vertices in the local alignment graph. Suppose this clique has V vertices. Then the maximum clique has at least V colors in the coloring of the local alignment graph, because it has at least V vertices and each vertex needs a different color. Now if vertex i and its adjacent vertices have been colored with fewer than V colors, then vertex i cannot be part of the maximum clique and may be eliminated from the local alignment graph. Checking each vertex in the local alignment graph takes O(L) time. Coloring and clique-finding are iterated several times. Removing vertices in this pre-processing step decreases runtime when subsequently finding the maximum clique of the graph using the branch and bound algorithm.
Every vertex in the local alignment graph represents a 4-nt local alignment, and every set of vertices that are all pairwise connected by an edge represents a set of local alignments that can be merged to form a larger, valid alignment. Thus, any clique-finding procedure may be used after pre-processing to find a large clique and thus a valid alignment. R3D Align provides the user the option of using the greedy clique-finding procedure or the branch and bound procedure to produce the clique from which the final alignment is derived. The branch and bound procedure is guaranteed to give the optimal solution but is more costly. The branch and bound procedure is most suitable to use when aligning smaller structures; we elaborate on this in the next section.
We have implemented other techniques to improve runtimes. R3D Align can be run using a seed alignment and a bandwidth β so that nucleotide i of structure A will only be superimposed on nucleotides j − β/2 to j + β/2 (β/2 is rounded to the nearest integer) of structure B, where j is the nucleotide to which i is aligned in the seed alignment. This limits the size of the local alignment graph, which decreases the time required to find the maximum clique. The user can choose to upload the seed alignment (in FASTA format) or allow R3D Align to internally compute the seed alignment using a dynamic programming sequence alignment algorithm. Thus, sequence alignments, which can be obtained quickly but are not as accurate at the individual nucleotide level, can effectively be used as seed alignments to reduce overall runtime. This feature allows the user to input an alignment produced by any other method including DIAL, ARTS, etc., to produce an improved alignment using R3D Align.
This feature also allows R3D Align to be run in an iterative fashion using the results of one iteration as the seed for the subsequent one. We have found this to be the most effective way to speed up the alignment of large RNA structures, such as the large ribosomal RNAs (16S or 23S). Parameter settings for the iterations are discussed in the next section.
2.3 Web server usage
The R3D Align web server provides an intuitive user interface that allows the user to run the program online in various modalities.
The user can specify the two molecules to align by entering their four-character PDB code, selecting the codes from a drop-down list of database files, or uploading files in PDB format. For each 3D structure, the user may enter the chain identifier and/or a specific list of nucleotides to align. If no chain or nucleotide list is entered, all nucleotides in the file will be used to construct the alignment. Moreover, the nucleotides specified need not be contiguous (e.g. the user may enter ‘2,3,7:10’ as the list of nucleotides, where 7:10 represents all nucleotides from 7 to 10).
The user can also choose the discrepancy cutoff parameter, d. Smaller values of d require greater structural similarity between neighborhoods and therefore produce alignments in which only nucleotides in the most similar regions are aligned. Runtimes decrease with decreasing values of d. We suggest the default value d = 0.5 as a value that balances accuracy and computation time (see Supplementary Material S4).
Additionally, the value of the bandwidth β must be specified. The value of β directly corresponds to the user's belief regarding the accuracy of the seed alignment. Smaller values of β should be used for more accurate seed alignments while larger values should be used when the seed alignment is less accurate or unknown. Larger values of β generally increase the runtime of the algorithm. The program ignores the seed alignment when β is greater than or equal to the number of nucleotides in the second molecule.
The number of neighborhoods per nucleotide (p) can also be entered by the user. In general, alignment accuracy increases as p increases although accuracy levels off around p = 10 (see Supplementary Material S4). Also, larger values of p result in longer running times.
We note that careful consideration should be taken when aligning large structures. It was noted above that in this case it is best to use an iterative approach, which decreases runtime while maintaining accuracy. Setting a low value of p in the first iteration limits the number of neighborhoods and produces an alignment quickly. This alignment, which is more accurate than the seed alignment used in the first iteration, is used as the seed alignment for the second iteration. Because this seed alignment is more accurate, a smaller bandwidth can be used for the second iteration, which decreases runtime and allows a higher value of p to be set to produce an even more accurate alignment. This iterative approach produces results similar to simply running one iteration with large values of p and β, but it does so in significantly less time. The R3D Align web server allows the user to perform an alignment with up to three iterations automatically.
To determine reasonable values for the parameters for large RNA structures, we used the pairs of 16S and 23S molecules for which hand-crafted alignments were produced and presented in (Stombaugh et al., 2009). Our tests showed that using a two iteration approach with β = 60 and p = 3 for the first iteration and β = 20 and p = 9 for the second iteration produced accurate results (Supplementary Material S5). Although multiple iterations are not necessary for smaller molecules such as 5S rRNA, we also used R3D Align to produce alignments of the 5S molecules for the sake of more comprehensive testing. These results are also provided in Supplementary Material S5.
As we noted above, the user can choose to use the branch and bound or greedy clique finding procedure to produce the final alignment. For large RNA structures, the greedy approach should be used. The R3D Align alignments of the 5S, 16S and 23S rRNA molecules mentioned above were all produced using the greedy method and were found to be accurate when compared to hand-crafted alignments and were very similar to the branch and bound results. This is not unexpected because the pre-processing typically produces a dense graph, and thus the greedy approach often produces a clique similar in size to the maximum clique found by the branch and bound method. For example, in the alignment of 16S rRNA, the greedy clique procedure finds a clique consisting of 3748 vertices, while the maximum clique is only 0.37% larger (3762 vertices).
3 RESULTS
We tested R3D Align by aligning the 3D structures of 5S, 16S, 23S rRNAs of E.coli (E.coli) and Thermus thermophilus (T.th.). We also aligned the 3D structures of 5S and 23S rRNAs of E.coli and Haloarcula marismortui (H.m.). PDB files 2aw4, 2j01 and 1s72 (Klein et al., 2004; Schuwirth et al., 2005; Selmer et al., 2006) were used for E.coli, T.th. and H.m., respectively. We chose these test cases because high-quality hand-crafted alignments are available to effectively assess the accuracy of the alignments (Stombaugh et al., 2009). Also, these structures provide appropriate test cases because they are large and highly structured, with many non-Watson–Crick base pairs and long-range interactions. Moreover, E.coli, T.th and H.m. are phylogenetically distant so there are significant differences in sequence and structure. We also tested R3D Align on other RNAs including RNAseP and tRNA (see Section 3.5).
In this section, we focus on the alignment of the 16S rRNA molecules of E.coli and T.th., PDB files 2avy and 1j5e, respectively (Schuwirth et al., 2005; Wimberly et al., 2000). Because the DIAL and SARA web servers are incapable of producing alignments of structures this large, we asked the authors of the respective programs to provide alignments from local installations of these programs. The R3D Align web server is capable of aligning 16S and even 23S rRNA molecules. Evaluations of the 5S and 23S alignments can be found in Supplementary Materials S4 and S5.
To align the molecules, we used the iterative approach discussed in the previous section, which took 13 min to run. We benchmarked using a local installation of R3D Align on a Compaq Presario CQ60 Notebook with one Intel Pentium T4200 processor running at 2.0 GHz and with 4 GB of RAM. MATLAB version 7.7 (R2008b) was used for this benchmark.
3.1 Alignment output format
R3D Align produces FASTA output for use in other programs, and displays alignments in two other ways for visualization and diagnostic purposes. The first is an accessible, tabular (spreadsheet) representation that captures much of the detail of the individual 3D structures and their optimal alignment in a way that is easy for scientists to access. The second display is described in Section 3.4.
Figure 2 shows a portion of the spreadsheet produced by R3D Align to represent the 3D alignment of the E.coli and T.th. 16S rRNA structures. The entire spreadsheet is provided as an Excel file in Supplementary Materials S1. Each nucleotide from T.th. is listed in Column 1 by its base letter and number as in the PDB file. The nucleotide in E.coli to which it is aligned, if any, is listed in Column 4 of the same row. If there is no corresponding nucleotide in the E.coli structure, the entry in Column 4 is left blank. Likewise, if a nucleotide in E.coli in Column 4 is not aligned to a nucleotide in T.th., the cell in Column 1 of the corresponding row is left blank. Blank entries such as these indicate that the nucleotide does not have a structural correspondence. The nucleotide may have a correspondence at the level of evolutionary homology, however. For example, in Figure 2, it is likely that U1302 in T.th. corresponds to C1302 in E.coli, but they do not superimpose well in 3D.
Fig. 2.
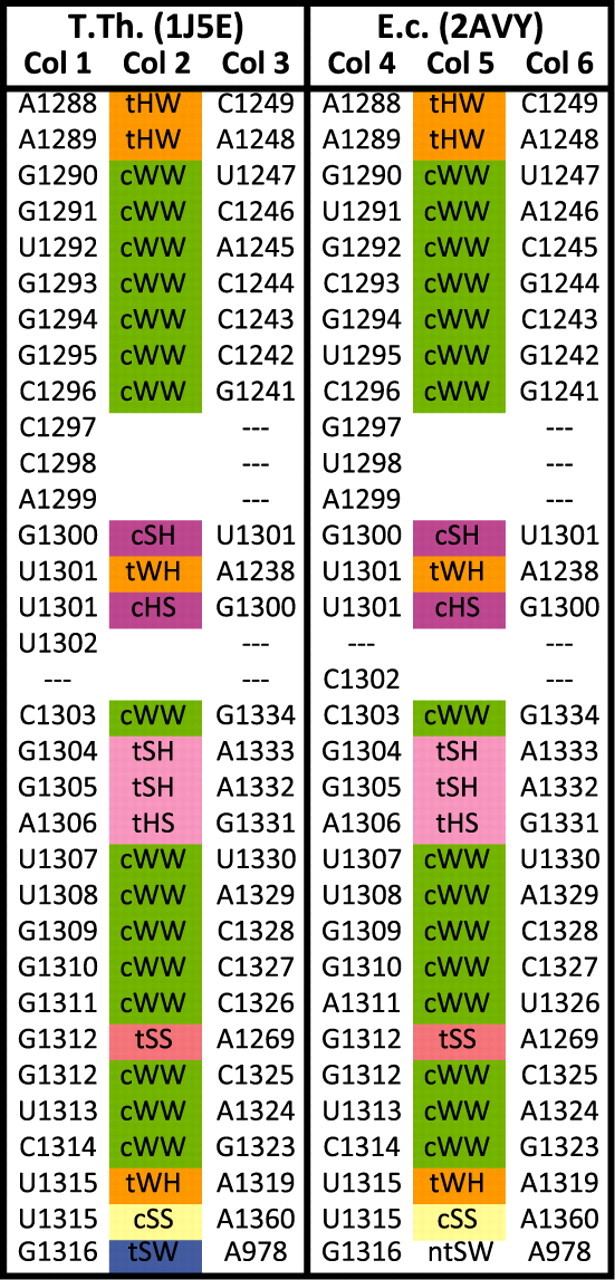
A portion of the R3D Align alignment of T.th. and E.c 16S rRNA. The spreadsheet simultaneously displays aligned nucleotides and base-pairing interactions. Nucleotides in Columns 1 and 4 of the same row are aligned, as are the nucleotides in Columns 3 and 6. The kind of base-pairing interaction between the nucleotides of Columns 1 and 3 (if any) is indicated in Column 2. Column 5 indicates the base-pairing interaction between the nucleotides in Columns 4 and 6. Base pairs are annotated by FR3D using the Leontis/Westhof system. All corresponding base pair types are identical except the last row shows a near tSW base pair in E.coli Note that nucleotides U1302 in T.th. and C1302 in E.coli are not aligned to one another. This portion of the alignment indicates strong conservation between the two structures as well as proper alignment.
To capture the 3D context, the alignment also shows the base pairs made by each nucleotide in each structure, as in the manually produced base pair alignment first presented in Stombaugh et al. (2009). The first three columns are used to list base pairs in the first structure (T.th. in the example) and the next three columns, the base pairs between corresponding nucleotides in the second structure (E.coli). For each nucleotide in Column 3, Column 6 of the spreadsheet shows the nucleotide in E.coli to which it is aligned, if there is one. If so, the type of base pair made by the nucleotides in Columns 4 and 6 is listed in Column 5. If the nucleotides in Columns 4 and 6 do not form a base-pairing interaction, ‘—’ is displayed. The type of base pair formed between the nucleotides in each structure, if any, is indicated in Columns 2 and 5 and is annotated according the Leontis/Westhof system. Cells are colored according to base pair type. A separate row is provided for each base pair a nucleotide makes. For example, U1301 is listed twice because it makes a tWH base pair with A1238 and a cHS base pair with G1300. The nucleotides in Columns 1 and 4 of the alignment are listed in increasing numerical order. The spreadsheet thus shows every base pair interaction detected in each structure in addition to all of the alignment information. We find that for good alignments, pairs of aligned nucleotides generally make the same base pair types as nucleotides that are also aligned.
3.2 Comparison of 16S alignments
For comparison to R3D Align, we used various methods to create alignments of the two 16S rRNA structures; these are noted in bold in this paragraph. First, sequence-based methods. We made an alignment of the 16S sequences using a Needleman–Wunsch (NW) algorithm (Needleman and Wunsch, 1970) setting to allow inexact matches and so as to give the most favorable alignments as determined by the diagnostics in Section 3.3 below. Also, we obtained an alignment using NAST (DeSantis et al., 2006), which is specifically designed for 16S rRNA sequences. Next, alignments based on 3D structure. The Crystallographer alignment is implicit in the numbering scheme used by the crystallographers. In earlier work (Stombaugh et al., 2009), we constructed a hand-crafted alignment of the base paired nucleotides. This Basepair alignment is a reliable standard against which we can compare other alignment methods. As this alignment only aligns basepairs and unpaired nucleotides do not appear in thealignment, we have made a Composite alignment by adding to the correspondences in the Basepair alignment all correspondences from the R3D Align alignment that are consistent with the Basepair alignment. Alignments by SARA and DIAL were provided by the authors of the respective programs. The ARTS alignment was obtained using the ARTS web server. The results obtained with SARSA/PARTS were erratic, so we do not present a comparison.
Figure 3 uses the spreadsheet display to compare several alignments side by side. It compares a portion of the R3D Align alignment (using the greedy clique procedure only) to six of the other alignments listed above, the Basepair alignment, the sequence alignments produced by NAST and NW, and the 3D-to-3D alignments produced by ARTS, SARA and DIAL. The full comparison plus the Composite and Crystal alignments appears in Supplementary Material S2. We list all of the base pair interactions of the T.th. structure in Columns 1–3 as above. Then the aligned nucleotides are placed in the subsequent columns, three columns per alignment. Aligned nucleotides are again located in the same row, but no extra rows are added to display all nucleotides from E.coli. Figure 3 shows that, in the indicated region, R3D Align agrees almost entirely with the manual Basepair alignment. NAST aligns this region very well. ARTS agrees with R3D Align except that it aligns very few of the nucleotides in the internal loop, helix and hairpin extending from C149 to U172 in T.th. The SARA alignment generally agrees with R3D Align, but fails to correctly align two nucleotides in the hairpin extending from G159 to A162. The DIAL alignment is off by one or two nucleotides in each position and consequently does not align any base pairs. The NW alignment, although it allows inexact matches, also struggles in places because the two structures have relatively low (69%) sequence similarity within this region. However, NW performs better where the sequence conservation is higher, such as the helix and internal loop of G144 to C153 and G168 to C178. There the sequence conservation is 86%. Note the long-range interactions between A151 and G102, between A152 and G68, and between A160 and G347. C142-A196 is a base pair across a junction. R3D Align does well with such long-range interactions.
Fig. 3.
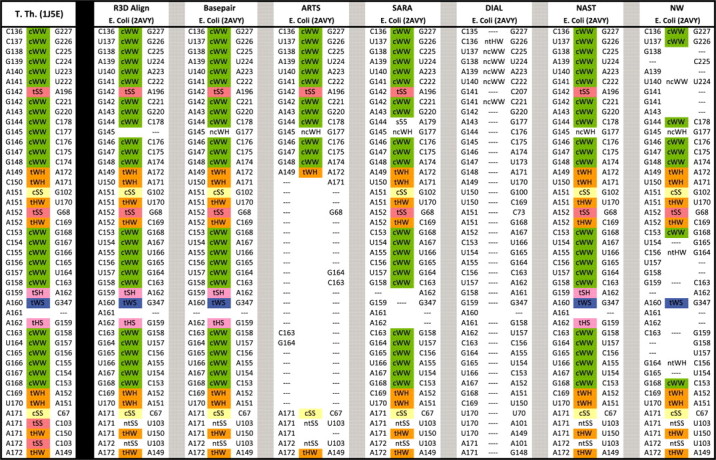
A section of the comparison the 16S rRNA alignment produced by different methods. To the left of the black line are nucleotides and base pairs of T.th. To the right of the black line are the corresponding nucleotides of E.coli as aligned by the different methods. R3D Align is the first method displayed to the right of the black line, followed by the manually derived base pair alignment, three other 3D-to-3D alignments, and then two sequence-based alignments.
3.3 Alignment diagnostics
The spreadsheet described above is over 1800 lines long and does not report on the quality of the geometric superposition of aligned neighborhoods. Therefore, we also computed several global diagnostics for each alignment. We recognize that it may not be possible to define what a perfect 3D-to-3D alignment is (Brown et al., 2009), but nevertheless it is important to develop effective tools for assessing alignment quality. Because we focus on the alignment of homologous molecules, we utilize effective diagnostics for this situation. In addition to the geometric similarity of the aligned regions, the number of aligned base pairs is a significant and relevant measure of the accuracy of the alignment in this situation. Also, we have concentrated on aligning molecules for which high-quality hand-crafted alignments are available for comparison. The diagnostics are summarized in Table 1.
Table 1.
Summary statistics for the alignment of T.th. (1j5e) and E.coli (2avy) as produced by the different methods described in Section 3.2
| Alignment method |
|||||||||
|---|---|---|---|---|---|---|---|---|---|
| Manual |
Automated 3D-to-3D |
Sequence-based |
|||||||
| Composite | Basepair | Crystallographer | R3D Align | ARTS | SARA | DIAL | NAST | NW | |
| Number of nucleotides aligned | 1414 | 1208 | 1488 | 1400 | 1115 | 1460 | 1506 | 1482 | 1431 |
| Number of exact base matches | 1098 | 924 | 1133 | 1089 | 867 | 1075 | 1017 | 1129 | 1215 |
| Nested cWW aligned | 431 | 431 | 426 | 428 | 301 | 375 | 297 | 422 | 319 |
| Nested non-cWW aligned | 88 | 88 | 87 | 88 | 60 | 80 | 64 | 88 | 76 |
| Non-nested cWW aligned | 11 | 11 | 11 | 11 | 11 | 11 | 10 | 11 | 11 |
| Non-nested non-cWW aligned | 75 | 75 | 73 | 76 | 57 | 70 | 56 | 76 | 64 |
| Stacking interactions aligned | 1375 | 1169 | 1391 | 1372 | 1040 | 1310 | 1248 | 1375 | 1223 |
| Base–phosphate interactions aligned | 77 | 32 | 79 | 76 | 66 | 76 | 58 | 78 | 72 |
| Correspondences agreeing with Composite | 1414 | 1208 | 1401 | 1362 | 1056 | 1278 | 1113 | 1356 | 1172 |
| Correspondences missing, compared to Composite | 0 | 206 | 13 | 52 | 358 | 136 | 301 | 58 | 242 |
| Correspondences extra, compared to Composite | 0 | 0 | 87 | 38 | 59 | 182 | 392 | 126 | 259 |
| Mean local neighborhood discrepancy | 0.261 | 0.251 | 0.366 | 0.247 | 0.286 | 0.426 | 1.160 | 0.391 | 0.831 |
| Median local neighborhood discrepancy | 0.197 | 0.198 | 0.210 | 0.193 | 0.189 | 0.223 | 0.286 | 0.208 | 0.223 |
| Global discrepancy of all aligned nucleotides | 0.081 | 0.087 | 0.099 | 0.092 | 0.058 | 0.096 | 0.208 | 0.118 | 0.196 |
The first two rows of Table 1 simply count the number of aligned nucleotides. R3D Align aligns nearly as many nucleotides as the Composite alignment. Sequence alignment methods like NW and NAST and the Crystallographer alignment suffer from the problem that they basically need to align things even if they do not correspond very well in 3D. They have little reason not to align nucleotides that are sandwiched between aligned nucleotides. Thus, they tend to align more nucleotides than the other methods. Row 2 of Table 1 shows that NW tends to create an alignment with a greater number of identical base correspondences than the other methods. ARTS aligns significantly fewer nucleotides than the other methods.
Because of the high degree of structure conservation between these two structures, a good performance characteristic is the number of base pairs aligned by each method. In Table 1, these are broken down according to whether they are nested cis Watson–Crick/Watson–Crick base pairs (as in helices), non-nested Watson–Crick base pairs (as in pseudoknots), nested non-Watson–Crick (as in internal loops), or non-nested non-Watson–Crick base pairs (as in A-minor and other tertiary interactions). In these four categories, R3D Align performs nearly as well as it can, and outperforms the other alignment techniques. The backbone-based methods do better on stacking interactions, which are often between adjacent nucleotides, than on base pairs. Base–phosphate interactions were described in Zirbel et al. (2009). They are most often found in highly conserved regions, which explains why the NW alignment preserved so many of them
We also calculated measures of how well aligned nucleotides superimpose, both locally and globally. For local superpositions, for each nucleotide in T.th., we found the nearest four nucleotides in T.th. which were aligned to nucleotides in E.coli, and then found the geometric discrepancy between the five nucleotides from T.th. and the corresponding five nucleotides from E.coli The mean and median of these discrepancies is given in the table. This diagnostic is somewhat independent of the method used by R3D Align, as it uses 5-nt neighborhoods rather than 4, and as it may superimpose nucleotides that are never part of the same 4-nt neighborhood. In particular, it will give large error readings in places where nucleotides that are nearby in T.th. are aligned to nucleotides that are farther apart in E.coli, which happens at the boundaries of element expansion regions.
Table 1 shows that the R3D Align alignment outperforms the other automated 3D-to-3D alignment methods according to the most relevant metrics. R3D Align correctly aligns more nucleotides engaged in base pair, stacking and base–phosphate interactions than do SARA, ARTS and DIAL, and approaches the correct counts of the manually derived alignment. R3D Align also achieves the lowest mean local discrepancy value. The fact that ARTS achieves a lower median local discrepancy value than R3D Align is not necessarily surprising as the main problem with the global alignments produced by ARTS is not nucleotides that are misaligned, but nucleotides that should be aligned and are not. What ARTS does align, it aligns well. Among the three methods that use reduced representations of structures and then apply a quadratic time algorithm, SARA outperforms both DIAL and SARSA/PARTS (data not shown) in all categories.
3.4 Visual assessment of local superposition quality
Given an alignment of two RNA structures, it is useful to know which aligned nucleotides superimpose well and which do not. In Figure 4, ‘bar diagrams’ display several alignments using straight line segments to connect the corresponding nucleotides in the two structures. As above, for each aligned nucleotide in T.th., we found the nearest four nucleotides in T.th. which were aligned to nucleotides in E.coli, and then found the geometric discrepancy between the 5 nt from T.th. and the corresponding 5 nt from E.coli The lines are then colored according to the geometric discrepancy between the 5-nt neighborhoods. Figure 4 makes it clear that R3D Align performs nearly the same as the manually derived Composite alignment. It should be noted that one reason red lines appear in the Composite alignment is because of manual identification of errors in the crystal structures and subsequent manual alignment of those nucleotides, as described in Stombaugh et al. (2009). SARA does very well, but does have some localized poorly aligned regions, as indicated by the sections with many red lines. ARTS does well where it make correspondences, but it is clear from the figure that it leaves out some large regions entirely. DIAL does well in some regions, but poorly in others. The NW alignment is good in some places, poor in others. This is no surprise; any NW algorithm requires sequence conservation to perform well, and some regions are more highly conserved than others.
Fig. 4.

16s rRNA alignments produced by the different methods with the nucleotides of T.th. (1j5e) listed along the top of each bar and the nucleotides of E.coli (2avy) listed along the bottom. For each nucleotide in 1j5e with a correspondence, it and the nearest 4 nt in 1j5e with a correspondence are superimposed with the corresponding 5 nt of 2avy and the line is colored according to the geometric discrepancy, as indicated by the color bar.
The NAST alignment, which is optimized for 16S rRNA alignment, performs similarly to the Crystallographer alignment.
3.5 Alignments of other structures
To further evaluate R3D Align we also tested it on Ribonuclease P (RNase P), a ubiquitous RNA enzyme (ribozyme) that plays a critical role in all cells. We bench-marked the alignment produced by R3D Align with the manually produced structural alignment presented in Krasilnikov et al. (2004). There are two distinct types of bacterial RNase P, types A and B, which differ significantly in sequence and secondary structure of their S-domains, the part of the ribozyme that binds tRNA. Nonetheless, the 3D structures are quite similar, allowing for the conserved function of binding tRNA. Thus, correct alignment of the S-domains of A- and B-type RNase Ps is a significant challenge. We used R3D Align to align the A-type S domain contained in PDB file 1U9S and the B-type S domain contained in 1NBS:B (Krasilnikov et al., 2003). The R3D Align alignment was found to be in agreement with the findings described in Krasilnikov et al. (2004). That is, elements that were described as being present in both structures were aligned by R3D Align, while all elements that exist in only one of the structures were not assigned correspondences in the other structure. We used an iterative approach. Since these are smaller structures, we used the branch and bound method in both iterations. In the first iteration, we used d = 0.5, p = 3, β = 100. We used d = 0.5, p = 9, β = 40 for the second iteration. The entire alignment spreadsheet is included in Supplementary Material S3. For ease of comparison, the nucleotides have been labeled according to which elements of the structure they belong using the same numbering scheme as used in Krasilnikov et al. (2004).
To highlight the difference between the rigid superpositions used by ARTS and the local superpositions used by R3D Align, we used both programs to align an A-site bound tRNA(phe) (3I8G:B) with a tRNA(thr) bound in the pre-accommodated state (2WRN:Y). R3D Align aligns 56 of the 69 unmodified nucleotides in 2wrn (it cannot read modified nucleotides), whereas ARTS aligns just 14 nt. The entire spreadsheet containing the alignment is provided in Supplementary Material S6. Visual inspection of the two structures verifies that they differ rather dramatically in their overall 3D conformation, but that their local structure is similar in most places.
4 DISCUSSION
One application of an accurate 3D-to-3D alignment method such as R3D Align is to create a consensus interaction list. One application of an accurate 3D-to-3D alignment method such as R3D Align is to create a consensus interaction list. For a variety of reasons, two crystal structures of the same molecule (whether from the same organism or different organisms) will show small variations in the local structure of the RNA. When one structure shows a base pair but the other shows the corresponding two bases falling just outside the classification limits, it is reasonable to infer the presence of the base pair in the second structure. A R3D Align alignment can be used to locate near base pairs in one structure that are aligned with true base pairs in another. The near base pairs can then be inferred to be true base pairs. This could be used in conjunction with annotation program like FR3D, and the results would be useful for programs which search the annotations rather than the 3D structures. A consensus interaction list will be useful to crystallographers when they are trying to decide how to model a base pair. Finally, it will be useful for programs like JAR3D (manuscript in preparation), which use 3D structure to make multiple sequence alignments.
In this article, we have used measurements based on local superpositions rather than one global superposition in order to accommodate the conformational flexibility of large RNA. Specifically, evaluating alignments based on the mean or median geometric discrepancy of aligned local neighborhoods is a concise way of revealing the structural similarity of aligned local neighborhoods is a concise way of revealing the structural similarity of aligned nucleotides at a local level.
R3D Align is based on FR3D. Once FR3D is extended to read modified nucleotides, R3D Align will be able to superimpose RNA 3D structures containing such nucleotides. We will re-examine the seed alignment generated internally by R3D Align; improvements here will allow the user to set a narrower bandwidth and thus reduce the running time. We will implement an interface which will allow the user to specify a portion of the alignment to view as a local superposition between the two 3D structures. Finally, we would like to extend R3D Align from pairwise alignment to simultaneous alignment of three or more structures.
5 CONCLUSION
We have introduced a new method for aligning two RNA 3D structures and provided an implementation of this method in the ‘R3D Align’ program suite and web server. In contrast to the existing methods which either rely on a reduced, linear representation of the 3D structure or on single global rigid superpositions, we focus on superpositions of local neighborhoods, which take into account interactions of all types while maintaining independence from discrete classifications of pairwise nucleotide interactions. .
We have shown that R3D Align can be used to accurately align large RNA structures. The 16S rRNA alignment produced by R3D Align was compared with alignments produced by other methods. It was shown to be the most accurate and to closely approximate a hand-crafted alignment. We have also introduced new display methods and diagnostics to compare and evaluate alignments.
Among the new tools introduced is a spreadsheet which displays all of the alignment information in addition to all base pairs detected in the structure. This spreadsheet format is also useful for comparing different alignments side-by-side. New ‘bar diagrams’ were introduced which concisely display the alignment and the structural similarity of the local neighborhoods of each aligned nucleotide.
ACKNOWLEDGEMENTS
We thank Peter Clote and Yann Ponty for providing us with the DIAL 16S alignment; Emidio Capriotti and Marc A. Marti-Renom for the SARA 16S alignment; and Chin Lung Lu for the SARSA 16S alignment.
Funding: National Institutes of Health (2 R15 GM055898-05).
Conflict of Interest: none declared.
REFERENCES
- Babel L, Tinhofer G. A branch and bound algorithm for the maximum clique problem. Math. Methods Oper. Res. 1990;34:207–217. [Google Scholar]
- Berman HM, et al. The Protein Data Bank. Acta Crystallogr. D. Biol. Crystallogr. 2002;58:899–907. doi: 10.1107/s0907444902003451. [DOI] [PubMed] [Google Scholar]
- Biggs N. Some heuristics for graph coloring. In: Nelson R, Wilson RJ, editors. Graph Colourings. New York: Longmans; 1990. pp. 87–96. [Google Scholar]
- Brown JW, et al. The RNA structure alignment ontology. RNA. 2009;15:1623–1631. doi: 10.1261/rna.1601409. [DOI] [PMC free article] [PubMed] [Google Scholar]
- Capriotti E, Marti-Renom MA. RNA structure alignment by a unit-vector approach. Bioinformatics. 2008;24:i112–i118. doi: 10.1093/bioinformatics/btn288. [DOI] [PubMed] [Google Scholar]
- Chang YF, et al. SARSA: a web tool for structural alignment of RNA using a structural alphabet. Nucleic Acids Res. 2008;36:W19–W24. doi: 10.1093/nar/gkn327. [DOI] [PMC free article] [PubMed] [Google Scholar]
- DeSantis T.ZJr, et al. NAST: a multiple sequence alignment server for comparative analysis of 16S rRNA genes. Nucleic Acids Res. 2006;34:W394–W399. doi: 10.1093/nar/gkl244. [DOI] [PMC free article] [PubMed] [Google Scholar]
- Dror O, et al. ARTS: alignment of RNA tertiary structures. Bioinformatics. 2005;21(Suppl. 2):ii47–ii53. doi: 10.1093/bioinformatics/bti1108. [DOI] [PubMed] [Google Scholar]
- Duarte CM, et al. RNA structure comparison, motif search and discovery using a reduced representation of RNA conformational space. Nucleic Acids Res. 2003;31:4755–4761. doi: 10.1093/nar/gkg682. [DOI] [PMC free article] [PubMed] [Google Scholar]
- Ferre F, et al. DIAL: a web server for the pairwise alignment of two RNA three-dimensional structures using nucleotide, dihedral angle and base-pairing similarities. Nucleic Acids Res. 2007;35:W659–668. doi: 10.1093/nar/gkm334. [DOI] [PMC free article] [PubMed] [Google Scholar]
- Garey MR, Johnson DS. Computers and Intractability : a Guide to the Theory of NP- Completeness. New York: Anonymous W.H. Freeman; 1979. [Google Scholar]
- Hershkovitz E, et al. Automated identification of RNA conformational motifs: theory and application to the HM LSU 23S rRNA. Nucleic Acids Res. 2003;31:6249–6257. doi: 10.1093/nar/gkg835. [DOI] [PMC free article] [PubMed] [Google Scholar]
- Klein DJ, et al. The roles of ribosomal proteins in the structure assembly, and evolution of the large ribosomal subunit. J. Mol. Biol. 2004;340:141–177. doi: 10.1016/j.jmb.2004.03.076. [DOI] [PubMed] [Google Scholar]
- Krasilnikov AS, et al. Basis for structural diversity in homologous RNAs. Science. 2004;306:104–107. doi: 10.1126/science.1101489. [DOI] [PubMed] [Google Scholar]
- Krasilnikov AS, et al. Crystal structure of the specificity domain of ribonuclease P. Nature. 2003;421:760–764. doi: 10.1038/nature01386. [DOI] [PubMed] [Google Scholar]
- Needleman SB, Wunsch CD. A general method applicable to the search for similarities in the amino acid sequence of two proteins. J. Mol. Biol. 1970;48:443–453. doi: 10.1016/0022-2836(70)90057-4. [DOI] [PubMed] [Google Scholar]
- Olson WK. Configurational statistics of polynucleotide chains. A single virtual bond treatment. Macromolecules. 1975;8:272–275. doi: 10.1021/ma60045a006. [DOI] [PubMed] [Google Scholar]
- Ortiz AR, et al. MAMMOTH (matching molecular models obtained from theory): an automated method for model comparison. Protein Sci. 2002;11:2606–2621. doi: 10.1110/ps.0215902. [DOI] [PMC free article] [PubMed] [Google Scholar]
- Parisien M, et al. New metrics for comparing and assessing discrepancies between RNA 3D structures and models. RNA. 2009;15:1875–1885. doi: 10.1261/rna.1700409. [DOI] [PMC free article] [PubMed] [Google Scholar]
- Sarver M, et al. FR3D: finding local and composite recurrent structural motifs in RNA 3D structures. J. Math. Biol. 2008;56:215–252. doi: 10.1007/s00285-007-0110-x. [DOI] [PMC free article] [PubMed] [Google Scholar]
- Schuwirth BS, et al. Structures of the bacterial ribosome at 3.5 A resolution. Science. 2005;310:827–834. doi: 10.1126/science.1117230. [DOI] [PubMed] [Google Scholar]
- Selmer M, et al. Structure of the 70S ribosome complexed with mRNA and tRNA. Science. 2006;313:1935–1942. doi: 10.1126/science.1131127. [DOI] [PubMed] [Google Scholar]
- Stombaugh J, et al. Frequency and isostericity of RNA base pairs. Nucleic Acids Res. 2009;37:2294–2312. doi: 10.1093/nar/gkp011. [DOI] [PMC free article] [PubMed] [Google Scholar]
- Strickland DM, et al. Optimal protein structure alignment using maximum cliques. Oper. Res. 2005;53:389–402. [Google Scholar]
- Wimberly BT, et al. Structure of the 30S ribosomal subunit. Nature. 2000;407:327–339. doi: 10.1038/35030006. [DOI] [PubMed] [Google Scholar]
- Yang H, et al. Tools for the automatic identification and classification of RNA base pairs. Nucleic Acids Res. 2003;31:3450–3460. doi: 10.1093/nar/gkg529. [DOI] [PMC free article] [PubMed] [Google Scholar]
- Zirbel CL, et al. Classification and energetic of the base-phosphate interactions in RNA. Nucleic Acids Res. 2009;37:4898–4918. doi: 10.1093/nar/gkp468. [DOI] [PMC free article] [PubMed] [Google Scholar]