Abstract
Introduction:
A modified pulsincap dosage form of 5-fluorouracil was developed to target drug to colorectal carcinoma according to daily oscillations of rate-limiting metabolizing enzyme dihydropyrimidine dehydrogenase.
Materials and Methods:
The capsule body was made water insoluble by exposing the body to formaldehyde vapor. A mixture of granules containing drug, superdisintegrant, and osmogen was filled in the capsule body. A hydrogel plug was fitted to the mouth of the treated body, and the untreated cap was fitted to the body which was coated with Eudragit S100. Developed formulations were evaluated for in vitro drug release in 1.2 pH (2 h), 6.8 pH (3 h), and 7.4 pH (up to 12 h) buffer solutions. A 23 full factorial design was used for optimization in which the type of hydrogel plug (X1), the type of osmogen (X2), and the type of superdisintegrant (X3) were selected as independent variables while, cap opening time, percentage drug released in 5(Q5), 6(Q6), and 12(Q12) h were taken as dependent variables.
Results:
Dissolution data were fitted to various models to ascertain the kinetic of drug release. Regression analysis and analysis of variance were performed for dependent variables. The results of the F-statistics were used to select the most appropriate model.
Conclusion:
Formulation F1 containing sodium starch glycolate, potassium chloride, and hydroxypropyl methylcellulose K4M plug was considered optimum since it showed more similarity to the theoretical predicted dissolution profile (f2 = 77.33). The studies indicate that the formulation was effective in providing in vitro colon targeted release and controlled release after predetermined lag time.
Keywords: Colorectal carcinoma, dihydropyrimidine dehydrogenase, full factorial design, modified pulsincapt
INTRODUCTION
The drug of choice in the treatment of carcinoma of stomach, colon, rectum, breast, ovary, and urinary bladder is 5-fluorouracil. For several decades, 5-fluorouracil (5-FU) stood alone as the only chemotherapeutic agent with clinical activity against colorectal cancer. A convention method of administration is the continuous intravenous (IV) infusion. Numerous active 5-fluorouracil schedules are in clinical use, but inconsistent and unpredictable oral bioavailability has historically accepted in intravenous administration. On intravenous administration, 5-fluorouracil produces severe systemic toxic effects including gastrointestinal, hematological, neural, cardiac, and dermatological origin.[1,2] The drug, despite low lipid solubility, enters the cerebrospinal fluid and the brain. Most of this systemic side effects are due to the cytotoxic effect of 5-fluorouracil after reaching unwanted sites. For conventional IV infusion, relatively short-acting drug requires continuous therapy so the epidural catheter has to be left in body. This impairs patient mobility and may cause complications such as infections and internal bleeding.
Plasma half-life of 5-FU is 10–20 min because of rapid enzymatic degradation caused by dihydropyrimidine dehydrogenase (DPD) due to daily oscillations in circadian clock genes.[3] Krugluger[4] et al. found a peak in DPD activity in circulating mononuclear cells of both healthy and cancer patients between 10:00 p.m. and 1:00 a.m. During 5-FU chronotherapy regimens, 5-FU activity during early morning time seems to result in least damage to bone marrow and gut, greatest antitumor effect, and best survival. Some research has shown that 5-fluorouracil is best tolerated in the mid-portion of a sleep cycle. So against colon cancer, the drug would be administered between 1:00 a.m. and 10:00 a.m., when the healthy cells are at rest and the cancer cells are most active.[4]
pH-dependent, time-dependent, or enzymatically controlled delivery systems are three major approaches of colon targeting. However, a disadvantage of the pH-dependent system is that a substantial amount of drug may be released in small intestine because the pH-difference between the small intestine and the large intestine not being very pronounced. Limitation of time-dependent release systems is that they are not able to sense any variation in the upper gastrointestinal tract (GIT) transit time due to the presence of food and disease conditions. Limitation of enzymatically controlled delivery system is a variation in the colonic flora. Alteration in composition of the GIT flora occurs under certain diseased states such as acute diarrhea, cholera, tropical spruce, inflammatory bowel disease (IBD), etc. The activity of the microbial enzymes is even more susceptible to diet, drug intake (particularly antibiotics and certain laxatives), and environmental factors.[5] Pulsincap delivery combines advantages of pH-dependent and time-dependent colon targeting and overcomes the disadvantages of conventional method of colonic delivery (pH, time, and microflora-assisted delivery).Modified pulsincap™ dosage form consists of a formaldehyde-treated water-insoluble body and a water-soluble cap. The amino groups in the gelatin molecular chain could react with an aldehyde group of formaldehyde by Schiff's base condensation reaction to produce a water-insoluble body. A mixture of drug, osmogen, and swelling agent is incorporated within the body, plugged with hydrogel plug and the cap is enteric coated to prevent variable gastric emptying. Water enters into the permeable body and the mixture of osmogen and superdisintegrant pushes the plug outside. After reaching the colon, enteric polymer dissolves and the plug is ejected from the body with the release of drug in colon.[6,7]
The aim of the present investigation was to develop an oral rate-controlled targeted delivery of 5-fluorouracil which not only reduces systemic side effects, but also provides an effective and safe therapy for colon cancer with reduced dose and reduced duration of therapy according to circadian rhythm of the body. The present investigation is aimed to formulate a modified pulsincap with time of administration between 9:30 p.m. and 10:00 p.m. with a lag time of about 5 h considering gastric and intestinal emptying time as well as peak enzyme activity time (10 p.m.–1 a.m.). The developed formulation is expected to release the drug after 3:00 a.m. when dosage form is expected to reach in colon, while DPD activity is less. After the lag period, dosage form is expected to sustain the release of the drug for at least 6–7 h to eliminate the problem of short biological half life.
MATERIALS AND METHODS
Materials
5-fluorouracil was purchased from Sigma Life Science, USA. Hydroxypropyl methylcellulose K4M (HPMC K4M), crosscarmellose sodium, and Eudrgit® S100 were obtained from Yarrow Chem. Products (Mumbai, India). Potassium chloride, sodium chloride, sodium alginate, and sodium starch glycolate were obtained from Finar Chemical Limited (Ahmedabad, India). All other materials and chemicals used were of either pharmaceutical or analytical grade.
Methods
Preparation of formaldehyde-exposed hard gelatin capsule bodies
The hard gelatin capsules of 00 size were taken. The bodies of hard gelatin capsules were placed on a wire mesh. Formaldehyde (15%) was taken into a desiccator and potassium permanganate was added to it until vapor was produced. The reaction was carried out for 12 h after which bodies were removed and dried at 50 °C to ensure completion of the reaction between gelatin and formaldehyde vapor.[6] Reaction time was optimized by taking samples of capsules at 20-, 30-, 40-, 50-, and 60-min interval. The collected samples were assayed for the residual formaldehyde content. The effect of 0.1 N hydrochloric acid was performed on both the treated and untreated bodies.
Estimation of residual formaldehyde content in treated gelatin capsule bodies
The residual formaldehyde content in treated bodies was determined as per the method described by William.[8,9] Vapor hardened capsule body samples collected at 20-, 30-, 40-, 50-, and 60-min interval were cut into small pieces. Pieces of capsule samples were added separately to a mixture of 1 ml of 10% chromotropic acid solution and 10 ml of concentrated sulfuric acid in different test tubes. All test tubes were placed in a beaker filled with water for boiling. After cooling to room temperature, contents of test tubes were quantitatively transferred to a 100 ml volumetric flask and diluted up to the mark with distilled water. A blank was prepared in the similar way using 1 ml distilled water in place of pieces of body. Absorbance of sample was measured by colorimetry at 569 nm.
Preparation of sustained release granules containing 5-fluorouracil
The granules containing 5-fluorouracil were prepared to sustain the release of drug after predetermined lag time. Composition of granules per capsule is shown in Table 1. All the ingredients were passed through 100 # sieve and thoroughly mixed. The mixture was granulated through 20 # sieve using ethyl cellulose (20 cps) solution in ethanol as a binder. The prepared granules were dried at room temperature. The fines were separated using 60 # sieve to obtain 20–60 # sieve granules.
Table 1.
Composition and characterization of granules containing 5-fluorouracil per capsule

Characterization of sustained release granules
Granules were tested for flow property and content uniformity. The flow property was determined by a fixed height funnel method. For content uniformity, 100 mg granules containing 5-fluorouracil were crushed in a mortar, taken in a 100 ml volumetric flask and pH 7.4 phosphate buffer was added up to the mark. The flask was then placed on a magnetic stirrer at 100 rpm for 12 h. The flask solution was filtered through a 0.45 μm membrane filter, suitably diluted, and assayed at 266 nm using a Shimadzu UV 1800 double-beam spectrophotometer (Shimadzu, Kyoto, Japan).
Preliminary screening
The preliminary screening was performed to optimize the effect of Eudragit S100 concentration (P1–P4), osmogen concentration (P5–P8), superdisintegrant concentration (P7, P9, and P10) and different types of filler (P7 and P11) on cap opening time. Batches P1–P11 of preliminary screening are shown in Table 2. All batches were filled with sustained release granules, mixture of osmogen and superdisintegrant, and lastly with filler. The mouth of the body was fitted with the compressed hydrogel plug. The hydrogel plug was compressed using a double rotary tablet compression machine, Karnavati Engg. Pvt. Ltd., Ahmedabad, in 7-mm diameter punch with compression force 2 kg/cm2. A direct compression method was used for preparing the hydrogel plug. Then, a cap was placed onto the body. The mouth of the body was fitted with a compressed hydrogel plug (7 mm diameter). Then a cap was placed onto the body. Only the cap was coated with different concentrations of Eudragit S100 solution in acetone containing Sudan IV as a coloring agent. Average percentage weight gain after Eudragit coating was 7.94%.
Table 2.
Batches for preliminary screening

In vitro dissolution study
The in vitro dissolution study of 5-fluorouracil pulsincap was performed using an USP apparatus (model TDT-08T, Electrolab, Mumbai, India) fitted with a paddle (50 rpm) at 37 ± 0.5 °C. Dissolution media were 900 ml of 0.1 M HCl for 2 h (since average gastric emptying time is 2 h) and 900 ml of phosphate buffer pH 6.8 for 3 h (average small intestinal transit time). After 5 h, the dissolution medium was replaced with pH 7.4 phosphate buffer (900 ml) and tested for the drug release up to 12 h. At the predetermined time intervals, 10 ml samples were withdrawn, filtered through a 0.45 μm membrane filter, diluted, and assayed at 266 nm using a Shimadzu UV 1800 double-beam spectrophotometer (Shimadzu, Kyoto, Japan). Cumulative percentage drug release was calculated using an equation obtained from a calibration curves.[1,2,6,9] In vitro dissolution profile of batches F1–F8 is shown in Figure 1.
Figure 1.
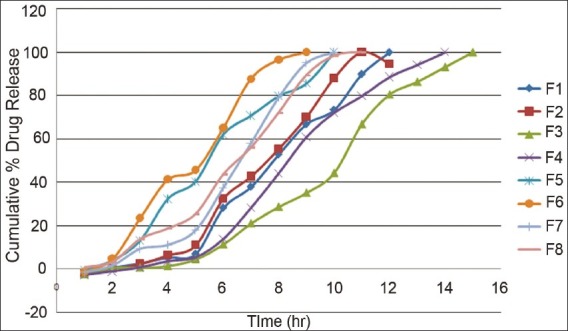
In vitro dissolution profile of prepared formulations (F1–F8).
Optimization of variables using full factorial design
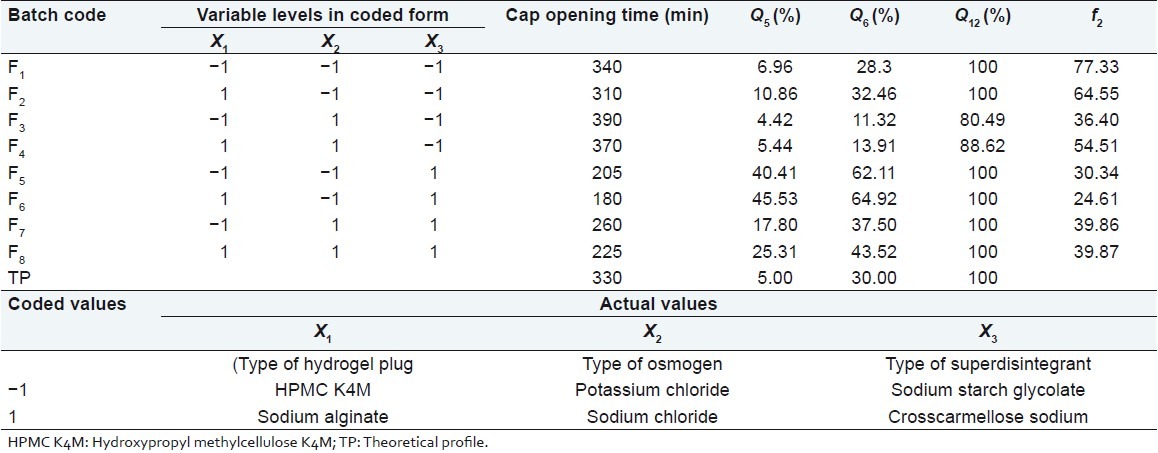
A 23 randomized full factorial design was used in this study. In this design three factors were evaluated, each at two levels, and experimental trials were performed for all eight possible combinations. The type of hydrogel plug (X1), the type of osmogen (X2), and the type of superdisintegrant (X3) were selected as independent variables while, cap opening time, percentage drug released in 5 (Q5), 6 (Q6), and 12 (Q12) h were taken as dependent variables. The formulation layout for the factorial design batches (F1–F8) is shown in Table 3.
Table 3.
Formulation and evaluation of batches in the 23 full factorial design
Kinetic modeling of dissolution data
The dissolution profile of all batches were fitted to various models such as zero order, first order, Higuchi,[10] Hixon Crowell,[11] Korsmeyer and Peppas,[12] to ascertain the kinetic of drug release. The method described by Korsemeyer and Peppas was used to describe the mechanism of the drug release.
Comparison of dissolution profiles for selection of optimum batch
The similarity factor (f2) given by SUPAC guidelines for a modified release dosage form was used as a basis to compare dissolution profiles. The dissolution profiles are considered to be similar when f2 is between 50 and 100. The dissolution profiles of products were compared using f2 which is calculated from the following formula:

Where n is the dissolution time and Rt and Tt are the reference (here this is the theoretical dissolution profile of 5-fluorouracil) and test dissolution value at time t.[13]
Drug excipients interaction study
The Fourier transform infrared (FTIR) technique has been used to study the physical and chemical interactions between the drug and excipients used. FTIR spectrum of 5-fluorouracil, HPMC K4M, ethyl cellulose, lactose, and a physical mixture of 5-fluorouracil:HPMC K4M:ethyl cellulose:lactose was recorded using a KBr mixing method on a FTIR instrument available at the central instrument laboratory of the institute (FTIR-1700, Shimadzu, Kyoto, Japan).
In vivo study of prepared formulation
The prepared formulation was tested for an in vivo study to check the passage of the dosage form throughout the GIT. The purpose of the in vivo study was to find the location of the capsule during its passage through the GI tract.th In this study, drug granules were replaced with barium sulfate. The dosage form was prepared in the similar manner as optimized formulation. An X-ray study was performed at the Sanjivani imaging centre, Ahmedabad. The volunteer with overnight fasting was taken for the study. The laxative was given to the volunteer before 12 h of the study to completely empty the GIT content. The X-ray study was performed at 2-h, 3-h, 5-h, and 8-h interval.
RESULTS AND DISCUSSION
Estimation of residual formaldehyde content in treated gelatin capsule bodies
The orally tolerated limit of formaldehyde is 0.1%.[14] The residual amount of formaldehyde was 0.0081% after 50-min heat exposure time for the completion of reaction. After 50 min, the residual formaldehyde level was near constant. Since 50 min reaction time was optimum, the residual amount of formaldehyde remained in the capsule was safe for oral intake. The effect of 0.1 N hydrochloric acid was performed on both treated and untreated capsule bodies. The treated bodies were remained unaffected by 0.1 N HCl for 24 h while untreated bodies collapsed within 15 min.
Characterization of sustained release granules
Granules containing 5-fluorouracil exhibited good flow property and the drug content of the granules was found to be 88% as evident from Table 1.
Preliminary screening
The evaluation results for cap opening time showed that concentration of Eudragit S100 coating solution, osmogen, superdisintegrant, and filler had significant effect on cap opening time [Table 2]. Results of batch P1–P4 showed that average cap opening time was delayed with increasing the Eudragit S100 concentration. For colon targeted release, 5:30 h (~330 min) is considered the ideal lag period. Eudragit 4% solution (Batch P2) was considered optimized coating solution with cap opening time of about 330 ±10 min. Osmogen alone had an unpredictable effect on cap opening time. Therefore, the mixture of osmogen and superdisintegrant was used in investigation. From the results of P5–P11, it was concluded that 100 mg KCl and 100 mg sodium starch glycolate (Batch P7) were optimum with ~5:30 h lag time. Average cap opening time was decreased with increasing the concentration of osmogen and superdisintegrant. The result of batch P11 showed that microcrystalline cellulose (PH 101 grade) delayed the lag time up to ~9 h.
Full factorial design
A statistical model incorporating interactive and polynomial terms was used to evaluate the responses.
![]()
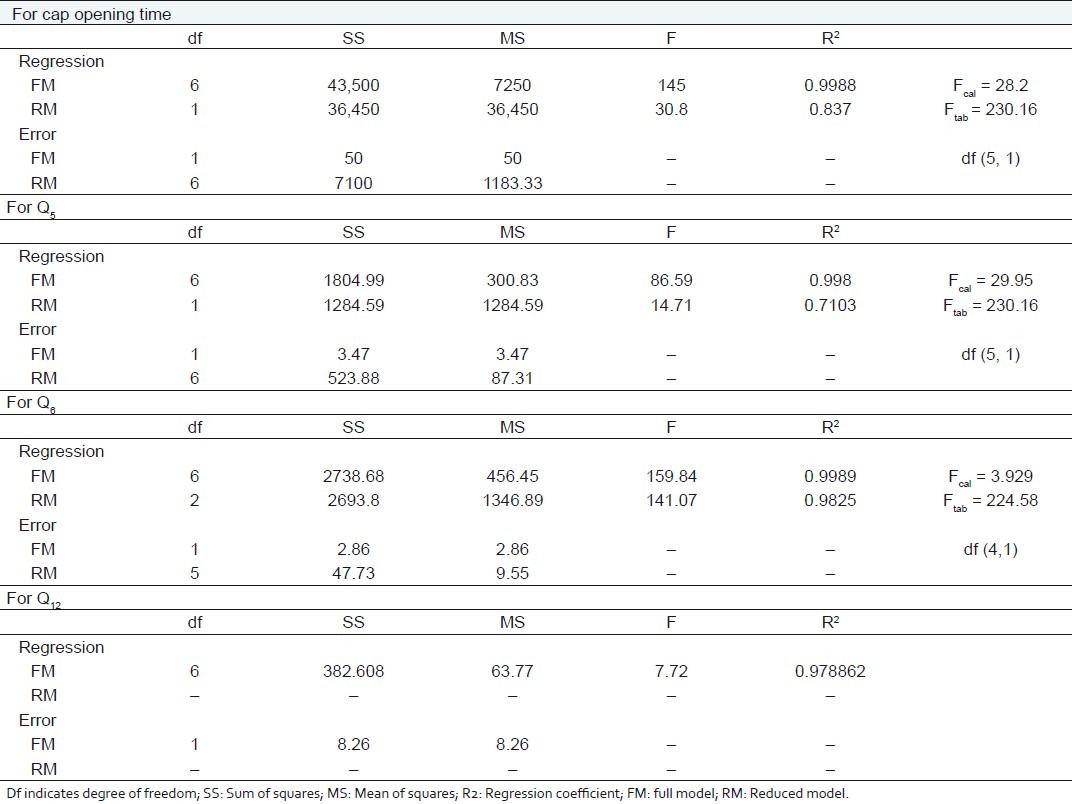
where Y is the dependent variable, b0 is the arithmetic mean response of the eight runs, and bi is the estimated coefficient for the factor Xi. The main effects (X1, X2, and X3) represent the average result of changing 1 factor at a time from its low to high values. The two-way interaction terms (X1X2) show how the response changes when two factors are simultaneously changed. The three-way interaction terms (X1X2X3) show how the response changes when three factors are simultaneously changed. The dissolution profile for eight batches showed a variation (i.e., cap opening time ranging from 180 to 390 min and drug released after 6 h ranging from 11.34% to 64.92%). The data indicate that the release profile of the drug is strongly dependent on the selected independent variables. The fitted equations (full and reduced) relating the responses, cap opening time, Q5, Q6, Q12 to the transformed factor are shown in Table 4. The polynomial equations can be used to draw conclusions after considering the magnitude of coefficient and the mathematical sign it carries (i.e., negative or positive). Table 5 shows the results of analysis of variance (ANOVA), which was performed to identify insignificant factors. Data were analyzed using Microsoft® Excel.
Table 4.
Summary of results of regression analysis
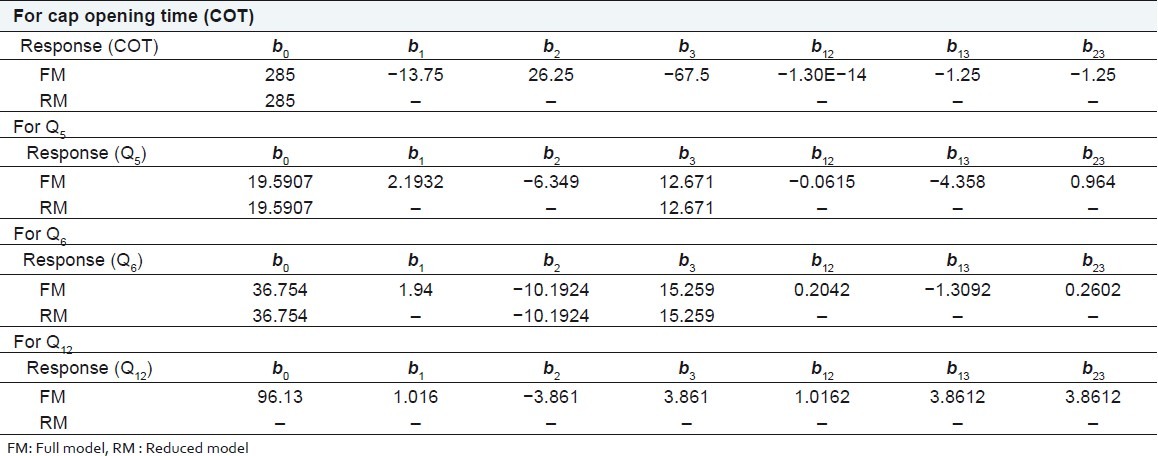
Table 5.
Calculation for testing the model in portions
R2 value for cap opening time, Q5, Q6, and Q12 are 0.9988, 0.9980, 0.9989, and 0.9789, respectively, indicating good correlation between dependent and independent variables. The reduced models were developed for response variables by omitting the insignificant terms with P > 0.05. The terms with P < 0.05 were considered statistically significance and retained in the reduced model. The coefficients for full and reduced models for response variables are shown in Table 4.
Full and reduced model for cap opening time
The significance levels of the coefficients b1, b2, b12, b23, and b13 were found to be P = 0.114, 0.060, 1.0, 0.7048, and 0.7048, respectively, hence they were omitted from the full model to generate a reduced model. The results of statistical analysis are shown in Table 4. The coefficient b3 was found to be significant at P < 0.05; hence they were retained in the reduced model. The reduced model was tested in proportion to determine whether the coefficients b1, b2, b12, b23, and b13 contribute significant information to the prediction of cap opening time.[15] The results of model testing are shown in Table 5. The critical value of F for α = 0.05 is equal to 230.16 (df = 5, 1). Since the calculated value (F = 28.2) is less than critical value (F =230.16), it may be concluded that the term b1, b2, b12, b23 , and b13 do not contribute significantly to the prediction of cap opening time and can be omitted from the full model to generate the reduced model.
Full and reduced model for Q5
The significance levels of the coefficients b1, b2, b12, b23, and b13 were found to be P = 0.18, 0.065, 0.94, 0.095, and 0.38, respectively, so they were omitted from the full model to generate a reduced model. The results of statistical analysis are shown in Table 4. The coefficient b3 was found to be significant at P < 0.05; hence they were retained in the reduced model. The reduced model was tested in proportion to determine whether the coefficients b1, b2, b12, b23, and b13 contribute significant information to the prediction of Q5 . The results of model testing are shown in Table 5. The critical value of F for α = 0.05 is equal to 230.16 (df = 5, 1). Since the calculated value (F = 29.95) is less than the critical value (F = 230.16), it may be concluded that the term b1, b2, b12, b23, and b13 do not contribute significantly to the prediction of Q5 and can be omitted from the full model to generate the reduced model.
Full and reduced model for Q6
The significance levels of the coefficients b1, b12, b23 , and b13 were found to be P = 0.19, 0.79, 0.27, 0.74, respectively, so they were omitted from the full model to generate a reduced model. The results of statistical analysis are shown in Table 4. The coefficients b2 and b3 were found to be significant at P < 0.05; hence they were retained in the reduced model. The reduced model was tested in proportion to determine whether the coefficient b1, b12, b23 , and b13 contribute significance information to the prediction of Q 6 . The results of model testing are shown in Table 5. The critical value of F for α = 0.05 is equal to 224.58 (df = 4, 1). Since the calculated value (F = 3.93) is less than the critical value (F = 224.58), it may be concluded that the term b1, b12, b23, and b13 do not contribute significantly to the prediction of Q6 and can be omitted from the full model to generate the reduced model.
Full model for Q12
The significance levels of the coefficients b1, b2, b3, b12, b23, and b13 were found to be P = 0.50, 0.163, 0.163, 0.499, 0.163, and 0.499, respectively. Coefficients b1, b2, b3, b12, b23, and b13 do not contribute significantly to the prediction of %drug release after 12. Therefore, generation of the reduced model from the full model is not possible. The results of statistical analysis are shown in Table 4.
Kinetic modeling of dissolution data
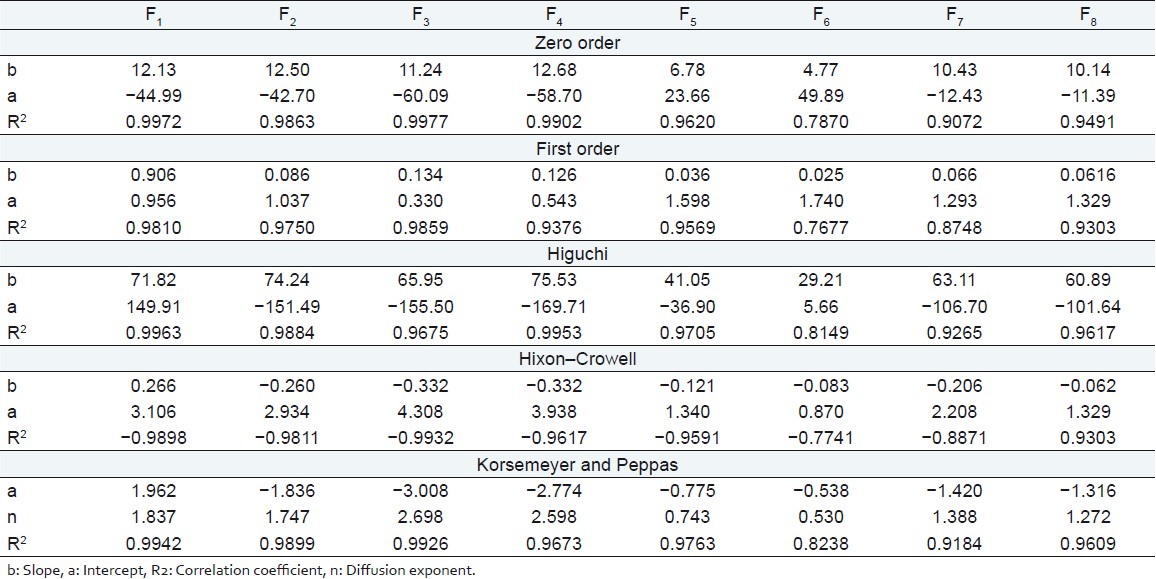
The kinetics of the dissolution data were well fitted to zero order, Higuchi model, and Korsemeyer–Peppas model for batches F1–F5 as evident from regression coefficients Table 6. Batches F6 and F7 followed the Korsemeyer–Peppas and Higuchi model, respectively, while batch F8 followed both the models. In the case of the controlled or sustained release formulations, diffusion, swelling, and erosion are the three most important rate controlling mechanisms. Formulation containing swelling polymers show swelling as well as diffusion mechanism because the kinetic of swelling include relaxation of polymer chains and imbibitions of water, causing the polymer to swell and changing it from a glassy to rubbery state. The diffusion exponent n is the indicative of mechanism of drug release from the formulation. For a swellable cylindrical (tablet) drug delivery system, the n value of 0.45 is indicative of Fickian diffusion controlled drug release, n value between 0.5 and 0.85 signifies anomalous (non-Fickian) transport, n value of 0.85 indicates case II transport, and n value greater than 0.85 indicates super case II transport.[16,17] The value of diffusion exponent n for factorial formulations F1, F2, F3, F4, F7, and F8 are greater than 0.85 [Table 6] indicating super case II transport drug release from the formulations while the values for formulations F5 and F6 are between 0.5 and 0.85 [Table 6] indicating anomalous non-Fickian transport.
Table 6.
Kinetic treatment of dissolution data
Comparison of dissolution profiles for selection of optimum batch
The values of similarity factor (f2) for batches F1–F8 are shown in Table 3. The batch F1 showed a maximum value of f2 (77.33), hence was selected as the optimum batch.
Drug excipients interaction study
Drug-excipients interactions play a vital role in the release of drug from formulation. The pure 5-fluorouracil and its mixture with HPMC K4M, ethyl cellulose, and lactose was mixed separately with IR grade KBr and were scanned over a range of 400–4500 cm–1 using a FTIR instrument (FTIR-1700, Shimadzu, Kyoto, Japan). The drug exhibits peaks due to the cyclic ketonic group, the secondary amino group, the C=C stretching, and C–F group. It was observed that there were no changes in these main peaks in the IR spectra of a mixture of drug and polymers [Figures 2–5]. The FTIR study revealed no physical or chemical interactions of 5-fluorouracil with HPMC K4M, ethyl cellulose, and lactose as evident from Figure 6.
Figure 2.
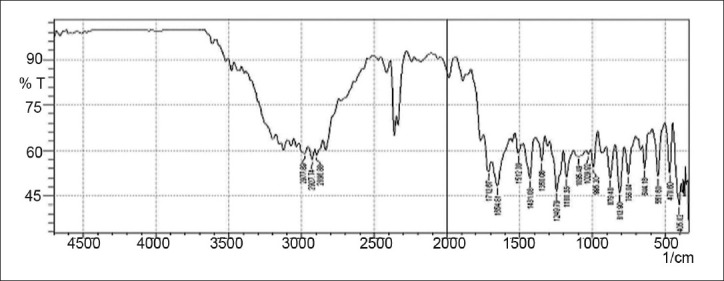
FTIR spectrum of 5-fluorouracil
Figure 5.
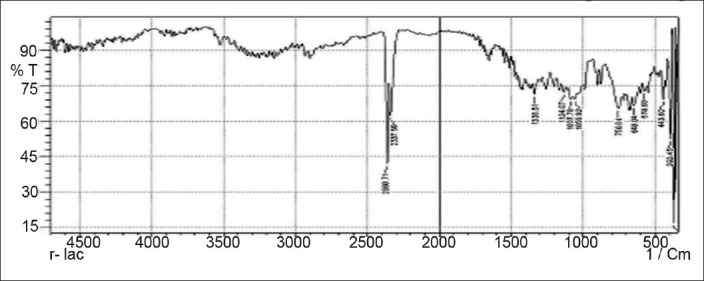
FTIR spectrum of lactose
Figure 6.
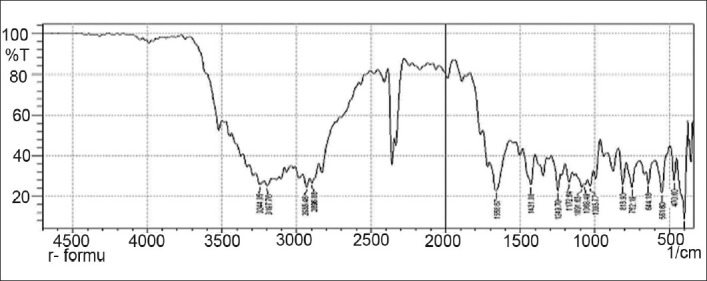
FTIR spectrum of physical mixture (5-fluorouracil, HPMC K4M, ethyl cellulose, and lactose)
Figure 3.
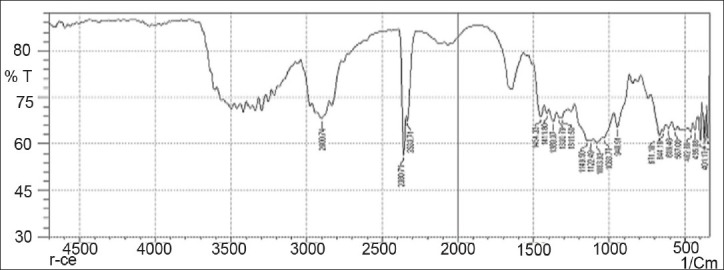
FTIR spectrum of HPMC K4M
Figure 4.
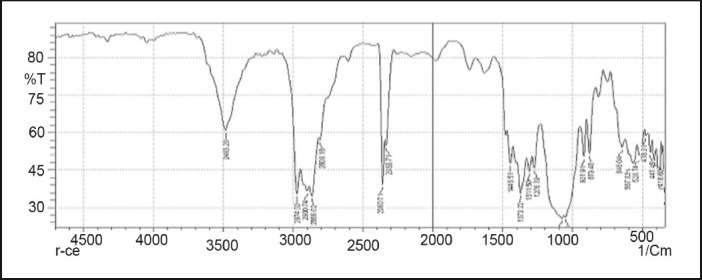
FTIR spectrum of ethyl cellulose
In vivo study of prepared formulation
The digital X-ray photographs of GIT are shown in Figures 7–10. From the photographs, it was concluded that the dosage form was present in the ileal loop after 2 h. After 3-h interval, the capsule reached the ileocaecal junction. The capsule was present in proximal ascending colon after 5 hand was present at the hepatic flexure of colon after 8 h. From Figure 10, it was clear that the content of the capsule was dispersed in colon. The study revealed the targeting of dosage form and drug release in colon.
Figure 7.
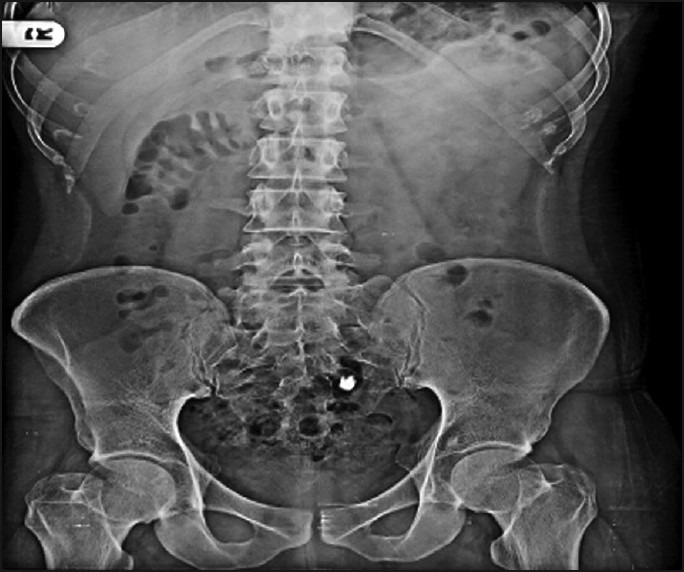
Physical examination of delivery system after 2 h.
Figure 10.
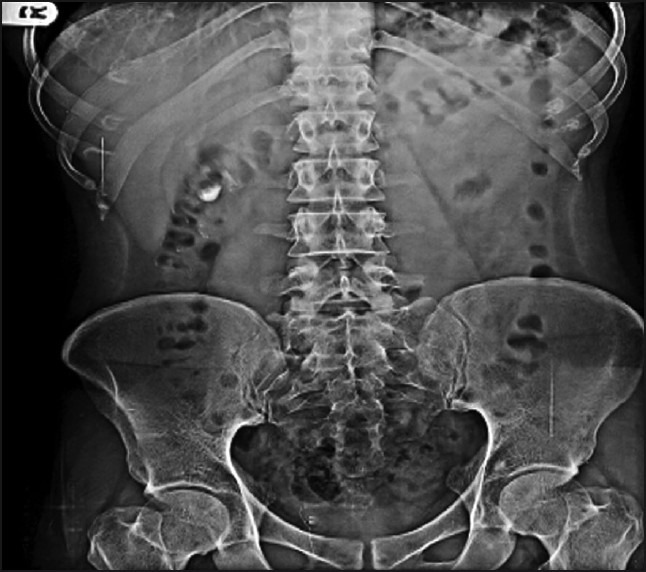
Physical examination of delivery system after 8 h.
Figure 8.
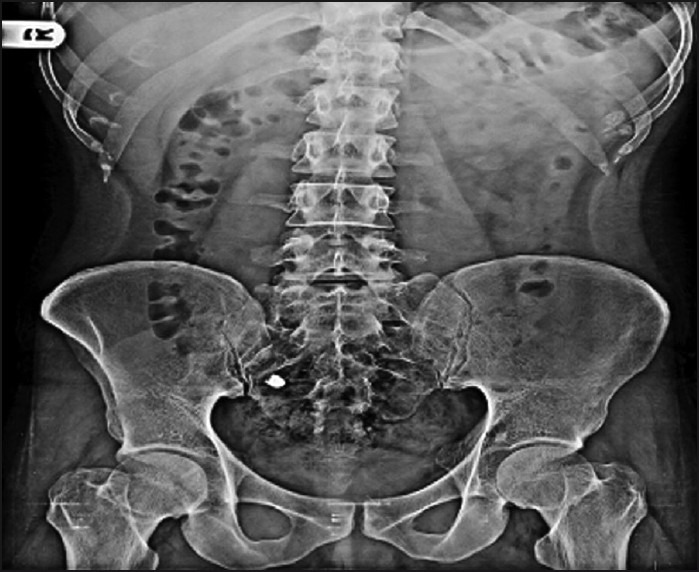
Physical examination of delivery system after 3 h.
Figure 9.
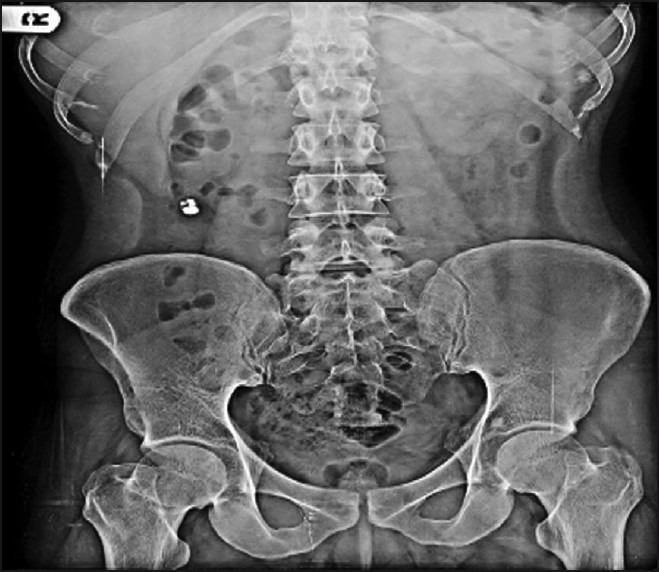
Physical examination of delivery system after 5 h.
CONCLUSION
This study revealed that the modified pulsincap delivery of 5-fluorouracil formulated using sodium starch glycolate, potassium chloride, and HPMC K4M plug was effective in providing controlled zero-order release of 5-fluorouracil after ~5 h lag time. It was also concluded from the results that this modified pulsincap delivery is suitable for the delivery of drug according to daily oscillations of rate limiting enzyme DPD.
ACKNOWLEDGMENTS
The authors thank Shri Sarvajanik Pharmacy College, Mehsana, for providing all other ingredients and required infrastructure for the conduct of this research work.
Footnotes
Source of Support: Nil.
Conflict of Interest: None declared.
REFERENCES
- 1.Krishnaiaha YS, Satyanarayana V, Dinesh Kumar B, Karthikeyan RS. In vitro drug release studies on guar gum-based colon targeted oral drug delivery systems of 5-fluorouracil. Eur J Pharm Sci. 2002;16:185–92. doi: 10.1016/s0928-0987(02)00081-7. [DOI] [PubMed] [Google Scholar]
- 2.Krishnaiah YS, Satyanarayana V, Dinesh Kumar B, Karthikeyan RS, Bhaskar P. In vivo pharmacokinetics in human volunteers: Oral administered guar gum-based colon-targeted 5-fluorouracil tablets. Eur J Pharm Sci. 2003;19:355–62. doi: 10.1016/s0928-0987(03)00139-8. [DOI] [PubMed] [Google Scholar]
- 3.Shishu , Gupta N, Aggarwal N. Stomach-specific drug delivery of 5-fluorouracil using floating alginate beads. AAPS PharmSciTech. 2007;8(Article 48) doi: 10.1208/pt0802048. [DOI] [PMC free article] [PubMed] [Google Scholar]
- 4.Krugluger W, Brandstaetter A, Kallay E, Schueller J, Krexner E, Kriwanek S, et al. Regulation of genes of the circadian clock in human colon cancer: Reduced period-1 and dihydropyrimidine dehydrogenase transcription correlates in high-grade tumors. Cancer Res. 2007;67:7917–22. doi: 10.1158/0008-5472.CAN-07-0133. [DOI] [PubMed] [Google Scholar]
- 5.Sinha VR, Kumri R. Microbially triggered drug delivery to the colon. Eur J Pharm Sci. 2003;18:3–18. doi: 10.1016/s0928-0987(02)00221-x. [DOI] [PubMed] [Google Scholar]
- 6.Abraham S, Srinath MS. Development of modified pulsincap drug delivery system for drug targeting. Indian J Pharm Sci. 2007;59:24–7. [Google Scholar]
- 7.Seshasayana A, Rao SB, Prasanna R, Narayan CP, Raman murthy KV. Studies on release of rifampicin from modified pulsincap technique. Indian J Pharm Sci. 2001;59:337–9. [Google Scholar]
- 8.William WJ. Analytical methods for a textile laboratory: Determination of formaldehyde. American Association of Textile Chemists and Colorists. 1984:239–41. [Google Scholar]
- 9.Samanta MK, Suresh NV, Suresh B. Development of pulsincap drug delivery of salbutamol sulphate for drug targeting. Indian J Pharm Sci. 2000;62:102–7. [Google Scholar]
- 10.Higuchi T. Mechanism of sustained action mediation, theoretical analysis of rate of release of solid drugs dispersed in solid matrices. J Pharm Sci. 1963;52:1145–9. doi: 10.1002/jps.2600521210. [DOI] [PubMed] [Google Scholar]
- 11.Hixon AW, Crowell JH. Dependence of reaction velocity upon surface and agitation. Ind Engg Chem. 1931;23:923–31. [Google Scholar]
- 12.Korsmeyer RW, Gurny R, Doelker E, Buri P, Peppas NA. Mechanism of solute release from porous hydrophilic polymers. Int J Pharm. 1983;15:25–35. doi: 10.1002/jps.2600721021. [DOI] [PubMed] [Google Scholar]
- 13.Coasta P, Manuel J, Labao S. Modelling and comparison of dissolution profiles. Eur J Pharm Sci. 2002;13:123–33. doi: 10.1016/s0928-0987(01)00095-1. [DOI] [PubMed] [Google Scholar]
- 14.International Programme on Chemical safety. Geneva: World Health Organization; 1989. [Last accessed on 2011 Mar 15]. Environmental Health Criteria 89: Formaldehyde. Available from: http://www.inchem.org/documents/ehc/ehc/ehc89.htm . [Google Scholar]
- 15.Mendenhall W, Sincich T. 3rd ed. San Francisco, CA: Dellen Publishing Co 1989; 1989. Multiple regression.A second course in Business statisticals, Regression analysis; pp. 141–226. [Google Scholar]
- 16.Siepmam J, Peppas NA. Modelling of drug release from delivery system based on hydroxylpropyl methylcellulose. Adv Drug Deliv Rev. 2001;48:139–57. doi: 10.1016/s0169-409x(01)00112-0. [DOI] [PubMed] [Google Scholar]
- 17.Ritger PL, Peppas NA. A simple equation for description of solute release from swellable device. J Control Release. 1987;5:7–42. [PubMed] [Google Scholar]


