Abstract
The overall objective of the present work was to develop an oral sustained-release (SR) metformin tablet prepared by the direct compression method, using hydrophilic hydroxylpropylmethylcellulose (HPMC) and Guar gum polymer alone and in combination at different concentrations. Metformin hydrochloride (HCl), a biguanide, has a relatively short plasma half-life and low absolute bioavailability. All the batches were evaluated for thickness, weight variation, hardness and drug content uniformity and in vitro drug release. Mean dissolution time is used to characterize the drug release rate from a dosage form, and indicates the drug release-retarding efficiency of the polymer. The hydrophilic matrix of HPMC alone could not control the Metformin release effectively for 12 h whereas when combined with Guar gum, it could slow down the release of drug and, thus, can be successfully employed for formulating SR matrix tablets. Fitting the data to the Korsmeyer equation indicated that diffusion along with erosion could be the mechanism of drug release. Similarity factor ƒ2 values suggest that the test and reference profiles are identical.
Keywords: Guar gum, hydroxylpropylmethylcellulose K100M, matrix tablets, release kinetics, similarity factors
INTRODUCTION
Sustained-release (SR) oral delivery systems are designed to achieve therapeutically effective concentrations of drug in systemic circulation over an extended period of time. Possible therapeutic benefits of a properly designed SR dosage form include low cost, simple processing, improved efficacy, reduced adverse events, flexibility in terms of the range of release profiles attainable, increased convenience and patient compliance.[1,2] Many innovative methods have been developed for obtaining modified drug release. From the practical view point, hydrophilic matrix tablet is one of the least-complicated approaches for developing a modified release dosage form.
Hydroxypropylmethylcellulose (HPMC) is a hydrophilic cellulose ether widely used as a pH-independent gelling agent in controlled the release preparation due to the release behavior of the drug.[3] Because of nontoxicity, easy handling and no requirement of specified technology for production of SR tablets, HPMC is often used as a release-retarding material.[4] The transport phenomena involved in the drug release from hydrophilic matrices are complex because the microstructure and macrostructure of HPMC exposed to water are strongly time-dependent. Upon contact with the gastrointestinal fluid, HPMC swells, gels and finally dissolves slowly.[5] The gel becomes a viscous layer acting as a protective barrier to both the influx of water and the efflux of the drug in solution. The dissolution can be diffusion controlled depending on the molecular weight and thickness of the diffusion boundary layer.
Guar gum is a nonionic polysaccharide derived from the seeds of Cyamopsis tetragonolobus, family Leguminosae. In pharmaceuticals, guar gum is used in solid dosage forms as a binder and disintegrant.[6] Many researchers have reported the use of guar gum, as a hydrophilic matrix, for designing oral controlled-release dosage forms.[7–9]
Metformin hydrochloride(HCI), the only available biguanide, remains the first-line drug therapy for patients with Type 2 diabetes mellitus (T2DM), acting by decreasing the hepatic glucose output and peripheral insulin resistance.[10] The advantages of metformin are a very low risk of hypoglycemia, weight neutrality and reduced risk of cardiovascular morbidity and mortality.[11] It is an oral anti-hyperglycemic agent, shows incomplete absorption from the gastrointestinal tract and the absolute bioavailability is 50–60% with a relatively short plasma half-life of 1.5–4.5 h.[12,13]
An obstacle to more successful use of metformin therapy is the high incidence of concomitant gastrointestinal symptoms such as abdominal discomfort, nausea and diarrhea that especially occur during the initial weeks of treatment.[14] Side-effects and the need for administration two or three times per day when larger doses are required can decrease patient compliance. A SR formulation that would maintain plasma levels of the drug for 10–16 hours might be sufficient for once-daily dosing of metformin. SR products are needed for metformin to prolong its duration of action and to improve patient compliance.
The overall objective of this study was to develop matrix SR tablets of metformin using natural gums (Guar gum) as suitable hydrophilic matrix systems compared with the extensively investigated hydrophilic matrices (HPMC) with respect to the in vitro drug release rate.
MATERIALS AND METHODS
Materials
Metformin hydrochloride was obtained from Vama Pharmaceuticals (Nagpur, India). Microcrystalline cellulose (MCC, Avicel pH 101) was purchased from S. D. Fine Chem. Labs (Mumbai, India). HPMC K100M were obtained as a gift sample from Colorcon, Mumbai, India and Guar gum was obtained as gift samples from Dabur Research Foundation (New Delhi, India). All other ingredients used were of laboratory reagents and were used as such without further testing.
Methods
Study of physical interaction between drug and polymer
Infrared spectrum was taken by scanning the samples of pure drug and polymers individually over a wave number range of 4000–400 cm cm-1 using a Fourier transform infrared spectrophotometer (FT-IR, Shimadzu 8400S; Shimadzu, Kyoto, Japan). The change in spectra of the drug in the presence of polymer was investigated, which indicated the physical interaction of the drug molecule with the polymer.
Diffrential scanning calorimeter study of untreated and spray-dried metformin hydrochloride samples was carried out on a differential scanning calorimeter (model DSC7; Perkin Elmer, LAS UK). The thermal analysis was performed in a nitrogen atmosphere at a heating rate of 10°C/min over a temperature range of 30–300°C. Alumina was employed as the reference standard.
The onsets of melting points and enthalpies of fusion of samples were automatically calculated by the instrument.
Preparation of metformin hydrochloride matrix tablets
Different matrix-embedded formulations of metformin hydrochloride were prepared by the direct compression method using varying proportions of polymers, either alone or in combination. The composition of various formulations of the tablets with their codes is listed in Table 1. The ingredients were passed through a 60-mesh sieve. A calculated amount of the drug, polymer (HPMC, Guar gum) and filler (MCC) was mixed thoroughly. Magnesium stearate was added as lubricant; the appropriate amount of the mixture was weighed and then compressed using a an eight station rotary press (Rimek Minipress I, Ahmadabad, India) at a constant compression force equipped with 14-mm flat-faced punches at a compression force required to produce tablets of about 7–8 kg/cm2 hardness. All the tablets were stored in airtight containers for further study. Before compression, the granules were evaluated for their flow and compressibility characteristics.
Table 1.
Composition of various trial formulations for the sustained-release tablet containing metformin hydrochloride

Evaluation of the tablets
The prepared matrix tablets were characterized immediately after preparation for hardness, weight variation, thickness, friability and drug content.[15,16] The weight variation of the tablets was evaluated (n = 20 tablets) using an electronic balance (Sansui AJ 22OE, Japan). The hardness of the tablets (n = 6) was tested using a Monsanto hardness tester (Campbell Electronics,Mumbai, India). Friability (n = 10) was determined in a Roche friabilator (Campbell Electronics) for 4 min at a speed of 25 rpm (Campbell Electronics). The thickness of the tablets was measured by a vernier caliper. Drug content was analyzed by measuring the absorbance of the standard and the samples at λ = 233 nm using a UV/Visible spectrophotometer (Shimadzu 1601; Shimadzu).
In vitro drug release studies
Drug release studies were conducted using the USP-XXII dissolution apparatus-2, paddle-type (Electrolab, Mumbai, India), at a rotational speed of 50 rpm at 37±0.5°C. The dissolution media used were 900 mL of 0.1 mol/L HCl for the first 2 h followed by pH 6.8 phosphate buffer solutions for 12 h. Sink condition was maintained for the whole experiment. Samples (10 mL) were withdrawn at regular intervals and the same volume of prewarmed (37±0.5°C) fresh dissolution medium was replaced to maintain the volume constant. The samples withdrawn were filtered through a 0.45-μ membrane filter (Nunc, New Delhi, India) and the drug content in each sample was analyzed after suitable dilution with a UV spectrophotometer (Shimadzu UV-1700; Shimadzu) at 233 nm. The dissolution test was performed in triplicate. Drug dissolved at specified time periods was plotted as cumulative percent release versus time (h) curve.
Release kinetics
In order to study the drug release mechanism of the examined tablets, the dissolution profile was analyzed according to the different zero-order, first-order and Higuchi square root kinetic equations.[17–19] The best fit with higher correlation (r2 = 0.98) was found with Higuchi's equation for all the formulations. Two factors, however, diminish the applicability of Higuchi's equation to the matrix systems. This model fails to allow for the influence of swelling of the matrix (upon hydration) and gradual erosion of the matrix. Therefore, the dissolution data were also fitted according to the well-known exponential Korsmeyer-Peppas equation,[19] which is often used to describe drug release behavior from polymeric systems.
Mt/M∞ = K.tn
where,
Mt/M∞ = fraction solute release
t = release time
K = kinetic constant characteristic of the drug/polymer system
n = diffusional coefficient indicating release mechanism
In the present study, the limits considered were n = 0.45 (indicates a classical Fickian diffusion-controlled drug release) and n = 0.85 (indicates a case II relaxational release transport; non-Fickian, zero-order release). Values of n between 0.45 and 0.85 can be regarded indicators of both phenomena (drug diffusion in the hydrated matrix and the polymer relaxation), commonly called anomalous transport.
In order to compare the release profiles of different formulas with a possible difference in release mechanisms (n-values), a mean dissolution time (MDT)[20] was calculated using the following equation:
MDT = (n/n+1). K-1/n
where n = release exponent and k = release rate constant
To evaluate and compare the dissolution data, the dissolution profile was statistically analyzed using the dissolution similarity factor ƒ2[19]. The equation for calculating ƒ2 is given below.
![]()
where, n = numbers of dissolution time point
Wt = optional weight factor
Rt = reference dissolution point at time t
Tt = test dissolution point at time t
The ƒ2 value between 50 and 100 suggests that the dissolution is similar. The ƒ2 values of 100 suggest that the test and reference profile are identical and, as the value becomes smaller, the dissimilarity between the release profiles increases.
Scanning electron microscopy
Electron micrographs of metformin hydrochloride matrix tablets before and after dissolution were obtained using a scanning electron microscope (model JSM T200, Joel Ltd., Tokyo, Japan). The specimens were coated under vacuum with gold in an argon atmosphere prior to observation. The scanning electron microscope was operated at an acceleration voltage of 30 kV.
Statistical analysis
The data was subjected to two-way ANOVA followed by Bonferroni post test for analyzing the statistical difference using the software Graph pad prism (San Diego, CA, USA) and, in all the cases, P <0.001 was considered as significant.
RESULTS
Study of physical interaction between drug and polymer
FTIR studies revealed that metformin hydrochloride showed two typical bands at 3369 and 3296 cm-1 due to N-H primary stretching vibration and a band at 3170 cm-1 due to N-H secondary stretching, and characteristics bands at 1626 and 1567 cm-1 assigned to C=N stretching. No significant shifts of reduction in intensity of the FTIR bands of metformin hydrochloride were observed, as shown in Figure 1.
Figure 1.
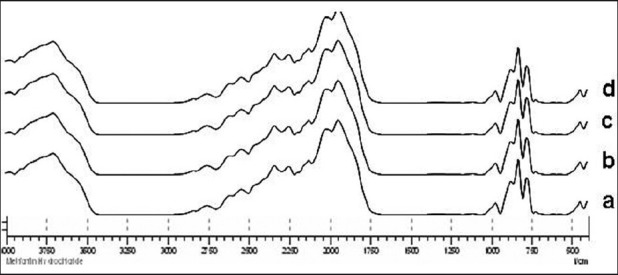
FTIR spectra of pure metformin hydrochloride (a) and binary physical mixtures of metformin hydrochloride with hydroxylpropylmethylcellulose (HPMC) K100M (b) and with xanthan gum (c). Ternary physical mixtures of drug with HPMC K100 M and xanthan gum (d)
DSC analyses were performed in order to evaluate possible solid-state interactions between the components and, consequently, to assess the actual drug–excipient compatibility in all the examined formulations. The thermal curves of pure components and those of some representative ternary systems are shown in Figure 2.
Figure 2.
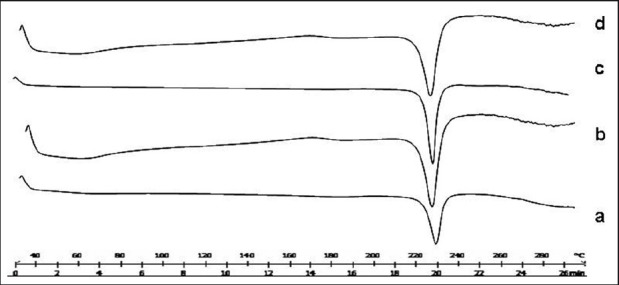
DSC of pure metformin hydrochloride (a) and binary physical mixtures of metformin hydrochloride with hydroxylpropylmethylcellulose (HPMC) K100M (b) and with xanthan gum (c). Ternary physical mixtures of drug with HPMC K100M and xanthan gum (d)
Tablet characteristics
The tablet hardness, thickness, weight variations and friability for each formulation are presented in Table 2. Friability value of all formulations and commercial tablets was less than 1%. The average percentage deviation of all tablet formulations was found to be within the above limit as per the official pharmacopeia requirements. The manufactured tablets showed high weight variations and batch F4, F5 and F7 failed in weight variation. A high degree of drug content uniformity among different batches of the tablets was found, and drug content was more than 95%.
Table 2.
Physical properties of the matrix tablets containing 500 mg metformin hydrochloride as a sustained-release formulation

Drug release studies
The results of dissolution studies as shown in Table 3 indicate that formulations F1, F2 and F3 released 47.9, 29.6 and 23.7% of drug after 2 h and 98.7, 97.4 and 96.6% of drug after 10 h. Formulations containing Guar gum, F4 and F5, released 51.77, 45.45% and 96.13, 93.80% of drug, respectively, after 2 and 8 h. The dissolution profile of metformin tablets containing combinations of a hydrophilic polymer HPMC with Xanthan gum in the different polymer/polymer ratio (75:25, 50:50 and 25:75, respectively) while keeping the total polymer ratio 20% are shown in Figure 3. Formulations F6, F7 and F8 released 45.65, 26.84 and 26.93% of the drug, respectively, after 2 h and 96.32, 96.5 and 90.8% of the drug, respectively, after 12 h. Marketed formulation Glycomet SR showed 28.50% at 2 h and 96.52% at 12 h.
Table 3.
In vitro drug release data of the matrix tablets of Metformin hydrochloride

Figure 3.
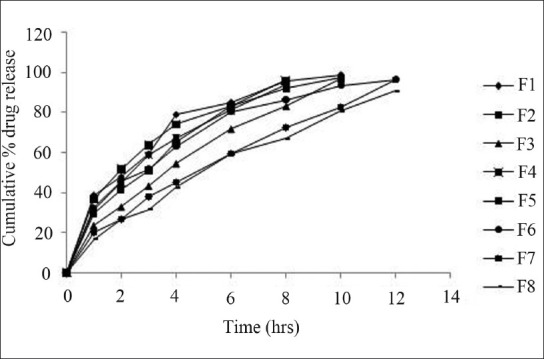
In vitro cumulative release of metformin HCl from batches F1 to F8. Each point represents the mean ± SD, n = 3
Release kinetics
To describe the kinetics of drug release from the matrix tablets, release data was analyzed according to different kinetic equations. The data were analyzed by the regression coefficient method, and regression coefficient value (r2) of all the batches are shown in Table 4. The in vitro release profiles of drug from all these formulations could be best expressed by Higuchi's equation as the plots showed highest linearity (r2 = 0.98–0.99) [Figure 4]. To confirm the diffusion mechanism, the data were fitted into Korsmeyer-Peppas equation. The formulations showed good linearity (r2 = 0.98–0.99), with slope (n) between 0.437 and 0.690 [Figure 5].
Table 4.
In vitro release kinetics parameters of metformin hydrochloride from the matrix tablet

Figure 4.
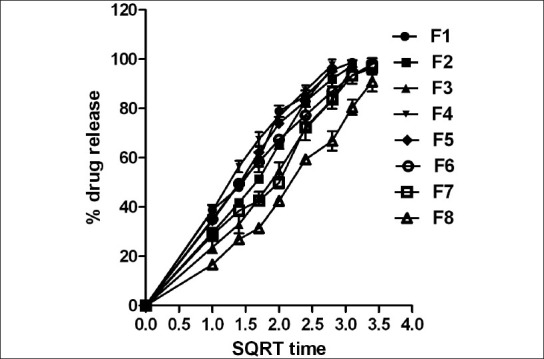
Higuchi (square root) kinetics (cumulative percent drug released vs. square root of time). SQRT indicates square root.
Figure 5.
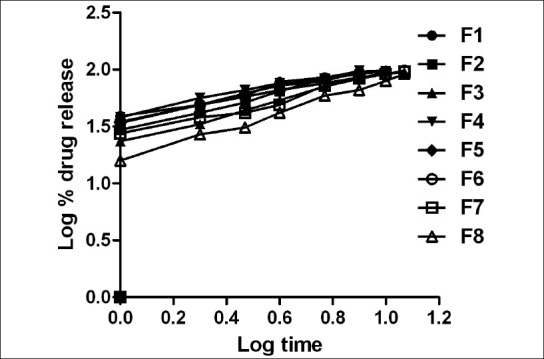
Kosermeyer kinetics (log cumulative percent drug released vs. log of time)
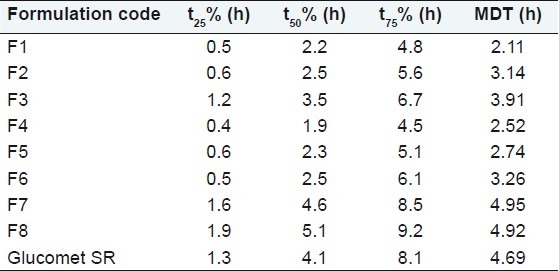
The time taken to release 25% (t25), 50% (t50) and 75% (t75) of the drug from different formulations was determined [Table 5]. Marketed formulation Glycomet SR when compared with F5, the ƒ2 value was found to be 59.32.
Table 5.
Dissolution parameters of sustained metformin hydrochloride matrix tablets
The SEM images of the tablet were taken before and after dissolution, as shown in Figure 6.
Figure 6.
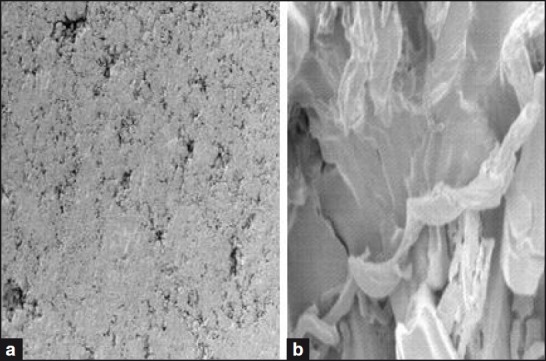
Scanning electron microscopy image before (a) and after dissolution (b)
Statistical analysis
The data were subjected to two-way ANOVA followed by Bonferroni post test for analyzing the statistical difference using the software Graph pad prism.
DISCUSSION
Study of physical interaction between drug and polymer
No significant shifts of reduction in intensity of the FTIR bands of metformin hydrochloride were observed.
The DSC curve of pure Metformin exhibited an initially flat profile, followed by a single sharp endothermic peak representing the melting of the substance in the range 223–237°C (Tonset = 231.2, Tpeak = 233.33 and ΔHfusion = -313.51 J/g). The thermal curves of both binary and ternary mixtures, obtained by simple blending, corresponded to the superimposition of those of the single components, indicating the absence of solid state interactions and allowing assessment of drug–polymers compatibility in all the examined formulations. As a further confirmation of the absence of any incompatibility problem, no variations in the thermal behavior of samples of binary and ternary combinations were observed after their tabletting and subsequent powdering. Thus, no definite solid–solid interaction could be concluded for examination of all the DSC thermograms.
Tablet characteristics
All the tablets of different formulations showed acceptable results with respect to drug content uniformity. In determinations of tablet weights, all formulations except F4, F5 and F7 were found to be within pharmacopoeia limits. A plain punch with the same radius each time was used for all formulations in tablet pressing, and the differences in tablet radius were not significant (P<0.05). Friability of the tablet was well within the acceptable range of 1%, and indicated that tablet surfaces were strong enough to withstand mechanical shock or attrition during storage and transportation and until they were consumed.[21] The manufactured tablets showed high weight variations and a high degree of drug content uniformity among different batches of the tablets, and drug content was more than 95%.
Drug release studies
The results as shown in Figure 3 indicate that the release rate decreased as the concentration of HPMC K100M increased. At higher polymer loading, the viscosity of the gel matrix was increased, which resulted in a decrease in the effective diffusion coefficient of the drug,[22] and was more likely to be resistant to drug diffusion and erosion.[23] This indicates that the drug/polymer ratio is an important factor affecting the rate of release of drugs from HPMC matrices Factors that may contribute to differences in the drug dissolution profile as a function of changes in total polymer concentration include differences in water penetration rate, water absorption capacity and polymer swelling.[24]
Formulations formed with Guar gum showed an initial burst release and slow drug release with increasing concentration of polymer, which may be due to the formation of a thick gel layer with increasing viscosity around the tablets by quick hydration of XG matrices. In the formulation containing a combination of polymers, when HPMC K100M is replaced by the Guar gum, a decrease in the drug release was, observed which clearly indicates that increasing the concentration of Guar gum in the matrix alters the drug release profile significantly.
Drug release kinetics
On analyzing regression coefficient values of all batches, it was found that formulation F1, F2 and F5 exhibit Higuchis release kinetics [Figure 4], whereas batch F3, F4, F6, F7 and F8 followed the Kosermeyr-Peppas model [Figure 5]. The data fitted into the Korsmeyer-Peppas equation appears to indicate a coupling of diffusion and erosion mechanisms – so-called anomalous diffusion.
The MDT value is used to characterize the drug release rate from a dosage form, and indicates the drug release-retarding efficiency of the polymer. Comparing the MDT of tablets with double combination of polymers with a two-way ANOVA test showed that the type of the combination of two polymers, the ratio of the two polymers and also their interaction effects had a main effect on the MDT (P < 0.05). This test shows that the combination of a Guar gum with HPMC leads to a greater MDT compared with the individual polymers, which clearly indicated the SR nature of the combination.
The time taken to release 25% (t25), 50% (t50) and 75% (t75) of the drug from different formulations clearly indicates the sustained behavior of the combination of polymers. ƒ2 value of 59.32 clearly suggests that the test and reference profile are identical.
SEM before dissolution [Figure 6a] showed intact surface without any perforations, channels or troughs. After dissolution, [Figure 6b] revealed many pores with increasing diameter. The solvent front enters the matrix and moves slowly toward the center of the tablet. The drug diffuses out of the matrix after it comes in contact with the dissolution medium, which clearly indicates the involvement of both erosion and diffusion mechanisms to be responsible for sustaining the release of metformin from the formulated matrix tablets.
Statistical analysis
The data were subjected to two-way ANOVA followed by Bonferroni post test and, in all the cases, P <0.001 was considered as significant. Based on the dissolution profiles of various tablet formulations, an inverse relationship between the amount of polymer present and the released rate of the drug was observed: by increasing the concentration of the polymer within the formulations, a slower rate and significant (P < 0.001) decrease in the amount of drug release from different tablet formulations was noted.
CONCLUSIONS
The findings of the present study demonstrate that the hydrophilic matrix of HPMC alone could not control the Metformin HCl release effectively for 12 h, whereas, when combined with Guar gum, it could slow down the release of the drug from their matrices and can therefore be successfully employed for formulating SR matrix tablets. Diffusion coupled with erosion might be the mechanism for the drug release, which can be expected to reduce the frequency of administration and decrease the dose-dependent side-effects associated with repeated administration of conventional metformin HCl tablets.
ACKNOWLEDGMENTS
The authors are thankful to Vama Pharmaceuticals, Nagpur, India, for providing Metformin HCl as a gift sample and S.K.B. College of Pharmacy, Kamptee, Nagpur, India, for providing the necessary facilities to carry out this work.
Footnotes
Source of Support: Nil.
Conflict of Interest: None declared.
REFERENCES
- 1.Merkus FW. Controlled and rate-controlled drug delivery: Principal characteristics, possibilities and limitations. In: Struyker-Boudier HA, editor. Rate-controlled drug administration and action. FL, USA: CRC Press; 1986. pp. 15–47. [Google Scholar]
- 2.Colombo R, Bettini P, Santi P, Peppas NA. Swellable matrices for controlled drug delivery: Gel-layer behavior, mechanisms and optimal performance. Pharm Sci Technolo Today. 2000;3:198–204. doi: 10.1016/s1461-5347(00)00269-8. [DOI] [PubMed] [Google Scholar]
- 3.Alderman DA. A review of cellulose ethers in hydrophilic matrices of oral controlled release dosage forms. Int J Pharm. 1984;5:1–9. [Google Scholar]
- 4.Yan G, Li H, Zhang R, Ding H. Preparation and evaluation of a sustained-release formulation of Nifedipine HPMC tablets. Drug Dev Ind Pharm. 2000;26:681–6. doi: 10.1081/ddc-100101284. [DOI] [PubMed] [Google Scholar]
- 5.Siepmann J, Kranz H, Bodmeier R, Peppas NA. HPMC-matrices for controlled drug delivery: A new model combining diffusion, swelling, and dissolution mechanisms and predicting the release kinetics. Pharm Res. 1999;16:1748–56. doi: 10.1023/a:1018914301328. [DOI] [PubMed] [Google Scholar]
- 6.Krishnaiah YS, Karthikeyan RS, Gouri Sankar V, Satyanarayana V. Three-layer guar gum matrix tablet formulations for oral controlled delivery of highly soluble trimetazidine dihydrochloride. J Control Release. 2002;81:45–56. doi: 10.1016/s0168-3659(02)00031-7. [DOI] [PubMed] [Google Scholar]
- 7.Khullar P, Khar RK, Agarwal SP. Evaluation of guar gum in the preparation of sustained-release matrix tablets. Drug Dev Ind Pharm. 1998;24:1095–9. doi: 10.3109/03639049809089955. [DOI] [PubMed] [Google Scholar]
- 8.Bonferoni MC, Caramella C, Sangalli ME, Conte U, Pedraz JL. Rheological behaviour of hydrophilic polymers and drug release from erodible matrices. J Control Release. 1992;18:205–212. [Google Scholar]
- 9.Kurahashi H, Kami H, Sunada H. Influence of physicochemical properties on drug release rate from hydroxypropyl methylcellulose matrix tablets. Chem Pharm Bull (Tokyo) 1996;44:829–32. [Google Scholar]
- 10.Nathan DM, Buse JB, Davidson MB, Ferrannini E, Holman RR, Sherwin R, et al. Medical management of hyperglycemia in type 2 diabetes: A consensus algorithm for the initiation and adjustment of therapy: A consensus statement of the American Diabetes Association and the European Association for the Study of Diabetes. Diabetes Care. 2009;32:193–203. doi: 10.2337/dc08-9025. [DOI] [PMC free article] [PubMed] [Google Scholar]
- 11.Holman RR, Paul SK, Bethel MA, Matthews DR, Neil HA. 10-year follow up of intensive glucose control in type 2 diabetes. N Engl J Med. 2008;359:1577–89. doi: 10.1056/NEJMoa0806470. [DOI] [PubMed] [Google Scholar]
- 12.Dunn CJ, Peters DH. Metformin: A review of its pharmacological properties and therapeutic use in non-insulin-dependent diabetes mellitus. Drugs. 1995;49:721–49. doi: 10.2165/00003495-199549050-00007. [DOI] [PubMed] [Google Scholar]
- 13.Defang O, Shufang N, Wei L, Hong G, Hui L, Weisan P. In vitro and in vivo evaluation of two extended release preparations of combination metformin and glipizide. Drug Dev Ind Pharm. 2005;31:677–85. doi: 10.1080/03639040500216410. [DOI] [PubMed] [Google Scholar]
- 14.Stepensky D, Friedman M, Srour W, Raz I, Hoffman A. Preclinical evaluation of pharmacokinetic-pharmacodynamicrationale for oral CR metformin formulation. J Control Release. 2001;71:107–15. doi: 10.1016/s0168-3659(00)00374-6. [DOI] [PubMed] [Google Scholar]
- 15.Martin A. Philadelphia, PA: Lippincott Williams and Wilkins; 2001. Micromeritics: Physical Pharmacy; pp. 423–54. [Google Scholar]
- 16.Wells J. Pharmaceutical preformulation: The physiochemical properties of drug substances. In: Aulton ME, editor. Pharmaceutics the science of dosage form design. London: Churchill Livingstone; 2002. p. 247. [Google Scholar]
- 17.Higuchi T. Mechanism of sustained-action medication: Theoretical analysis of rate of release of solid drugs dispersed in solid matrices. J Pharm Sci. 1963;52:1145–9. doi: 10.1002/jps.2600521210. [DOI] [PubMed] [Google Scholar]
- 18.Korsmeyer RW, Gurny R, Peppas NA. Mechanisms of solute release from porous hydrophilic polymers. Int J Pharm. 1983;15:25–35. [Google Scholar]
- 19.Costa P, Sousa Lobo JM. Modeling and comparison of dissolution profiles. Eur J Pharm Sci. 2001;13:123–33. doi: 10.1016/s0928-0987(01)00095-1. [DOI] [PubMed] [Google Scholar]
- 20.Gohel MC, Panchal MK. Novel use of similarity factors f2 and sd for the development of diltiazem HCl modified-release tablets using a 3(2) factorial design. Drug Dev Ind Pharm. 2002;28:77–87. doi: 10.1081/ddc-120001488. [DOI] [PubMed] [Google Scholar]
- 21.Banker GS, Ander LR. Tablets. In: Lachman L, Liberman HA, Kanig JL, editors. The theory and practice of industrial pharmacy. Mumbai: Varghese Publishing House; 1987. pp. 293–345. [Google Scholar]
- 22.Skoug JW, Mikelsons MV, Vigneron CN, Stemm NL. Qualitative evaluation of the mechanism of release of matrix sustained release dosage forms by measurement of polymer release. J Control Release. 1993;27:227–45. [Google Scholar]
- 23.Lee PI, Peppas NA. Prediction of polymer dissolution in swellable controlled-release systems. J Control Release. 1987;6:207–15. [Google Scholar]
- 24.Wan LS, Heng PW, Wong LF. Relationship between swelling and drug release in a hydrophilic matrix. Drug Dev Ind Pharm. 1993;19:1201–10. [Google Scholar]


