Abstract
The high sensitivity of electron energy loss spectroscopy (EELS) for detecting light elements at the nanoscale makes it a valuable technique for application to biological systems. In particular, EELS provides quantitative information about elemental distributions within subcellular compartments, specific atoms bound to individual macromolecular assemblies, and the composition of bionanoparticles. The EELS data can be acquired either in the fixed beam energy-filtered transmission electron microscope (EFTEM) or in the scanning transmission electron microscope (STEM), and recent progress in the development of both approaches has greatly expanded the range of applications for EELS analysis. Near single atom sensitivity is now achievable for certain elements bound to isolated macromolecules, and it becomes possible to obtain three-dimensional compositional distributions from sectioned cells through EFTEM tomography.
Keywords: Electron energy loss spectroscopy, energy filtering transmission electron microscope, scanning transmission electron microscope, elemental mapping, hyperspectral imaging, electron tomography, cell biology, bionanoparticles
Introduction
Rapid advances in electron energy loss spectroscopy (EELS) and energy-filtered transmission electron microscopy (EFTEM) over the past decade enable the determination of compositional information from inorganic materials at atomic resolution and analytical sensitivity.1–3 These developments include efficient detectors, stable spectrometers, aberration correctors, as well as efficient algorithms for acquiring and processing the resulting spectra and images. Many of the same advances have also greatly enhanced our ability to perform EELS on biological systems, which however present some different challenges to the researcher. Firstly, organic compounds in biological materials have a strong tendency to suffer ionization damage under electron irradiation, which alters the structure and composition.4 And secondly, the nature of biological specimens make it necessary to detect weak features in the energy loss spectrum, either because of the low concentration of an element of interest,5 or because of subtle variations in the spectrum due to changes in molecular composition.6
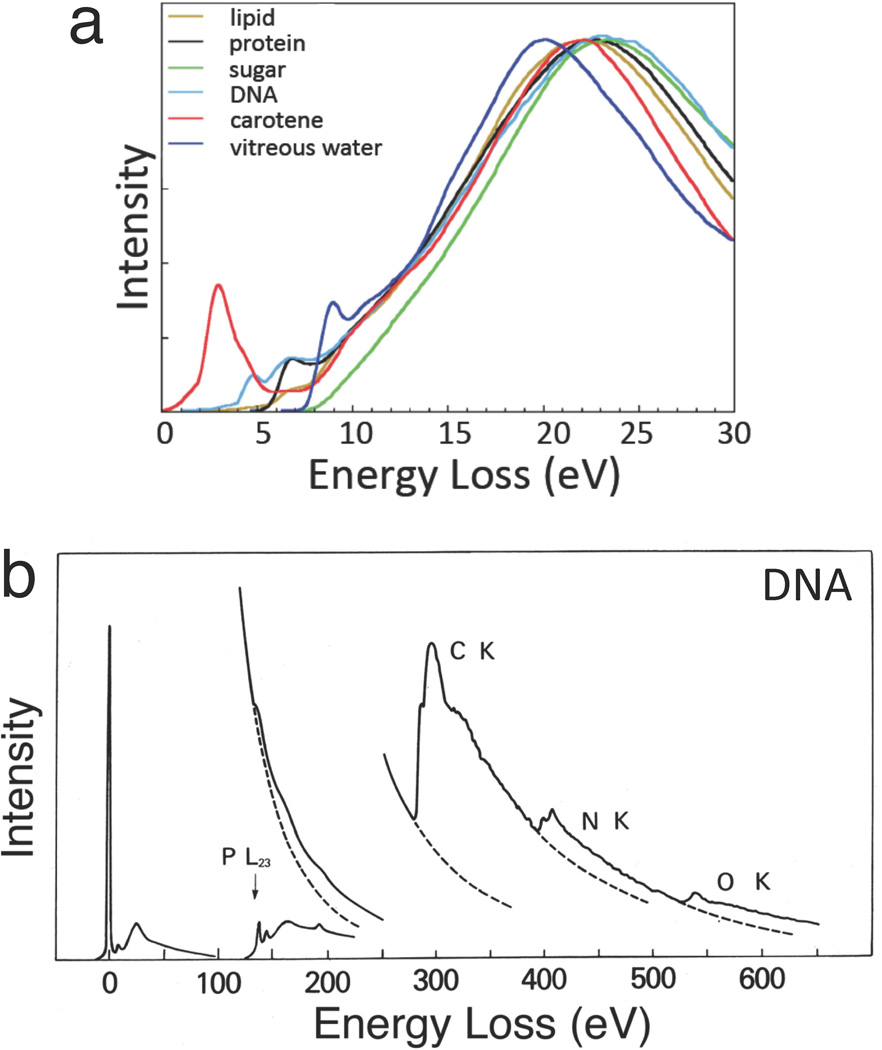
Information about the composition of biological specimens can be found throughout the electron energy loss spectrum. The low loss spectrum (0–20 eV) contains fine structure arising from excitations of molecular energy levels, which can be used to estimate the relative amounts of water, proteins, nucleic acids, sugars and other components in frozen hydrated preparations (Figure 1a).7 Due to beam damage, this type of chemical information can only be determined on scales of around 50 nm or greater. The low loss spectrum also provides a simple way of determining the specimen mass per unit area by measuring the fraction of transmitted electrons that have not been inelastically scattered.8 It is then possible to combine this measurement with EELS to determine the mass of a specific element per unit area and thereby calculate the elemental concentration, which in the case of cellular structures is often expressed in units of moles per liter of water, or moles per kilogram total mass.
Figure 1.
Typical electron energy loss spectra (EELS) from biological compounds. (a) Low-loss spectra up to energy loss of 30 eV from major cellular components after processing to remove plural inelastic scattering (from Reference 7). (b) EELS up to energy loss of 650 eV from DNA deposited on a thin carbon film, showing core edges of phosphorus, carbon, nitrogen and oxygen.
Signals from core edges provide quantitative information about a range of endogenous elements within biological structures. For example, phosphorus (L2,3 edge at 132 eV) reveals phosphate groups in nucleic acids or attached to phosphorylated proteins (Figure 1b).9–13 Sulfur (L2,3 edge at 165 eV) indicates the presence of proteins that are rich in cysteine or methionine residues, or sulfate groups attached to carbohydrates.14 The ratios of the major constituents of organic molecules (C, N and O) can be quantified by analyzing their K edges at 285eV, 532 eV and 400 eV, respectively, which provides additional compositional information.15 Certain metal atoms occurring in biological specimens are detectable by sharp resonances (white-lines) at their EELS core edges, e.g., the calcium L2,3 edge at 348 eV,5,16 and the iron L2,3 edge at 707 eV.17 Calcium is a particularly important element, which is involved in regulation of numerous cellular processes, and is referred to as a ‘second messenger’ because chemical or electrical signals from the environment outside the cell are transmitted into calcium signals within the cell’s cytoplasm. The concentration of calcium in cellular compartments is typically a few millimoles per kg dry weight, corresponding to just tens of atomic parts per million. Shuman and Somlyo’s pioneering work in the 1980s to develop a prototype EELS parallel detector,18 for measurement of trace levels of calcium eventually led to commercial EELS systems with subsequent benefit to the wider scientific community including materials scientists.19
EELS can also be applied to detect exogenous elements like cadmium and selenium in quantum dots, which have been developed as subcellular optical imaging probes,20 or metals like gadolinium used for medical imaging.21 There is growing interest in developing the field of nanomedicine and theranostics, including bio-nanomaterials that combine therapeutic and diagnostic imaging capabilities, such as hybrid nanoparticles containing inorganic and organic components. EELS and EFTEM are proving valuable techniques for analyzing such materials.
As in the case of the valence electron energy loss spectrum, fine structure at the K edges of carbon, nitrogen and oxygen also provides chemical fingerprints of biological molecules such as bases in nucleic acids and amino acids in proteins.6 In practice it has been difficult to exploit this information due to radiation damage. EELS can be valuable for understanding radiation damage phenomena in biological/organic materials – knowledge that is potentially relevant to fundamental limits of cryo-electron microscopy in the field of structural biology. For example, it has been possible to characterize the composition of bubbles released on irradiation of frozen-hydrated biological samples in the electron microscope, and to discover that these bubbles are composed of molecular hydrogen gas, which is evident by the appearance of the hydrogen K edge at 13 eV.22 Other studies have elucidated the fate of oxygen on irradiation of frozen hydrated organic specimens.23
The purpose of this review is to describe EELS and EFTEM techniques for analyzing biological materials and to illustrate these capabilities by means of some applications. We also discuss the issue of detection limits and indicate some possible future directions for research.
STEM-EELS versus EFTEM
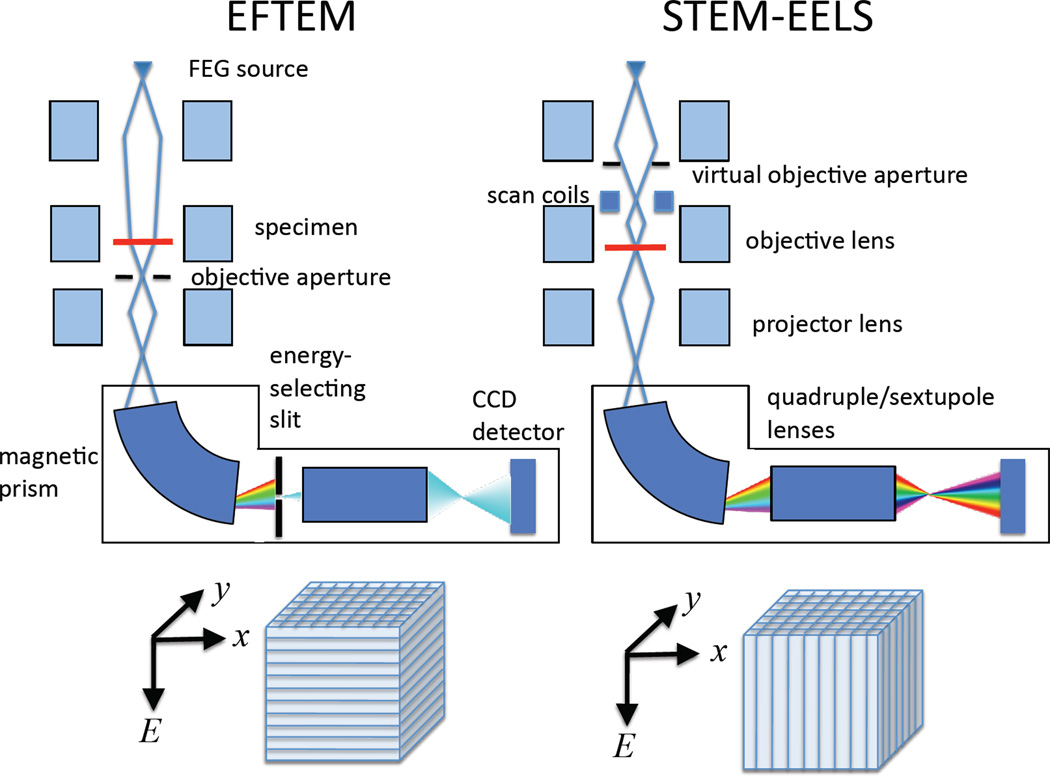
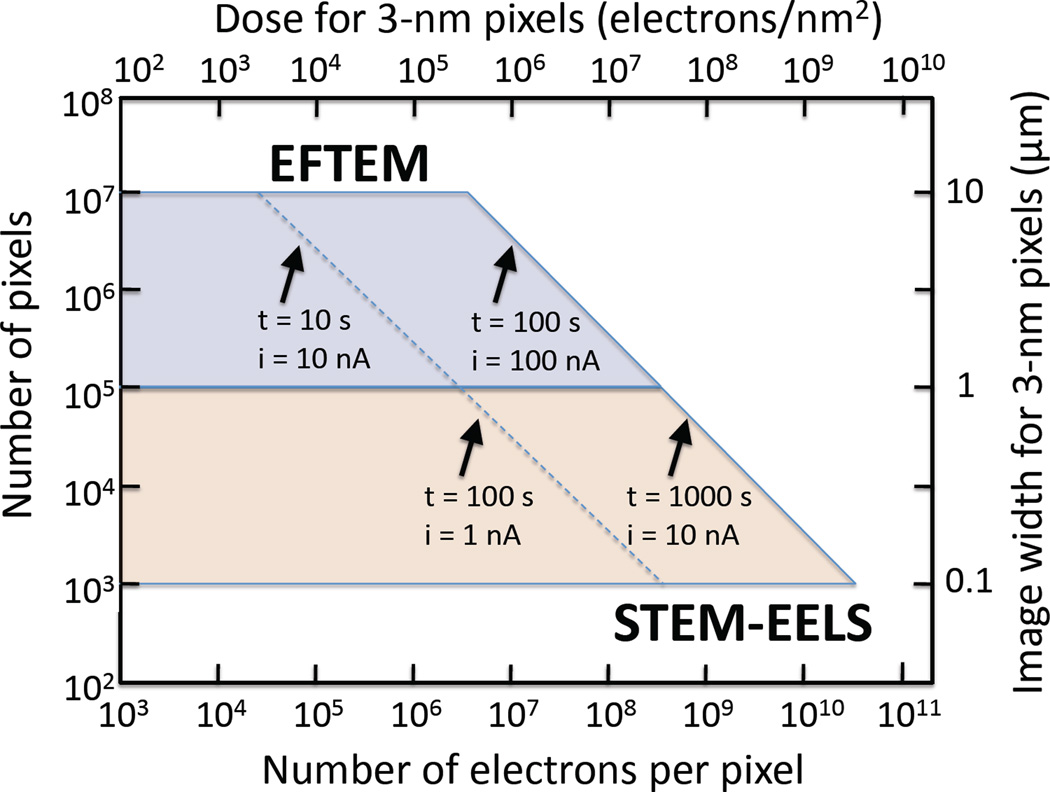
The complexity of biological systems manifests itself by many different types of organelles or supramolecular assemblies existing within a cell, so that particular structures of interest are often sparsely distributed. In general, it is necessary to analyze relatively wide areas, covering (say) entire sections through cells of dimensions 5 or 10 µm (Figure 2). Moreover, there tends to be a natural variability in composition of an organelle of a given type due also to the complexity of the physiological processes that occur within cells. This necessitates analysis of many structures to obtain statistically significant quantitative data about their elemental or chemical composition, and to determine how that composition changes when physiological conditions are altered. The EFTEM mode of acquiring EELS data satisfies this requirement of allowing large regions to be analyzed but there is a trade-off due to the restricted spectral information that is available in the EFTEM.9,24 For certain applications, it is essential to employ the high efficiency of the STEM-EELS imaging mode, whereby a focused probe is scanned across the specimen and multichannel spectra are collected at each pixel in a hyperspectral image.25,26 The focusing of a nanoampere current into a nanometer diameter probe requires a high-brightness field-emission source. Use of the STEM-EELS mode is essential when radiation damage is the limiting factor, as for imaging chemical composition such as water and protein content.7 Similarly, when the total number of incident electrons per unit area is the limiting factor, e.g., for detecting trace concentrations of calcium, the STEM-EELS acquisition mode is also essential.5,16 Figure 3 compares the microscope configurations for the EFTEM and STEM-EELS modes and shows how the three-dimensional spectrum-image data are accumulated. There is clearly a limit to the maximum area that can be analyzed by scanning the probe and reading out the signal at each pixel. Typically, a STEM-EELS image contains of the order of 100 × 100 pixels, which corresponds to an acquisition time of around 1000 s for a read-out time of 100 ms per spectrum. Before selecting the optimal acquisition mode for a particular application, it is useful to consider the total number of pixels and the numbers of incident electrons per pixel that are accessible for the EFTEM and STEM-EELS imaging techniques. Such a plot is presented in Figure 4, which shows the complementarity of the two techniques: EFTEM typically provides image sizes of between 105 and 107 pixels, depending on the binning factor selected for the CCD camera; and STEM-EELS provides images sizes of between 103 and 105 pixels. For a 3-nm pixel size this corresponds image widths between 1 to 10 µm for EFTEM and between 0.1 and 1 µm for STEM-EELS.
Figure 2.
Different length scales for EELS analysis of biological structures in the range from tens of micrometers to nanometers, which includes cells, organelles, viruses, and large protein assemblies.
Figure 3.
A comparison of techniques for compositional imaging in a transmission electron microscope capable of operating in the energy filtering transmission electron microscope (EFTEM) mode, and in the scanning transmission electron microscope (STEM) mode together with an electron energy loss spectrometer. The instrument shown is equipped with a post-column imaging filter, although an in-column filter can also be used. To perform EFTEM images covering a window of energy losses defined by the energy-selecting slit, are collected in parallel on a CCD camera. In STEM-EELS the energy-selecting slit is removed and a spectrum is collected in parallel at each pixel successively in a raster-scanned image. The three-dimensional (x, y, E) data sets are built up as shown.
Figure 4.
Comparison of compositional imaging using EFTEM and STEM-EELS imaging modes, showing the availability of total numbers of pixels and numbers of incident electrons per pixel. Examples of total acquisition times and beam or probe currents are indicated by diagonal lines. The total image width for 3-nm pixels is shown on the right vertical axis, and the total electron dose for 3-nm pixels is shown on the top horizontal axis. Note that for a given dose, the signal is always higher in STEM-EELS because the spectral information in EFTEM must be collected serially.
Application of EFTEM to Map Elements in Cells
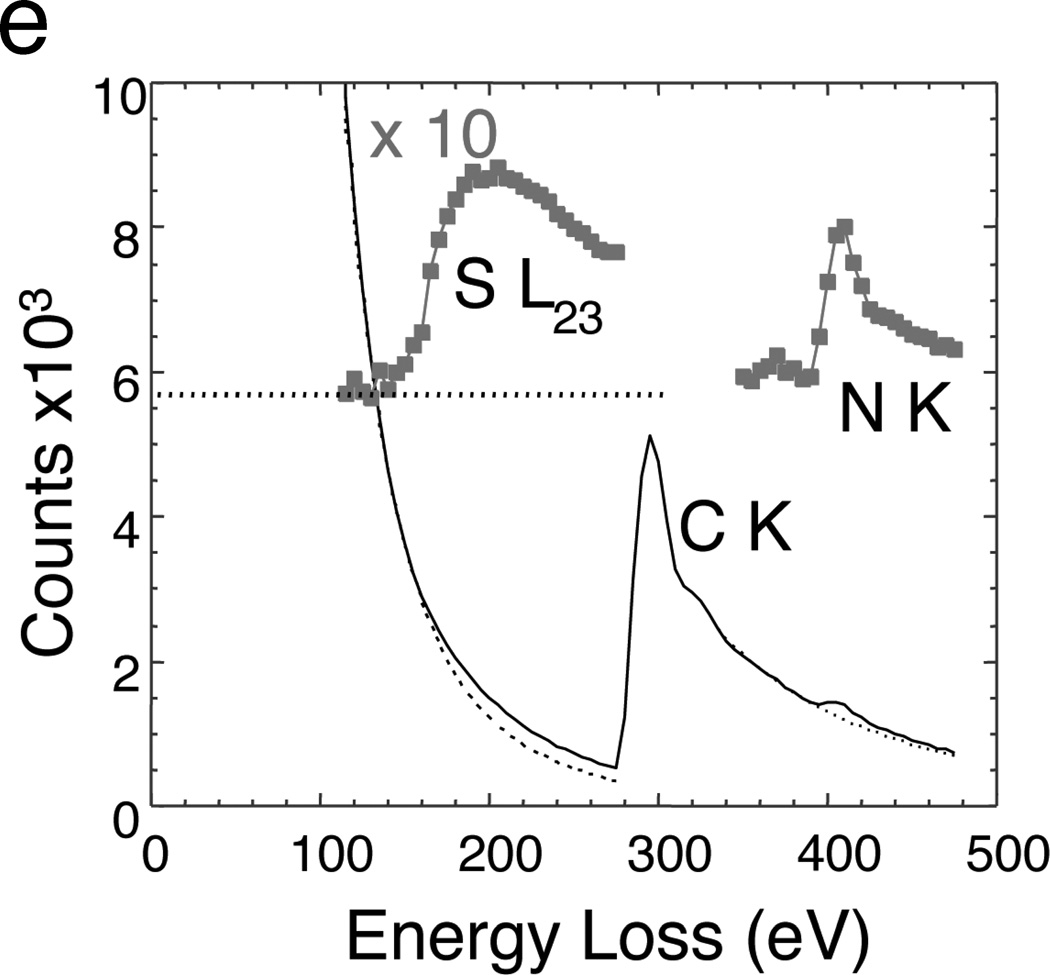
In principle, the most accurate method for obtaining quantitative elemental maps from large areas of sectioned cells is to acquire series of EFTEM images successively over a range of energy losses spanning several core edges. In this EFTEM spectrum-imaging mode the signal is limited by the width of the energy-selecting slit, which is usually set to the required energy increment in the spectrum-image. Such an approach is illustrated by mapping the composition of secretory cells in the pancreatic islet of Langerhans. Figure 5 shows phosphorus L2,3, sulfur L2,3 and nitrogen K maps from a region of a mouse islet that includes parts of an insulin-secreting beta cells and a glucagon secreting alpha cell.27 High levels of phosphorus (Figure 5a) are evident in the beta cell nucleus located at the top of the image, as expected from the high DNA content in the chromatin of nuclei. The granules in this insulin-secreting beta cell (right side of image) exhibit a high sulfur concentration (Figure 5b) consistent with the insulin polypeptide, which contains six cysteine amino acids. In contrast, no significant sulfur is evident in the granules of a glucagon-secreting alpha cell on the left side of the image, which is consistent with the much lower sulfur content of glucagon. Nitrogen, which serves as a general marker for protein, nucleic acid and other biomolecules, is observed at high concentration in both the alpha and beta granules, as well as in the nucleus (Figure 5c). An overlay of the phosphorus, sulfur and nitrogen (Figure 5d) shows the relationship between the different cellular components.27 The availability of extractable EELS data from EFTEM spectrum-images makes it possible to extrapolate the background reliably under the weak sulfur edge, as shown in Figure 5e, and thus allows us to quantify the composition of individual secretory granules. An average ratio of sulfur to nitrogen in the beta cell granules of 0.093 ± 0.015 (± st. dev.) was obtained, which is consistent with a nominal value of 0.097 based on the known chemical formula. It should be appreciated, however, that EFTEM collection of spectrum-image data is inherently inefficient because most of the inelastically scattered electrons are discarded by the energy-selecting slit. In general it is preferable to limit the number of EFTEM images acquired from beam sensitive materials.
Figure 5.
EFTEM spectrum-imaging of unstained epon-embedded section of pancreatic islet of Langerhans obtained with 5 eV energy loss increments over a 400 eV energy range (from Reference 27). (a) Phosphorus L2,3 edge image showing high P concentration in chromatin of cell nucleus. (b) Sulfur L2,3 edge image showing high concentration of S in secretory granules of insulin-producing beta cell, but low concentration of S in secretory granules of a neighboring glucagon-producing alpha cell. (c) Nitrogen K edge image showing a strong N signal in granules of both cell types, as well as in the beta cell nucleus. (d) Overlay of the elemental maps with P (red), S (blue), and N (green). (e) Extracted EELS spectrum from beta cell secretory granule illustrating how quantitative analysis can be performed to determine the atomic ratio of sulfur to nitrogen of 0.108:1.
Application of STEM-EELS to Map Chemical Composition
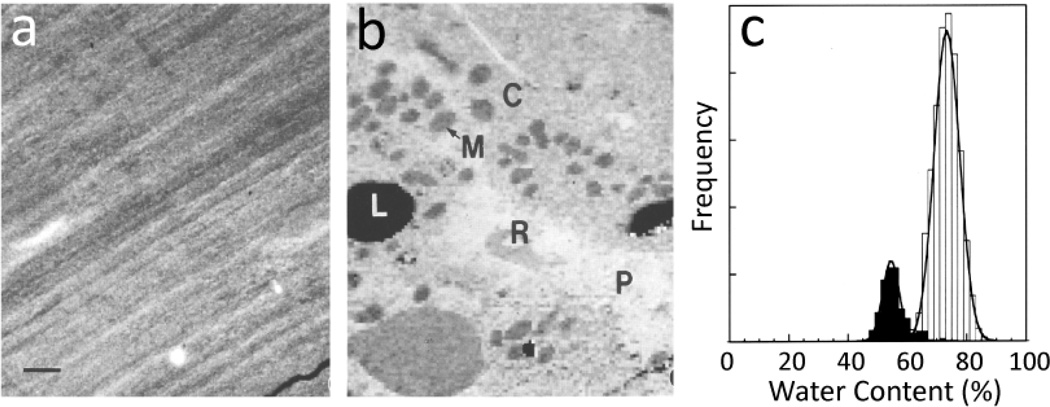
The radiation sensitivity of biological compounds and the subtle differences in EELS fine structure associated with compositional variations implies that mapping the distributions of biological compounds in cells requires highly efficient and precise collection of spectral data at each pixel in an image. The strongest EELS signal originates in the valence electron excitation spectrum (Figure 1a), which has to be acquired in parallel with a STEM-EELS approach. Figure 6 illustrates the use of valence EELS imaging to map the distributions of water and protein in a frozen hydrated cryosection of rat liver.7 The low-dose annular dark-field STEM image in Figure 6a shows only compression artifacts caused by the cutting process. After acquiring a 128×128 pixel STEM-EELS spectrum-image, then deriving single scattering distributions, and fitting reference spectra at each pixel using a least squares algorithm, it was possible to obtain the distribution of water and protein shown in Figure 6b. Features of the hepatocyte ultrastructure now become visible, including mitochrondria (M), cytoplasm (C), and lipid droplets (L), as well as a blood vessel containing plasma (P) and red blood cell (R). Quantitative water measurements of these compartments were obtained by normalizing the single scattering reference spectra to the respective total inelastic scattering cross sections for water and protein. This results in a water content of 75±3% for the cytoplasm, and 57±2% for the mitochondia. The total dose for the measurements was < 2 × 10³ electrons/nm2, and the pixel size was 80 nm. Low energy loss STEM-EELS has been applied successfully to map distributions of water across various cell layers in skin tissues.28,29
Figure 6.
Water mapping of frozen hydrated cryosection of rat hepatocytes obtained using a dedicated VG Microscope HB501 STEM equipped with a Gatan Model 666 EELS (from Reference 7). (a) Low dose-dark-field STEM image showing no contrast apart from compression lines due to sectioning; scale bar = 1µm. (b) Water map generated by multiple least squares fitting of water and protein reference spectra (see Figure 1a) revealing mitochondria (M) and cytoplasm (C), as well as a blood vessel containing plasma (P) and a red blood cell (R). (c) Analysis of regions of cytoplasm (light bars) and mitochondria (dark bars) showing water content of 75% and 57%, respectively.
Application of STEM-EELS for High-Sensitivity Elemental Mapping
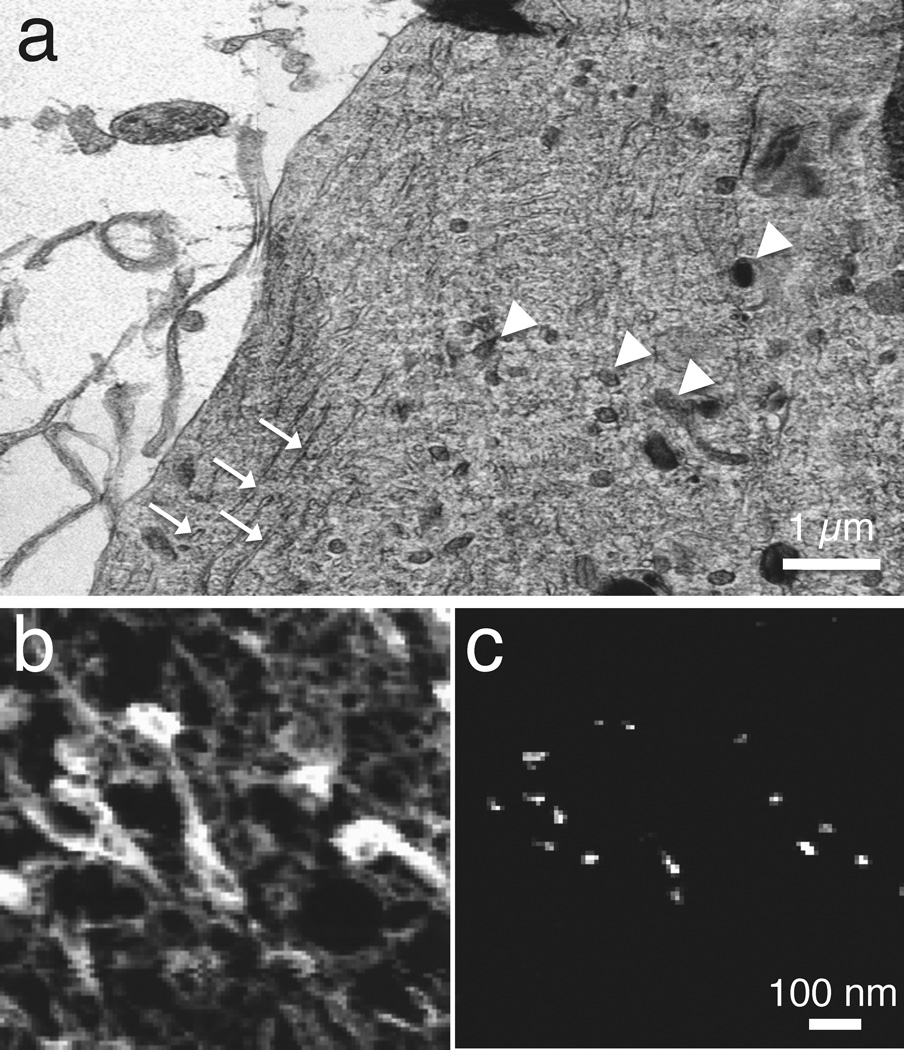
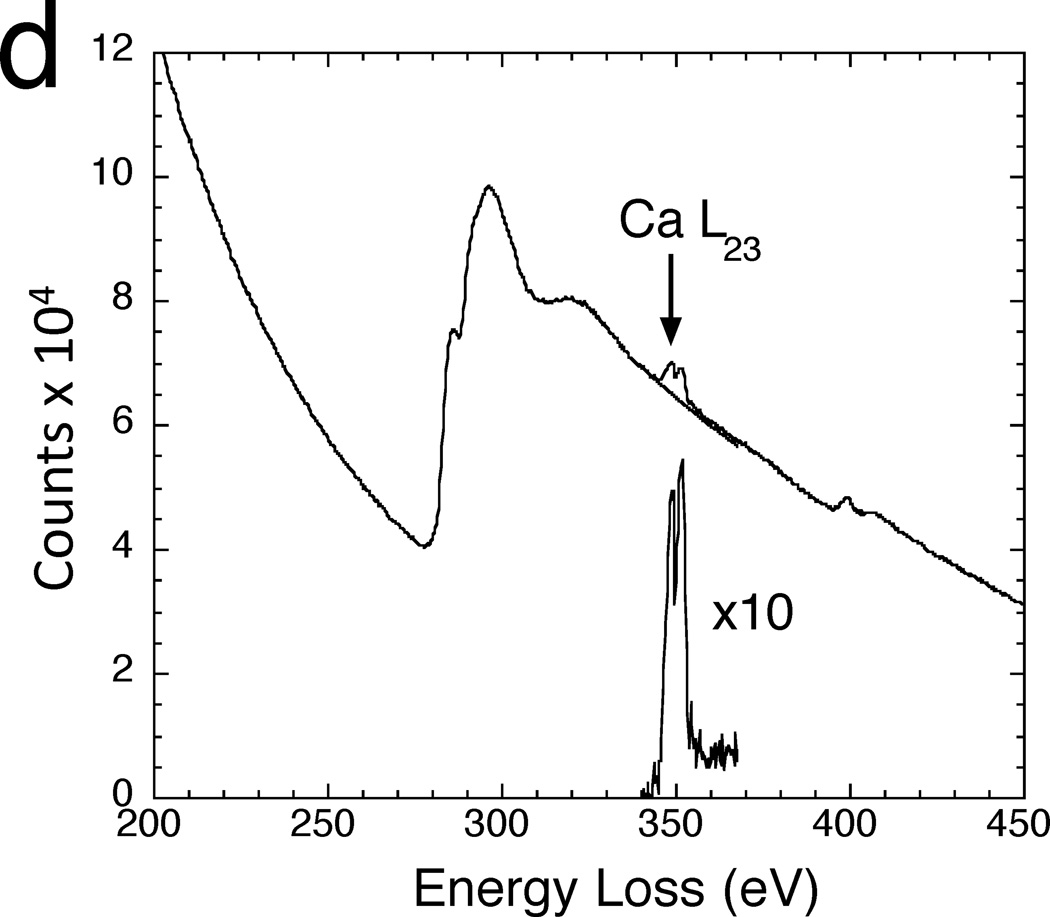
Mapping of elements that occur at low concentration, such as calcium, often requires delivery of more than 109 electrons into each pixel and, as evident from Figure 4, STEM-EELS has an important advantage for such applications.5,16 In addition, parallel collection of the spectrum in STEM-EELS enables precise modeling of the background, which is essential for reliable extraction of weak signals. An example of the application of STEM-EELS to measure subcellular calcium is a study on the role that different organelles play in buffering calcium in neurons that have undergone stimulation by depolarization of their plasma membranes.30 A dehydrated cryosectioned frog sympathetic neuron in Figure 7a reveals good preservation of structure including mitochondria and endoplasmic reticulum. Spectrum-images were collected with a beam voltage of 100 kV, an incident probe current of 1 nA and an acquisition time of 0.4s per pixel, from micrometer-sized region of the neuron.30 This resulted in the carbon K-edge and calcium L2,3 images, as shown in Figure 7b and Figure 7c, respectively. Focal concentrations of calcium are found to be associated with the mitochondria, implying a role for these organelles in buffering calcium under the specific physiological conditions of these isolated and cultured sympathetic neurons. The EELS data extracted from one such focal spot in Figure 7d shows how the background was fitted using an inverse power law and extrapolated into a 10-eV post-edge energy window that included the Ca L2,3 white-line resonance. The average mitochondrial calcium concentration was quantified, and showed a gradient with a decreasing concentration towards the center of the cell.30 EFTEM can also be used to map the distribution of calcium in dehydrated cryosectioned cells if care is taken to correct for plural inelastic scattering, which affects the shape of the background intensity underlying the calcium L2,3 edge.31 This is accomplished by recording the unfiltered image Itot and zero-loss image I0 and then calculating the relative thickness, t/λ = ln(Itot/I0) at each pixel. The shape of the core-edge background can be modeled as a function of relative thickness to provide a correction to the simple two-window calcium map, which is based on a constant ratio between the pre-edge background and the background at the Ca L2,3 edge. The limited number of incident electrons per pixel in EFTEM relative to that in STEM-EELS makes it necessary to average the Ca L2,3 signal over many pixels to detect low concentrations in EFTEM.
Figure 7.
STEM-EELS mapping of calcium in cultured frog sympathetic neuron (from Reference 30). (a) Low-dose dark-field STEM image (contrast inverted) showing preservation of membranes, endoplasmic reticulum (arrows) and mitochondria (arrowheads) in a freeze-dried cryosection. (b) Carbon K edge image from several mitochondria. (c) Calcium L2,3 edge image extracted from spectrum-image data. (d) EELS from calcium inclusion in mitochondrion showing extrapolation and subtraction of the background under the edge.
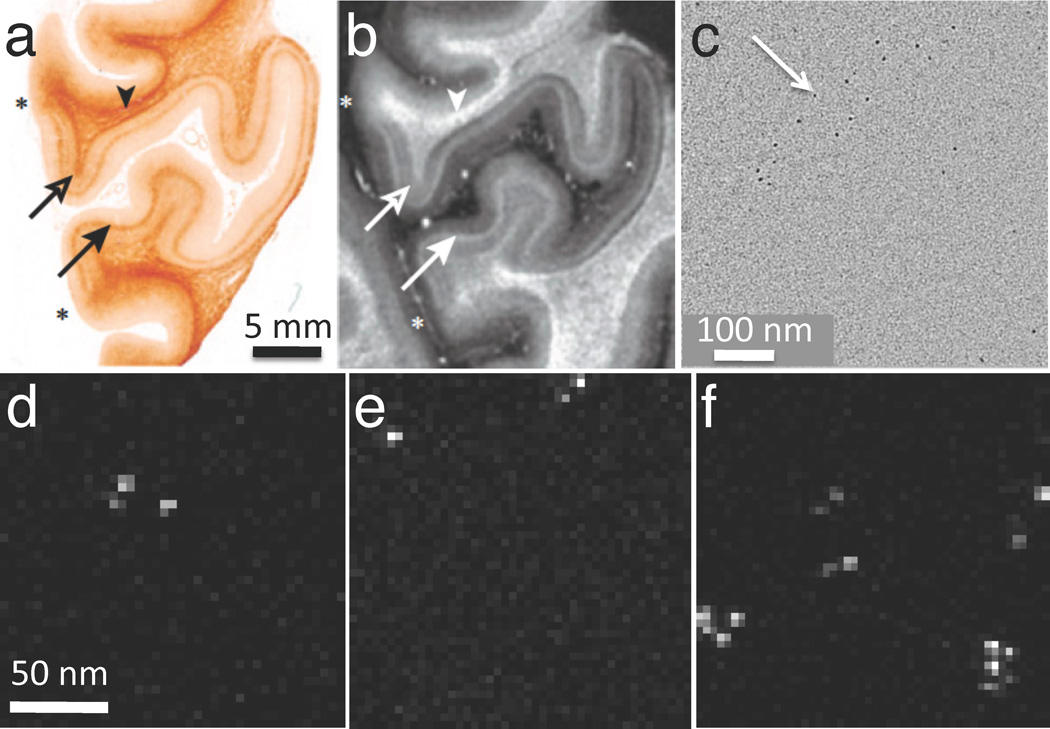
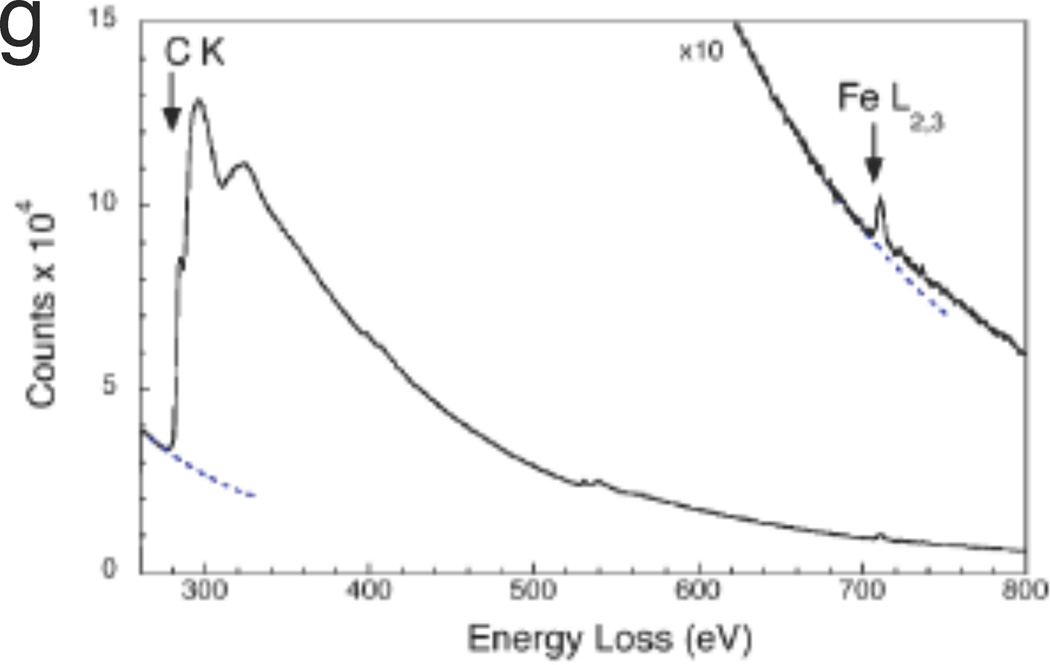
Another example in which STEM EELS has proven useful is for studying the distribution of superparamagnetic iron in human brain to determine whether this element contributes towards contrast in magnetic resonance imaging (MRI).32 Figure 8a shows a paraffin section of post-mortem human visual cortex stained for iron with Perls stain, and Figure 8b shows the corresponding R2* (spin-spin relaxation) MRI; both images show a strong band of contrast that is associated with a brain structure known as the line of Gennari. Regions of unstained visual cortex that included the line of Gennari were embedded in plastic and sectioned to a thickness of 100 nm. Phase-contrast TEM images (Figure 8c) showed clusters of particles with an approximate diameter of 5 nm. STEM-EELS spectrum-images (Figures 8d–f) collected from randomly selected areas revealed that these particles contained iron, as confirmed by spectra extracted from the particles (Figure 8g).32 A quantitative analysis of the iron in these particles showed that they contained 1740 ± 580 Fe atoms, which is consistent with the amount of iron expected in the molecular cores of the iron storage protein, ferritin. By counting the number of iron cores in each analyzed regions, it was found that there were 50 ± 4 µg and 16 ± 7 µg of iron per gram of tissue, respectively, in the line of Gennari and superficial regions of the visual cortex. These values are consistent with the observed contrast in the MRI images.32
Figure 8.
Application of STEM-EELS to explain contrast observed in brain magnetic resonance images (MRI) in terms of iron concentrations (from Reference 32). (a) Optical micrograph of post-mortem human visual cortex treated with Perl stain for iron, showing elevated iron in the region of the line of Gennari (arrows). (b) Corresponding R2* MRI, also showing contrast in the line of Gennari (arrows). (c) Phase-contrast TEM of unstained section in the region of the line of Gennari showing electron-dense particles. (d)–(f) STEM-EELS iron maps obtained from randomly selected areas of an unstained specimen in the vicinity of the line of Gennari, showing particles with high Fe content. (g) Typical EELS extracted from one of the Fe-containing particles reveals a strong Fe L2,3 edge, and quantitative analysis showed that the particles contained on average 1740 ± 580 Fe atoms, consistent with the iron cores of ferritin molecules.
Application to Nanomedicine
Recently, EELS has proven useful for analyzing bionanoparticles in the size range from about 1 to 100 nm, which are designed for medical diagnostic or therapeutic applications (i.e., in the field of nanomedicine). The technique can also be applied to analyze bionanoparticles that are created by incorporating multiple functional groups to provide both diagnostic and therapeutic functions together, i.e., ‘theranostic’ nanoparticles. EFTEM and STEM-EELS can be used both to localize bionanoparticles within cells and tissues, as well as to characterize the composition and substructure of the nanoparticles themselves. Since the localization of nanoparticles can often be achieved with standard TEM or STEM imaging techniques based on elastically scattered electrons, we focus here on the spectroscopic characterization of the nanoparticles themselves. The biological functions of such nanoparticles tend to depend strongly on their dimensions and, in the case of multiphase particles, on their architecture. A large fraction of a nanoparticle’s atoms can be situated at on the surface and therefore be chemically reactive, and quantum size effects can determine a nanoparticle’s physical properties, such as optical properties in the case of quantum dots. Until now only a few types of nanoparticles have been approved for routine use in humans or in clinical trials, e.g., liposomes containing the anticancer drug doxorubicin, and functionalized iron oxide particles for use in MRI imaging. However, there is also strong interest in other types of nanoparticles, which are not yet approved for medical use, including functionalized single walled carbon nanotubes, quantum dots, hybrid organic/inorganic nanoparticles, and dendrimers. Since the function of bionanoparticles depends critically on their dimensions (i.e., surface to volume ratio), it is important to assess their degree of monodispersity, i.e., the spread in the distributions of their size, shape, and chemical composition. In the electron microscope analysis of annular dark-field STEM images can provide the distribution of particle masses, whereas EFTEM or STEM-EELS provides the distribution of elemental or chemical composition.
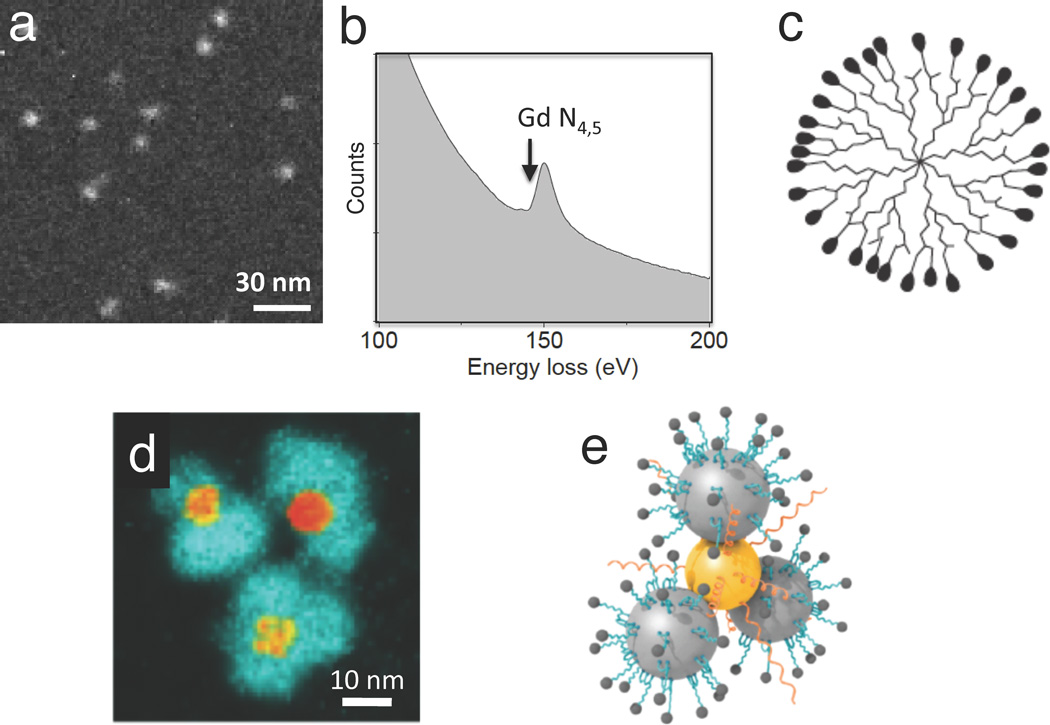
An example of a nanoparticle that has been used for MRI in animals is the polyamidoamine (PAMAM) dendrimer, which is conjugated to gadolinium diethylene triamine pentaacetic acid (Gd-DTPA), with the Gd atoms providing magnetic contrast. Dendrimers are branched macromolecules constructed around a central core unit by a series of repetitive steps each of which results in a new generation of nanoparticle with a larger molecular diameter, and a surface that contains typically twice the number of reactive sites as the previous generation. Figure 9a shows a gadolinium map from a G7 (seventh generation) PAMAM/Gd-DTPA, obtained by recording EFTEM images above and below the N4,5-edge (Figure 9b).21 Quantitative analysis gives an estimate of the number of Gd atoms per particle and reveals that the dendrimer particles (illustrated in Figure 9c) contain a mean of 266±50 Gd atoms, where the uncertainty is attributed mainly to counting statistics in the EFTEM images. STEM data indicate that the total particle mass is 330±40 kDa and that approximately 300 of the 512 terminal groups are conjugated to DTPA (data not shown), implying that almost 90% of the DTPA molecules are bound to gadolinium. These measured distributions of mass and composition indicate a relatively high degree of monodispersity. The size of the dendrimer nanoparticles is just sufficient to pass through the pores of leaky blood vessels that occur in tumors, and these PAMAM/Gd-DTPA nanoparticles have therefore been used to obtain MRI images of brain tumors in mice injected intravenously with the reagent.21
Figure 9.
Application of EFTEM and EELS to the analysis of bionanoparticles. (a) EFTEM gadolinium N4,5 edge map of a generation-7 polyamidoamine (PAMAM) dendrimer conjugated with Gd3+ diethylene-triamine-pentaacetic-acid (DTPA); analysis of the Gd content reveals the degree of monodispersity and the number of gadolinium atoms (266 ± 4 s.e.m.) per nanoparticle (from Reference 21). (b) Gd N4,5 edge obtained from a reference standard. (c) Schematic diagram of dendrimer structure. (d) EFTEM iron L2,3 edge map of hybrid Au-Fe3O4 nanoparticles used to detect the presence of matrix metalloproteinase in cancer cells (from Reference 33). Cleavage of a substrate molecule bound to the iron oxide results in the release of a fluorescent dye; image reveals peripheral iron oxide particles surrounding central gold cores, which quench the fluorescent dye molecules until they are released following substrate cleavage. (e) Schematic diagram hybrid nanoparticle showing conjugation of enzyme substrate and dye to the Fe3O4 particles, and thiol-modified polyethylene glycol attached to the gold.
An example of a more complex hybrid nanoparticle (Figures 9d and 9e) is a ‘flower-like’ gold/iron oxide optical nanosensor that has been designed to detect a specific enzyme, matrix metalloproteinase (MMP), expressed by certain tumors. This nanoparticle has a central Au core attached to Fe3O4 particles in a flower petal arrangement. Organic molecules consisting of a polypeptide substrate for the MMP enzyme, coupled to a fluorescent dye Cy5.5, are anchored to the Fe3O4 by means of a linker.33 In the absence of the enzyme, the fluorescent dye is quenched by the Au core of the nanoparticle, but when MMP is present this enzyme cleaves off the dye molecule which then fluoresces. Iron L2,3 EFTEM maps from the Au/Fe3O4 optical nanosensor particles (Figure 9d) show a flower-like morphology with iron-containing petals surrounding gold cores that are visible by their high electron density in zero-loss TEM images. The architecture of the nanoparticle is confirmed from the EFTEM analysis and, together with particle’s 3D shape obtained from electron tomography (data not shown), leads to a model for the particle structure in Figure 9e. These Au/Fe3O4 optical nanosensors have been used successfully to image head and neck cancers in mice.33
Another functionalized hybrid bionanoparticle that has been analyzed in even greater detail by STEM-EELS at the sub-nanometer scale, is a 30-nm diameter silica nanoparticle containing a 7-nm diameter CdSe quantum dot at its core.20 These authors are not only able to characterize the inorganic components but also to obtain information about the chemical bonding of the nanoparticle’s organic surface coating consisting of lipid, hydocarbon, and Gd-DTPA, which has the potential to provide dual optical and MRI imaging modalities.
Imaging Elemental Distributions in 3D
Three-dimensional elemental maps can be obtained by collecting tomographic tilt series below and above a core edge.34–36 In beam sensitive materials, it is possible to utilize the principle of dose fractionation so that individual images in the tilt series can give rise to a 3D reconstruction with much improved statistics. Such an approach is used routinely in cryo-electron tomography,37 and it can be applied to 3D elemental maps too.38 It is crucial to align the images in the tilt series and this is achieved by depositing gold nanoparticles on the top and bottom surfaces of unstained plastic sections.39 We have applied this technique of quantitative electron spectroscopic tomography (QuEST) to map the 3D distributions of phosphorus in cell nuclei.38 Phosphorus is a major constituent of nucleic acid (DNA and RNA) since phosphate groups link together the sugars that are bound to the bases on each strand of the helix. The 3D arrangement of phosphorus and nitrogen has the potential to provide information about the packing of DNA and protein assemblies; phosphorus is indicative of nucleic acid, whereas nitrogen is indicative of protein as well as nucleic acid. Of course, the meaningful spatial resolution is limited by radiation damage and specimen preparation. In the QuEST technique one pre-edge and one post-edge P L2,3 image are acquired along with a t/λ map obtained from an unfiltered and zero-loss image, which allows a correction for plural inelastic scattering to be made.40 Figure 10 indicates the procedure for deriving the phosphorus maps for each angle in the tilt series, and then for obtaining the 3D phosphorus distribution by tomography reconstruction. Figure 11 shows the application of QuEST to map the distribution of nucleic acid in a cell from a 100-nm section of the organism Caenorhabditis elegans.41 Because of the need to quantify the elemental distributions, we have used a simultaneous iterative reconstruction technique (SIRT) algorithm rather than the more standard Fourier back-projection algorithm. Figures 11a and 11b show, respectively, the projected phosphorus map at a tilt angle of 0°, and a volume reconstruction of regions of cytoplasm (blue/green) and nucleus (orange/red). An x–z slice through the cytoplasm reveals RNA-containing ribsomes dispersed throughout the thickness of the section (Figure 11c); each ribosome is found to contain approximately 7000 P atoms, which is consistent with the known value. Quantitative analysis of phosphate in the cell nucleus has the potential to yield information about the packing density of DNA.
Figure 10.
Simplified diagram showing determination of a 2-D phosphorus map by subtracting a suitably scaled EFTEM pre-edge image from a post-edge image, and then the determination of a 3-D phosphorus map from a tomographic reconstruction of a 2-D phosphorus tilt series (from Reference 38). Two features are shown in the pre-edge and post-edge images but only the one at the top right contains phosphorus.
Figure 11.
Determination of 3D distributions of phosphorus using quantitative electron spectroscopic tomography (QuEST) (from Reference 41). (a) Phosphorus map at zero tilt angle from unstained, embedded and sectioned cell of Caenorhabditis elegans. (b) Volume rendered tomogram obtained using the simultaneous iterative reconstruction technique showing two regions of high phosphorus content: cytoplasm containing ribosomes (blue/green) and nucleus (orange/red) containing areas of densely packed chromatin. (c) x–z slice extracted from the reconstructed volume shows the roundness and clarity of ribosomes in 3D.
Detection Limits
When the probe size is reduced to a 1-nm diameter, STEM-EELS can provide near single atom detection of biologically important elements such as calcium and iron.17,42 By considering the inelastic cross sections for core-edge excitation as well as the cross sections for the EELS background corresponding to the high energy tails of valence electron excitations and lower energy core-edges, an approximate expression for the minimum detectable number of atoms pX of element X can be written as:43
Here, L is the probe size; h is a constant in the range 3–10 that depends on the shape of the background underlying the core edge; η is the detective quantum efficiency of the detector; I0 is the incident probe current; τ is the integration time; e is the electron charge; (S/N) is a specified signal-to-noise ratio; σX(Δ,β) is the inelastic cross section for the core excitation of element X for collection semi-angle β and integrated over energy window Δ; σB(Δ,β) is the inelastic cross section for the background in the same spectral energy window originating from matrix atoms B; and nB is the number of matrix atoms per unit area.
By using the above equation, we estimate that it should be possible to detect single atoms of iron and calcium bound to macromolecular assemblies supported on a 3 nm carbon film, with a S/N=3 for Fe and a S/N=7 for calcium, for a 1-nm diameter probe, a beam energy of 100 keV, and total incident charge of 0.4 nC.17 These predictions have been confirmed by experiment, but such measurements require an extremely high electron dose of >109 electrons per nm2. At these doses knock-on damage can result in severe mass loss from thin specimens, as has been demonstrated in the analysis of graphene and single-walled carbon nanotubes.44 Knock-on damage will also be relevant for nanoscale analysis of isolated macromolecules supported on thin carbon substrates. For this type of specimen, operation at 60-keV beam energy could be advantageous.45
Future Directions and Conclusions
Advances in the EELS instrumentation and processing methods now enable a range of compositional information to be obtained from biological materials. The latest generation of intermediate voltage transmission electron microscopes with beam energies of 200 or 300 keV provides the complementary approaches of EFTEM and STEM-EELS in a single instrument. The technique of choice depends on the application and the type of information that is needed, e.g., field of view, concentration range, chemical, elemental and three-dimensional composition, susceptibility of the specimen to radiation damage, etc. Recently, the sensitivity of energydispersive x-ray spectroscopy (EDXS) has increased by a factor of about ten with the advent of silicon drifted detectors (SDDs),46 which have collection solid angles approaching 1 steradian and maximum count rates of greater than 5×10⁵ s−1, so that simultaneous STEM-EELS and STEM-EDXS is now feasible, with each technique being more sensitive for a specific range of elements. For example, STEM-EDXS can be used to map the distributions of Na, K, and Mg in cryosectioned cells, whereas it is difficult to analyze these elements by STEM-EELS because of their unfavorable edge shapes.47 In the future correlative imaging techniques are also likely to increase in importance as attempts are made to identify specific bound elements and biological molecules in cellular structures. In that regard, the use of a dual-function probe like fluoronanogold allows the detection of specific proteins of interest in the fluorescence optical microscope, after which the same proteins can be localized in the electron microscope using the electron-dense gold labels.48,49 Fluoronanogold labeling can also be combined with EFTEM mapping to correlate the distribution of specific classes of biomolecules with an intrinsic marker such as phosphorus to image the distribution of nucleic acid. Both EFTEM and STEM-EELS are also finding application in the field nanomedicine and theranostics, in which hybrid inorganic/organic nanoparticles can be characterized to determine their structures and degrees of monodispersity. For some applications, STEM-EELS provides single atom sensitivity for detecting bound elements attached to macromolecular assemblies. It is not yet clear to what extent radiation damage will limit such applications but it might be necessary to reduce knock-on damage by lowering the beam voltage.
Acknowledgments
This work was supported by the Intramural Research Programs of the National Institute of Biomedical Imaging and Bioengineering, National Institutes of Health. They thank Dr. Alioscka Sousa (NIBIB, NIH) and Dr. S. Brian Andrews (NINDS, NIH) for valuable discussions, and Dr. Guofeng Zhang for his help with specimen preparation.
References
- 1.Colliex C, Brun N, Gloter A, Imhoff D, Kociak M, March K, Mory C, Stéphan O, Tencé M, Walls M. Phil. Trans. R. Soc. A. 2009;367:3845. doi: 10.1098/rsta.2009.0128. [DOI] [PubMed] [Google Scholar]
- 2.Varela M, Findlay SD, Lupini AR, Christen HM, Borisevich AY, Dellby N, Krivanek OL, Nellist PD, Oxley MP, Allen LJ, Pennycook SJ. Phys. Rev. Lett. 2004;92:95502. doi: 10.1103/PhysRevLett.92.095502. [DOI] [PubMed] [Google Scholar]
- 3.Muller DA. Nature Materials. 2009;8:263. doi: 10.1038/nmat2380. [DOI] [PubMed] [Google Scholar]
- 4.Isaacson MS. In: Principles and Techniques of Electron Microscopy. Hyatt MA, editor. New York: Van Nostrand-Reinhold; 1977. p. 1. [Google Scholar]
- 5.Shuman H, Somlyo AP. Ultramicroscopy. 1987;21:23. doi: 10.1016/0304-3991(87)90004-0. [DOI] [PubMed] [Google Scholar]
- 6.Isaacson M, Johnson D. Ultramicroscopy. 1975;1:33. doi: 10.1016/s0304-3991(75)80006-4. [DOI] [PubMed] [Google Scholar]
- 7.Sun S, Shi S, Hunt JA, Leapman RD. J. Microsc. 1995;177:18. doi: 10.1111/j.1365-2818.1995.tb03530.x. [DOI] [PubMed] [Google Scholar]
- 8.Leapman RD, Fiori CE, Swyt CR. J. Microsc. 1984;133:239. doi: 10.1111/j.1365-2818.1984.tb00489.x. [DOI] [PubMed] [Google Scholar]
- 9.Ottensmeyer FP. J. Ultrastruct. Res. 1984;88:121. doi: 10.1016/s0022-5320(84)80004-0. [DOI] [PubMed] [Google Scholar]
- 10.Bazett-Jones DP, Leblanc B, Herfort M, Moss T. Science. 1994;264:1134. doi: 10.1126/science.8178172. [DOI] [PubMed] [Google Scholar]
- 11.Bazett-Jones DP, Hendzel MJ, Kruhlak MJ. Micron. 1999;30:151. doi: 10.1016/s0968-4328(99)00019-0. [DOI] [PubMed] [Google Scholar]
- 12.Leapman RD, Rizzo NW. Ultramicroscopy. 1999;78:251. doi: 10.1016/s0304-3991(99)00031-5. [DOI] [PubMed] [Google Scholar]
- 13.Colliex C, Mory C. Biol. Cell. 1994;80:175. doi: 10.1111/j.1768-322x.1994.tb00928.x. [DOI] [PubMed] [Google Scholar]
- 14.Leapman RD, Jarnik M, Steven AC. J. Struct. Biol. 1997;120:168. doi: 10.1006/jsbi.1997.3937. [DOI] [PubMed] [Google Scholar]
- 15.Leapman RD, Ornberg RL. Ultramicroscopy. 1988;24:251. doi: 10.1016/0304-3991(88)90314-2. [DOI] [PubMed] [Google Scholar]
- 16.Leapman RD, Hunt JA, Buchanan RA, Andrews SB. Ultramicroscopy. 1993;49:225. doi: 10.1016/0304-3991(93)90229-q. [DOI] [PubMed] [Google Scholar]
- 17.Leapman RD. J. Microsc. 2003;210:5. doi: 10.1046/j.1365-2818.2003.01173.x. [DOI] [PubMed] [Google Scholar]
- 18.Shuman H. Ultramicroscopy. 1981;6:163. doi: 10.1016/0304-3991(81)90056-5. [DOI] [PubMed] [Google Scholar]
- 19.Krivanek OL, Ahn CC, Keeney RB. Ultramicroscopy. 1987;22:103. [Google Scholar]
- 20.van Schooneveld MM, Gloter A, Stephan O, Zagonel LF, Koole R, Meijerink A, Mulder WJM, de Groot FMF. Nature Nanotech. 2010;5:538. doi: 10.1038/nnano.2010.105. [DOI] [PubMed] [Google Scholar]
- 21.Sousa AA, Aronova MA, Wu H, Sarin H, Griffiths GL, Leapman RD. Nanomedicine. 2009;4:391. doi: 10.2217/nnm.09.14. [DOI] [PMC free article] [PubMed] [Google Scholar]
- 22.Leapman RD, Sun S. Ultramicroscopy. 1995;59:71. doi: 10.1016/0304-3991(95)00019-w. [DOI] [PubMed] [Google Scholar]
- 23.Aronova MA, Sousa AA, Leapman RD. Micron. 2011;42:252. doi: 10.1016/j.micron.2010.10.009. [DOI] [PMC free article] [PubMed] [Google Scholar]
- 24.Krivanek OL, Gubbens AJ, Dellby N, Meyer CE. Microsc. Microanal. Microstruct. 1992;3:187. [Google Scholar]
- 25.Jeanguillaume C, Colliex C. Ultramicroscopy. 1989;28:252. doi: 10.1016/s0304-3991(78)80030-8. [DOI] [PubMed] [Google Scholar]
- 26.Hunt JA, Williams DB. Ultramicroscopy. 1991;38:47. [Google Scholar]
- 27.Goping G, Pollard HB, Srivastrava M, Leapman RD. Microsc. Res. Tech. 2003;61:448. doi: 10.1002/jemt.10294. [DOI] [PubMed] [Google Scholar]
- 28.Yakovlev S, Misra M, Shi S, Firlar E, Libera M. Ultramicroscopy. 2010;110:866. doi: 10.1016/j.ultramic.2010.03.014. [DOI] [PubMed] [Google Scholar]
- 29.Sousa A, Aitouchen A, Libera M. Ultramicroscopy. 2006;106:130. doi: 10.1016/j.ultramic.2005.06.059. [DOI] [PubMed] [Google Scholar]
- 30.Hongpaisan J, Pivovarova NB, Colgrove SL, Leapman RD, Friel DD, Andrews SB. J. Gen. Physiol. 2001;118:101. doi: 10.1085/jgp.118.1.101. [DOI] [PMC free article] [PubMed] [Google Scholar]
- 31.Aronova MA, Kim YC, Pivovarova NB, Andrews SB, Leapman RD. Ultramicroscopy. 2009;109:201. doi: 10.1016/j.ultramic.2008.10.003. [DOI] [PMC free article] [PubMed] [Google Scholar]
- 32.Fukunaga M, Lia T-Q, van Gelderen P, de Zwarta JA, Shmuelia K, Yaoa B, Lee J, Maric D, Aronova MA, Zhang G, Leapman RD, Schenck JF, Merkle H, Duyn JH. Proc. Natl. Acad. Sci. (USA) 2010;107:3834. doi: 10.1073/pnas.0911177107. [DOI] [PMC free article] [PubMed] [Google Scholar]
- 33.Xie J, Zhang F, Aronova M, Zhu L, Lin X, Quan Q, Liu G, Zhang G, Choi KY, Kim K, Sun X, Lee S, Sun S, Leapman R, Chen X. ACS Nano. 2011;5:3043. doi: 10.1021/nn200161v. [DOI] [PMC free article] [PubMed] [Google Scholar]
- 34.Midgley PA, Weyland M. Ultramicroscopy. 2003;96:413. doi: 10.1016/S0304-3991(03)00105-0. [DOI] [PubMed] [Google Scholar]
- 35.Leapman RD, Kocsis E, Zhang G, Talbot TL, Laquerriere P. Ultramicroscopy. 2004;100:115. doi: 10.1016/j.ultramic.2004.03.002. [DOI] [PubMed] [Google Scholar]
- 36.Boudier T, Lechaire JP, Frébourg G, Messaoudi C, Mory C, Colliex C, Gaill F, Marco S. J. Struct. Biol. 2005;151:151. doi: 10.1016/j.jsb.2005.05.004. [DOI] [PubMed] [Google Scholar]
- 37.Koster AJ, Grimm R, Typke D, Hegerl R, Stoschek A, Walz J, Baumeister W. J. Struct. Biol. 1997;120:276. doi: 10.1006/jsbi.1997.3933. [DOI] [PubMed] [Google Scholar]
- 38.Aronova MA, Kim YC, Harmon RH, Sousa AA, Zhang G, Leapman RD. J. Struct. Biol. 2007;160:35. doi: 10.1016/j.jsb.2007.06.008. [DOI] [PMC free article] [PubMed] [Google Scholar]
- 39.Kremer JS, Mastronarde DN, McIntosh JR. J. Struct. Biol. 1997;116:168. doi: 10.1006/jsbi.1996.0013. [DOI] [PubMed] [Google Scholar]
- 40.Aronova MA, Kim YC, Zhang G, Leapman RD. Ultramicroscopy. 2007;107:232. doi: 10.1016/j.ultramic.2006.07.009. [DOI] [PMC free article] [PubMed] [Google Scholar]
- 41.Aronova MA, Sousa AA, Zhang G, Leapman RD. J. Microsc. 2010;239:223. doi: 10.1111/j.1365-2818.2010.03376.x. [DOI] [PMC free article] [PubMed] [Google Scholar]
- 42.Mory C, Colliex C. Ultramicroscopy. 1989;28:339. [Google Scholar]
- 43.Leapman RD. In: Transmission Electron Energy Loss Spectroscopy in Materials Science and the EELS Atlas. 2nd Edition. Ahn C, editor. Berlin: Wiley-VCH; 2004. p. 49. Chapter 3. [Google Scholar]
- 44.Krivanek OL, Chisholm MF, Nicolosi V, Pennycook TJ, Corbin GJ, Dellby N, Murfitt MF, Own CS, Szilagyi ZS, Oxley MP, Pantelides ST, Pennycook SJ. Nature. 2010;464:571. doi: 10.1038/nature08879. [DOI] [PubMed] [Google Scholar]
- 45.Egerton RF, Wang F, Crozier PA. Microsc. Microanal. 2006;12:65. doi: 10.1017/S1431927606060065. [DOI] [PubMed] [Google Scholar]
- 47.Somlyo AV, Broderick R, Shuman H, Buhle EL, Jr, Somlyo AP. Proc. Natl. Acad. Sci. USA. 1988;85:6222. doi: 10.1073/pnas.85.16.6222. [DOI] [PMC free article] [PubMed] [Google Scholar]
- 46.Schlossmacher P, Klenov DO, Freitag B, on Harrach HS. Microscopy Today. 2010;18:14. [Google Scholar]
- 48.Powell RD, Hainfeld JF. Microsc. Res. Tech. 1998;42:2. doi: 10.1002/(SICI)1097-0029(19980701)42:1<2::AID-JEMT2>3.0.CO;2-Y. [DOI] [PubMed] [Google Scholar]
- 49.Robinson JM, Takizawa T. J. Microsc. 2009;235:259. doi: 10.1111/j.1365-2818.2009.03221.x. [DOI] [PubMed] [Google Scholar]


