

Abstract
Purpose
Previous analysis of this Intergroup trial demonstrated that with a median follow-up among surviving patients of 45.9 months, the concurrent postoperative administration of cisplatin and radiation therapy improved local-regional control and disease-free survival of patients who had high-risk resectable head and neck carcinomas. With a minimum of 10 years of follow-up potentially now available for all patients, these results are herein updated to examine long-term outcomes.
Methods and Materials
410 analyzable patients who had high-risk resected head and neck cancers were prospectively randomized to receive either radiation therapy (RT: 60 Gy in 6 weeks) or identical RT plus cisplatin, 100 mg/m2 i.v. on days 1, 22, and 43 (RT + CT).
Results
At 10 years, the local-regional failure rates were 28.8% vs. 22.3% (p=0.10), disease-free survival was 19.1% vs. 20.1% (p=0.25) and overall survival was 27.0% vs. 29.1% (p=0.31) for patients treated by RT vs. RT + CT respectively. In the unplanned subset analysis limited to patients who had microscopically involved resection margins and/or extracapsular spread of disease, local-regional failure occurred in 33.1% vs. 21.0% (p=0.02), disease-free survival was 12.3% vs. 18.4% (p=0.05) and overall survival was 19.6% vs. 27.1% (p=0.07) respectively.
Conclusion
At a median follow-up of 9.4 years for surviving patients no significant differences in outcome were observed in the analysis of all randomized eligible patients. However, analysis of the subgroup of patients who had either microscopically involved resection margins and/or extracapsular spread of disease showed improved local-regional control and disease-free survival with concurrent administration of chemotherapy. The remaining subgroup of patients who were enrolled only because they had tumor in 2 or more lymph nodes did not benefit from the addition of CT to RT.
Introduction
Clinical trials conducted by the Radiation Therapy Oncology Group (RTOG) and others in the late 1980s suggested that a particularly high-risk subset of advanced operable head and neck squamous cell carcinomas exists that could be identified by the spread of tumor to 2 or more regional lymph nodes, extra-capsular extension of nodal disease and/or microscopically involved mucosal margins of resection [1]. Based on the concept that other high-risk tumors in various clinical settings respond better to concurrent chemotherapy and radiation therapy (RT + CT) than to radiation therapy (RT) alone [2–7], RTOG 9501 was designed to test the addition of concurrent cisplatin (CDDP) to postoperative RT in terms of improving local-regional (L-R) control and secondarily in terms of disease-free survival (DFS) and overall survival (OS). Our initial analysis [8] demonstrated significantly improved L-R control and DFS, but not OS.
Contemporaneously, the European Organisation for Research and Treatment of Cancer (EORTC) conducted a nearly identical trial (EORTC 22931), save for the precise definition of “high-risk” that was used. That trial [9] demonstrated significant improvement in L-R control, DFS, and OS.
We therefore decided to look at the long-term outcome of RTOG 9501 to learn if the passage of time has reconciled this difference.
Methods and Materials
The RTOG, the Eastern Cooperative Oncology Group (ECOG), and the Southwest Oncology Group (SWOG), conducted this Intergroup phase III trial (RTOG 9501, ECOG R9501, SWOG 9515). Eligibility requirements, pretreatment procedures, treatment modifications, study endpoints, and methods of statistical analysis were detailed previously.[8] Briefly, eligible patients had gross total resection of a newly diagnosed squamous cell carcinoma of the oral cavity, oropharynx, hypopharynx, or larynx and histologic proof of invasion of 2 or more regional lymph nodes, extracapsular extension of nodal disease and/or microscopically involved mucosal margins of resection. The dataset for this analysis consists of 410 patients, compared to 416 in the initial report, because 6 patients were found to be ineligible on review of additional submitted information. Patients were randomly assigned to treatment with RT (60 Gy in 30 fractions over 6 weeks, with or without a boost of 6 Gy in 3 fractions over 3 days to high-risk sites) or RT + CT (identical RT plus concurrent cisplatin, 100 mg/m2 i.v. on days 1, 22, and 43). After stratification for age (< 70 vs. ≥ 70) and high-risk category (microscopically involved margin vs. others), the treatment allocation scheme described by Zelen was used to balance patient factors other than institution.[10]
Patients were examined at least weekly during treatment, at 9 weeks after treatment, then every 3 months for the first year, twice annually in years 2–3, and annually thereafter.
Endpoints
The primary endpoint of L-R control and the secondary endpoints of DFS, and OS have been defined previously [8]. The components of DFS (the absence of L-R recurrence, distant metastasis, secondary primary tumor, and death without cancer) were also analyzed individually as first events. Cause-specific survival was also analyzed by the method proposed by Peto and colleagues as described below [11]. Chemotherapy toxicity was scored by the Radiation Therapy Oncology Group Common Toxicity Criteria and radiation therapy toxicity was scored by the RTOG Acute & Late Radiation Morbidity Criteria.
Statistical Methodology
L-R control rates and the components of DFS as first events were estimated using the method of cumulative incidence [12] and differences were assessed by the Gray’s test [13]. When analyzing time to first event, patients with simultaneous local-regional and distant failure were considered to have had local-regional failure. OS and DFS rates were estimated using the Kaplan-Meier method [14] and differences were assessed by the log-rank statistic [14]. Head and neck cancer and non-head and neck cancer mortality was also analyzed by the method proposed by Peto and colleagues [11]. Deaths attributed to causes other than head and neck cancer with no reported recurrence of head and neck cancer were categorized as non-head and neck cancer deaths”. All other deaths were categorized as head and neck cancer deaths” including deaths from head and neck cancer, deaths from any cause after recurrence and deaths from unknown cause without reported recurrence. Hazard ratios (HR) comparing patient groups were estimated using Cox proportional hazards models [16]. Missing data on smoking status at baseline (n=36) and during radiation therapy (n=100) were imputed with the Markov chain Monte Carlo algorithm with a noninformative prior distribution. Twenty datasets were created and the resulting analyses were combined per Rubin’s formula [17]. Grade 3–4 late toxicity rates were compared with Fisher’s exact test. Cumulative incidences of late toxicity were compared by Gray’s test.
Results
Length of Follow Up
The dataset for analysis was created on August 24, 2010. Median follow up for surviving patients is 9.4 years (range 0.21 to 14.0 years). Only 5 patients were lost to follow-up.
Local-regional control
At 10 years, the local-regional recurrence rates of the randomized cohorts are no longer statistically different (Table 1); however, in the unplanned subset of tumors characterized by ECE and/or microscopically involved margins, RT + CT continues to be associated with statistically better local-regional control. In contrast, patients who were enrolled solely based on having multiple involved nodes (i.e., without ECE and/or an involved margin) appear not to derive local-regional benefit from RT + CT. Although subgroups with progressively more nodal involvement have progressively fewer members precluding meaningful analysis of the subgroups with the maximum nodal involvement, even in the subgroup of patients who had the relatively high degree of six or more involved nodes and neither involved margins or ECE (a subgroup containing 44 patients) there is no suggestion that the addition of chemotherapy was beneficial.
Table 1.
Outcome of the Entire Group and Three Unplanned Risk-Related Subsets
| All Patients | RT | Combined | p value | HR |
|---|---|---|---|---|
| 10-year L-R recurrence | 28.8 | 22.3 | 0.10 | 0.73 |
| 95% confidence int. | 22.6–35.0 | 16.4–28.2 | 0.49–1.07 | |
| 10-year DFS | 19.1 | 20.1 | 0.25 | 0.88 |
| 95% confidence int. | 13.1–25.0 | 14.2–26.0 | 0.71–1.09 | |
| 10-year OS | 27 | 29.1 | 0.31 | 0.89 |
| 95% confidence int. | 20.5–33.5 | 22.3–35.8 | 0.70–1.12 | |
| ECE and/or Margin + | RT | Combined | p value | HR |
| 10-year L-R recurrence | 33.10 | 21.00 | 0.02 | 0.56 |
| 95% confidence int. | 24.2–41.9 | 13.7–28.2 | 0.34–0.92 | |
| 10-year DFS | 12.3 | 18.4 | 0.05 | 0.76 |
| 95% confidence int. | 5.2–19.4 | 11.3–25.5 | 0.57–1.00 | |
| 10-year OS | 19.6 | 27.1 | 0.07 | 0.76 |
| 95% confidence int. | 11.5–27.7 | 18.9–35.4 | 0.57–1.03 | |
| No ECE and Margin − | RT | Combined | p value | HR |
| 10-year L-R recurrence | 23.8 | 24.7 | 0.92 | 1.03 |
| 95% confidence int. | 15.1–32.6 | 14.6–34.7 | 0.55–1.93 | |
| 10-year DFS | 26.3 | 22.4 | 0.88 | 0.97 |
| 95% confidence int. | 16.7–36.0 | 11.6–33.1 | 0.68–1.39 | |
| 10-year OS | 35.90 | 32.20 | 0.99 | 1.00 |
| 95% confidence int. | 25.6–46.1 | 20.5–43.9 | 0.68–1.46 | |
| Six + involved nodes | RT | Combined | p value | HR |
| 5-year L-R recurrence | 19.2 | 28.6 | 0.46 | 1.59 |
| 95% confidence int. | 3.7–34.8 | 6.5–50.8 | 0.46–5.51 | |
| 5-year DFS | 42.3 | 30.1 | 0.36 | 1.37 |
| 95% confidence int. | 23.3–61.3 | 8.2–52.0 | 0.70–2.69 | |
| 5-year OS | 46.2 | 47.2 | 0.28 | 1.49 |
| 95% confidence int. | 27.0–65.3 | 23.5–71.0 | 0.72–3.11 |
Survival
At 10 years, the DFS rates of the randomized cohorts similarly no longer are statistically different (Table 1); however, again in the unplanned subset of tumors characterized by ECE and/or microscopically involved margins, RT + CT continues to be associated with statistically better disease-free survival. In contrast, patients who were enrolled based on multiple involved nodes only (i.e., without ECE and/or an involved margin) appear not to have better disease-free survival rates associated with RT + CT.
At 10 years, as in the initial report, the OS rates of the randomized cohorts are not statistically different (Table 1). Moreover, none of the unplanned subsets we examined demonstrated statistically improved overall survival associated with RT + CT.
Tumor Control and Patterns of Failure
Table 2 details the patterns of treatment failure and causes of death. For both groups of patients, distant metastases are a common mode of treatment failure. Fig. 1 displays the time to first failure by assigned treatment (see supplemental image for similar curves presented as decreasing frequency). Concurrently adding cisplatin to RT decreased the risk of local-regional recurrence as the first site of failure (Fig. 1a), but did not significantly reduce the occurrence of distant metastases, second independent malignancies or death as the first type of treatment failure (Figs. 1b–d). To better understand the overall survival results, we performed an unplanned analysis of cause-specific survival (CSS). For patients whose death was attributable to the study cancer (Table 3), there is a trend towards better survival in patients treated by RT + CT (p=0.07). Overall, for patients whose death was not attributable to the study cancer, there were 22 more deaths in the RT + CT group (RT = 50 vs. RT + CT = 72, Table 2). For the cause specific analysis (any patient who had a recurrence and subsequently died was scored as a study cancer related death), there were 27 deaths in the RT group and 41 in the RT+CT group not attributed to the study cancer, but only 4 deaths were believed to be directly treatment related, all on the RT+CT arm. In the unplanned subgroup of patients who had extracapsular extension of nodal disease and/or microscopically involved resection margins, there were significantly fewer study-cancer related cause-specific deaths in the RT + CT group (RT = 77, RT+CT = 67, p=0.01). There was no statistical difference in this unplanned subgroup among the patients whose death was not due to the study cancer (RT = 12, RT+CT = 24, p=0.29).
Table 2.
Patterns of Failure and Causes of Death
| RT (n=208) | RT + CT (n=202) | |
|---|---|---|
| First failure, all patients | (n=208) | (n=202) |
| Local relapse | 24 (11.5%) | 14 (6.9%) |
| Regional relapse | 17 (8.2%) | 11 (5.4%) |
| Local & regional relapse | 1 (0.5%) | 4 (2.0%) |
| Local relapse & distant metastases | 8 (3.8%) | 0 (0.0%) |
| Regional relapse & distant metastases | 1 (0.5%) | 2 (1.0%) |
| Local & regional relapse & distant metastases | 2 (1.0%) | 3 (1.5%) |
| Local relapse & non-H&N second primary | 1 (0.5%) | 0 (0.0%) |
| Distant metastases | 44 (21.2%) | 39 (19.3%) |
| Distant metastases & non-H&N second primary | 0 (0.0%) | 2 (1.0%) |
| H&N second primary | 9 (4.3%) | 8 (4.0%) |
| Non-H&N second primary | 24 (11.5%) | 27 (13.4%) |
| Dead-study cancer NOS | 8 (3.8%) | 4 (2.0%) |
| Dead-NED | 23 (11.1%) | 47 (23.3%) |
| Alive-NED | 46 (22.1%) | 41 (20.3%) |
| Cause of death | (n=148) | (n=141) |
| Related to or probably related to the cancer under study | 98 (66.2%) | 69 (48.9%) |
| Related to or probably related to a second malignancy | 13 (8.8%) | 17 (12.1%) |
| Related to or probably related to complications of protocol treatment | 0 (0.0%) | 4 (2.8%) |
| Related to or probably related to complications of other treatment | 1 (0.7%) | 1 (0.7%) |
| Unrelated to or probably unrelated to cancer or treatment | 21 (14.2%) | 23 (16.3%) |
| Unknown or not reported | 15 (10.1%) | 27 (19.1%) |
H&N = head and neck; NOS = not otherwise specified; NED = no evidence of disease.
Fig. 1.
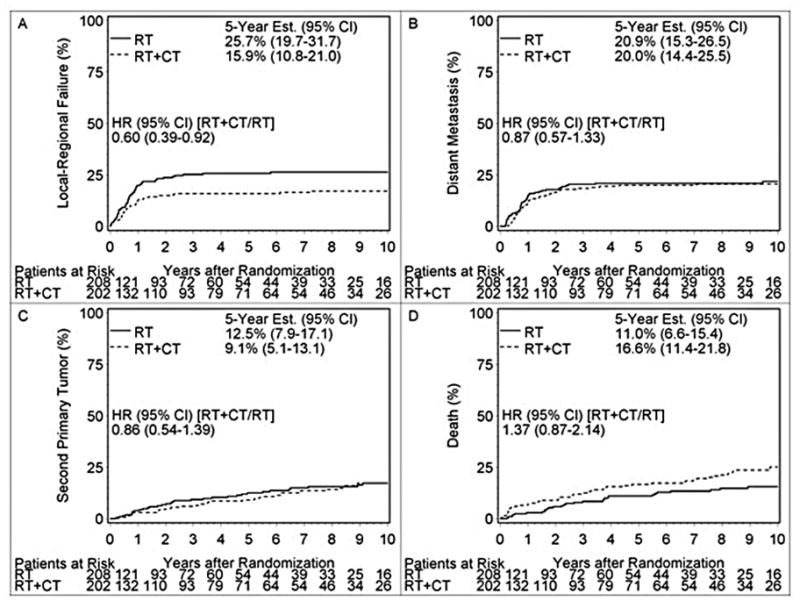
Time to First Failure by Assigned Treatment
Table 3.
Overall Survival by Cause of Death
| Assigned Treatment | Failures | 5-Year Estimate (95% CI) | 10-Year Estimate (95% CI) | Hazard Ratio (95% CI) | |
|---|---|---|---|---|---|
| ALL PATIENTS | |||||
| Death from any cause * | RT | 148 | 37.1 (30.4–43.8) | 27.0 (20.5–33.5) | -- |
| RT + CT | 141 | 45.8 (38.8–52.7) | 29.1 (22.3–35.8) | 0.89 (0.70–1.12) | |
| Death from study cancer | RT | 121 | 43.0 (35.8–50.2) | 35.1 (27.7–42.5) | -- |
| RT + CT | 100 | 56.9 (49.6–64.1) | 42.7 (34.6–50.7) | 0.78 (0.60–1.02) | |
| Death not from study cancer | RT | 27 | 83.7 (76.5–90.9) | 74.1 (64.5–83.8) | -- |
| RT + CT | 41 | 78.5 (71.3–85.7) | 65.6 (55.9–75.3) | 1.30 (0.80–2.11) | |
| PATIENTS WHO HAD INVOLVED MARGIN(S) AND/OR EXTRACAPSULAR EXTENSION | |||||
| Death from any cause | RT | 89 | 30.7 (22.0–39.4) | 19.6 (11.5–27.7) | -- |
| RT + CT | 91 | 42.5 (33.8–51.2) | 27.1 (18.9–35.4) | 0.76 (0.57–1.03) | |
| Death from study cancer | RT | 77 | 35.7 (26.4–45.1) | 26.7 (17.1–36.2) | -- |
| RT + CT | 67 | 53.4 (44.1–62.7) | 37.4 (27.4–47.5) | 0.66 (0.47–0.91) | |
| Death not from study cancer | RT | 12 | 82.7 (71.5–94.0) | 69.8 (53.2–86.3) | -- |
| RT + CT | 24 | 77.7 (68.5–87.0) | 70.3 (59.5–81.2) | 1.30 (0.65–2.61) | |
CI = confidence interval.
i.e., overall survival.
Late toxicity
After treatment with RT + CT 24.9% of patients developed at least one grade 3–5 late toxicity, compared with 20.5% after RT alone (p=0.34). The incidence of grade 4 late toxicity was nearly twice as high on the RT+CT arm (7.3% vs. 3.9%). On the RT+CT arm, 18 experienced 2 or more (maximum 4) grade 4 toxicities and on the RT arm, 10 patients experienced 2 or more (maximum 6) grade 4 toxicities. The average number of late Grade 3–5 toxicities per patient is 0.39 for the RT+CT arm and 0.28 for the RT arm. Table 4a displays the nature of the toxicities and Table 4b displays cumulative incidence. Although the RT+CT arm has numerically higher cumulative incidence of late Grade 3–5 toxicities the difference is not statistically significant (hazard ratio 1.21; p=0.26). Especially on the RT+CT arm, the first occurrences of late toxicity often appeared in the first year of follow up (RT: 24/42; RT+CT: 39/48). But, the difference between the arms appears to have been driven by the patients who did not have ECE and/or involved margins (hazard ratio 1.59; p=0.18). At 5 years after the start of treatment, the prevalence of Grade 3–4 late toxicity is 9.3% (5/54) on the RT arm and 4.2% (3/71) on the RT+CT arm (p=0.29).
Table 4a.
Number of Patients having Late Toxicity by Type and Grade
| RT (n=205) | RT + CT (n=193) | |||||||||
|---|---|---|---|---|---|---|---|---|---|---|
| Grade
|
Grade
|
|||||||||
| 1 | 2 | 3 | 4 | 5 | 1 | 2 | 3 | 4 | 5 | |
|
|
|
|
||||||||
| Skin | 72 | 17 | 2 | 0 | 0 | 67 | 20 | 2 | 4 | 0 |
| Mucous membrane | 48 | 17 | 4 | 2 | 0 | 50 | 24 | 2 | 2 | 0 |
| Subcutaneous tissue | 41 | 39 | 6 | 1 | 0 | 55 | 43 | 4 | 0 | 0 |
| Salivary gland | 50 | 61 | 6 | 0 | 0 | 34 | 77 | 8 | 0 | 0 |
| Pharynx/esophagus | 42 | 35 | 12 | 1 | 0 | 31 | 28 | 17 | 2 | 0 |
| Larynx | 36 | 6 | 3 | 2 | 0 | 46 | 8 | 6 | 0 | 1 |
| Spinal cord | 17 | 0 | 0 | 0 | 0 | 35 | 0 | 0 | 0 | 0 |
| Bone | 14 | 5 | 1 | 2 | 0 | 23 | 2 | 1 | 5 | 0 |
| Joint | 22 | 8 | 2 | 0 | 0 | 29 | 8 | 1 | 0 | 0 |
| Brain | 19 | 1 | 1 | 0 | 0 | 31 | 0 | 0 | 0 | 0 |
| Other neurologic | 20 | 4 | 2 | 0 | 0 | 29 | 9 | 4 | 0 | 0 |
| Hematologic | 26 | 5 | 1 | 1 | 0 | 39 | 12 | 4 | 0 | 0 |
| Renal | 17 | 0 | 0 | 0 | 0 | 32 | 3 | 2 | 0 | 0 |
| Upper GI | 19 | 3 | 1 | 0 | 0 | 31 | 3 | 3 | 0 | 0 |
| Other | 21 | 26 | 8 | 0 | 0 | 31 | 19 | 5 | 2 | 1 |
Table 4b.
Cumulative Incidence of Grade 3–5 Late Toxicity By Assigned Treatment
| All Eligible Patients
| ||||||||
|---|---|---|---|---|---|---|---|---|
| Year | RT
|
RT+CT
|
||||||
| Estimate (%) | 95% CI (%) | Cumulative Failures | At Risk | Estimate (%) | 95% CI (%) | Cumulative Failures | At Risk | |
|
|
|
|
||||||
| 0 | 0.0 | -- | 0 | 205 | 0.0 | -- | 0 | 193 |
| 1 | 11.7 | 7.3–16.1 | 24 | 147 | 20.2 | 14.5–25.9 | 39 | 125 |
| 2 | 15.7 | 10.7–20.7 | 32 | 96 | 21.2 | 15.5–27.0 | 41 | 99 |
| 5 | 18.8 | 13.4–24.2 | 38 | 52 | 22.8 | 16.9–28.8 | 44 | 66 |
| 10 | 20.6 | 14.9–26.3 | 41 | 19 | 25.3 | 19.0–31.5 | 48 | 26 |
|
|
|
|
||||||
| Total | 42 | 48 | ||||||
|
| ||||||||
| p-value (Gray’s test): 0.2601 | ||||||||
| hazard ratio (95% CI) [RT+CT/RT]: 1.206 (0.797, 1.826) | ||||||||
|
| ||||||||
| Limited to eligible patients with positive margin and/or ECE | ||||||||
| Year | RT
|
RT+CT
|
||||||
| Estimate (%) | 95% CI (%) | Cumulative Failures | At Risk | Estimate (%) | 95% CI (%) | Cumulative Failures | At Risk | |
|
|
|
|
||||||
| 0 | 0.0 | -- | 0 | 113 | 0.0 | -- | 0 | 120 |
| 1 | 16.8 | 9.9–23.7 | 19 | 70 | 22.5 | 15.0–30.0 | 27 | 73 |
| 2 | 18.6 | 11.4–25.8 | 21 | 40 | 23.3 | 15.7–30.9 | 28 | 57 |
| 5 | 21.5 | 13.8–29.2 | 24 | 21 | 25.1 | 17.2–32.9 | 30 | 37 |
| 10 | 25.1 | 16.7–33.4 | 27 | 9 | 26.2 | 18.2–34.2 | 31 | 16 |
|
|
|
|
||||||
| Total | 28 | 31 | ||||||
|
| ||||||||
| p-value (Gray’s test): 0.7825 | ||||||||
| hazard ratio (95% CI) [RT+CT/RT]: 0.987 (0.591, 1.649)
| ||||||||
|
Limited to eligible patients with neither positive margin nor ECE
| ||||||||
| Year | RT
|
RT+CT
|
||||||
| Estimate (%) | 95% CI (%) | Cumulative Failures | At Risk | Estimate (%) | 95% CI (%) | Cumulative Failures | At Risk | |
|
|
|
|
||||||
| 0 | 0.0 | -- | 0 | 92 | 0.0 | -- | 0 | 73 |
| 1 | 5.4 | 0.8–10.1 | 5 | 77 | 16.4 | 7.9–25.0 | 12 | 52 |
| 2 | 12.0 | 5.3–18.8 | 11 | 56 | 17.8 | 9.0–26.7 | 13 | 42 |
| 5 | 15.4 | 7.9–22.9 | 14 | 31 | 19.2 | 10.1–28.3 | 14 | 29 |
| 10 | 15.4 | 7.9–22.9 | 14 | 10 | 23.7 | 13.7–33.7 | 17 | 10 |
|
|
|
|
||||||
| Total | 14 | 17 | ||||||
|
| ||||||||
| p-value (Gray’s test): 0.1802 | ||||||||
| hazard ratio (95% CI) [RT+CT/RT]: 1.592 (0.785, 3.232) | ||||||||
Effect of Anatomic Site
After the design and conduct of this trial, the unique behavior of oropharyngeal tumors that are associated with HPV infection has become evident. Although HPV status of the tumors included in this trial is unknown, Table 5a displays the univariate hazard ratios and associated 95% confidence intervals for each of the predefined endpoints of this trial comparing all oropharyngeal vs. non-oropharyngeal tumors and for the subgroups having ECE and/or involved surgical margins.
Table 5a. Treatment effect for unplanned subgroups that may have influenced outcome.
Treatment effect within oropharynx and non-oropharynx subgroups *
| Endpoint | All sites | Oropharynx | Non-Oropharynx |
|---|---|---|---|
| All eligible patients | |||
| LRC | 0.73 (0.49–1.07) | 0.63 (0.33–1.19) | 0.84 (0.51–1.37) |
| DFS | 0.88 (0.71–1.09) | 0.95 (0.66–1.38) | 0.93 (0.71–1.23) |
| OS | 0.89 (0.70–1.12) | 0.95 (0.64–1.42) | 0.95 (0.71–1.26) |
| Limited to eligible patients with positive margin and/or ECE | |||
| LRC | 0.56 (0.34–0.92) | 0.49 (0.21–1.11) | 0.65 (0.34–1.22) |
| DFS | 0.76 (0.57–1.00) | 0.77 (0.49–1.23) | 0.83 (0.58–1.19) |
| OS | 0.76 (0.57–1.03) | 0.82 (0.50–1.34) | 0.84 (0.58–1.21) |
Univariate hazard ratio and 95% confidence interval
LRC = L-R control
Effect of Smoking
Patients were grouped by their smoking history. Patients who were smoking at the time of their diagnosis had a worse outcome than patients who were not (hazard ratio 1.5–1.6 for the three endpoints of L-R control, DFS and OS). Continuing to smoke during treatment did not appear to be associated with a substantially different prognosis than stopping at diagnosis (hazard ratio 0.8–1.3 for the three endpoints). As is shown in Table 5b, there is no substantial change in treatment effect after accounting for smoking.
Table 5b.
Treatment effect after adjustment for smoking status*
| Endpoint | Without Adjustment for Smoking | With Adjustment for Smoking, Complete Data | With Adjustment for Smoking, Missing Smoking Data Imputed |
|---|---|---|---|
| All eligible patients | |||
| LRC | 0.72 (0.49–1.06) | 0.74 (0.46–1.18) | 0.76 (0.51–1.13) |
| DFS | 0.87 (0.70–1.09) | 0.88 (0.67–1.15) | 0.93 (0.75–1.17) |
| OS | 0.89 (0.70–1.12) | 0.83 (0.63–1.10) | 0.93 (0.73–1.17) |
| Limited to eligible patients with positive margin and/or ECE | |||
| LRC | 0.56 (0.34–0.93) | 0.58 (0.31–1.11) | 0.60 (0.36–1.02) |
| DFS | 0.77 (0.58–1.02) | 0.81 (0.57–1.14) | 0.85 (0.64–1.15) |
| OS | 0.79 (0.58–1.04) | 0.78 (0.54–1.12) | 0.85 (0.63–1.16) |
Multivariate hazard ratio for treatment effect and 95% confidence interval, after adjustment for study stratification factors (age, risk group), with and without adjustment for smoking status at baseline (current smoker vs. former/never) and continued smoking during radiation therapy (yes vs. no).
LRC = L-R control
Discussion
The publication in 2004 of the very similar RTOG and EORTC studies [8,9] provided the evidence-based medicine to support the concept that postoperative radiation therapy and concurrent cisplatin for high-risk resected head and neck cancer improves L-R control and DFS as compared with postoperative radiation therapy alone. Only the EORTC study observed a significant improvement in overall survival; however, it was hoped that with additional follow-up such improvement would also be observed in the RTOG trial.
Now, with a median follow-up of 9.4 years for surviving patients, this analysis of RTOG 9501 shows no statistically significant differences for any of the major endpoints of L-R control (the primary endpoint), DFS, or OS (secondary endpoints). Moreover, the longer follow-up has blunted the differences in outcome originally observed.
We previously hypothesized that the different definitions of high-risk criteria for eligibility in the RTOG and EORTC trials explained the outcomes. Our pooled raw data [18] suggested that the clearest benefit of concurrent postoperative therapy occurred in the subgroup of patients who would have been eligible for either trial, i.e., the patients who had extracapsular extension of disease and/or microscopic evidence of tumor at the resection margin. Patients who did not meet the eligibility criteria for both trials, specifically those included in RTOG 9501 who had 2 or more involved lymph nodes (without extracapsular spread or involved margins), did not benefit from the addition of cisplatin. Our current data from the unplanned subset analysis supports this view. In the subgroup of patients who had extracapsular extension of disease and/or microscopic evidence of tumor at the resection margin, L-R control remains significantly better with the addition of cisplatin. Conversely, there is no significant difference in other patient subsets and there is no suggestion that increasing nodal burden of disease is associated with an improved outcome with chemotherapy. However, because this trial was not designed to address this specific question, this observation must be viewed as exploratory and hypothesis-generating rather than as evidentiary proof.
When the analysis was limited to the subgroup of patients who had extracapsular disease and/or microscopically involved resection margins DFS is significantly improved with the addition of cisplatin (HR=0.76, p=0.05), there is a trend toward improvement in OS (HR=0.76, p=0.07) and there is a significant improvement in cause-specific survival (death due to the study cancer, HR=0.66, p=0.01).
The potential benefits of concurrent chemotherapy need to be weighed against the potential toxicity of treatment. The percentage of patients having at least one grade 3 – 5 late toxicity (particularly in the first year of follow up), the percentage having a grade 4 late toxicity, the percentage having two or more grade 4 late toxicities and the average number of grade 3 –5 late toxicities per patient all suggest that combined therapy is associated with increased late toxicity. On the other hand, the data (in Table 4b) do not suggest a continued, disproportionate increase in the toxicity from RT + CT in the later years of follow-up.
We are unable to analyze the potential effect of HPV infection on the outcome of this trial. Not recognized at the time this trial was designed and conducted, HPV-positive cancers are associated with a better prognosis, could have diluted the RTOG “high risk” group and could have confounded the results. Because of the association of HPV tumors with oropharyngeal tumors, it is also possible that the greater frequency of oropharynx primaries in the RTOG vs. the EORTC trial is a surrogate for more HPV-related cancers. However, there was no significant difference in any of the measured endpoints for oropharyngeal vs. non-oropharyngeal tumors either in the entire eligible group or just in the subgroup who had ECE and/or involved margins.
Smoking at the time of diagnosis was associated with a worse outcome; however, continuing to smoke during treatment did not appear to impart an even worse outcome. There was no substantial change in treatment effect (RT vs. RT + CT) attributable to smoking.
Conclusions
Our analysis at 10 years fails to show a long-term benefit for the addition of concurrent cisplatin to post-operative RT for the primary endpoint of L-R control or the secondary endpoints of DFS and OS for all eligible randomized patients. However, significant improvements in L-R control and DFS from concurrent cisplatin persisted in the subgroup that had ECE and/or involved margins. The presence of tumor within regional nodes does not appear to be a useful selection factor for the addition of cisplatin chemotherapy as it was administered in this study.
Supplementary Material
Footnotes
Publisher's Disclaimer: This is a PDF file of an unedited manuscript that has been accepted for publication. As a service to our customers we are providing this early version of the manuscript. The manuscript will undergo copyediting, typesetting, and review of the resulting proof before it is published in its final citable form. Please note that during the production process errors may be discovered which could affect the content, and all legal disclaimers that apply to the journal pertain.
Contributor Information
Jay S. Cooper, Maimonides Cancer Center, New York, NY.
Qiang Zhang, Radiation Therapy Oncology Group Statistical Center, Philadelphia, PA.
Thomas F. Pajak, Radiation Therapy Oncology Group Statistical Center, Philadelphia, PA.
Arlene A. Forastiere, Sidney Kimmel Comprehensive Cancer Center at Johns Hopkins, Baltimore, MD.
John Jacobs, Barbara Ann Karmanos Comprehensive Cancer Center/Wayne State University, Detroit, MI.
Scott B. Saxman, Cancer Therapy Evaluation Program, National Cancer Institute, Bethesda, MD (current affiliation Lilly USA, Indianapolis, IN).
Julie A. Kish, H. Lee Moffitt Cancer Center, Tampa, FL.
Harold E. Kim, Wayne State University Medical Center, Detroit, MI.
Anthony J. Cmelak, Vanderbilt Cancer Center, Nashville, TN.
Marvin Rotman, SUNY Health Center at Brooklyn, Brooklyn NY.
Robert Lustig, Hospital of the University of Pennsylvania, Philadelphia, PA.
John F. Ensley, Barbara Ann Karmanos Comprehensive Cancer Center/Wayne State University, Detroit, MI.
Wade Thorstad, Washington University, St. Louis, MO.
Christopher J. Schultz, Medical College of Wisconsin, Milwaukee, WI.
Sue S. Yom, University of California, San Francisco, CA.
K. Kian Ang, Anderson Cancer Center, Houston, TX.
References
- 1.Cooper JS, Pajak TF, Forastierre A, et al. Precisely Defining High-Risk Operable Head and Neck Tumors Based on RTOG #85-03 and #88-24: Targets For PostOperative Radiochemotherapy. Head and Neck. 1998;20(7):588–594. doi: 10.1002/(sici)1097-0347(199810)20:7<588::aid-hed2>3.0.co;2-f. [DOI] [PubMed] [Google Scholar]
- 2.Morris M, Eifel PJ, Lu J, Grigsby PW, et al. Pelvic radiation with concurrent chemotherapy compared with pelvic and para-aortic radiation for high-risk cervical cancer. N Engl J Med. 1999 Apr 15;340(15):1137–43. doi: 10.1056/NEJM199904153401501. [DOI] [PubMed] [Google Scholar]
- 3.Cooper JS, Guo M, Herskovic A, et al. Chemoradiotherapy of Locally Advanced Esophageal Cancer: Long-term Follow-up of a Prospective Randomized Intergroup Trial (RTOG 85-01) JAMA. 1999;281:1623–27. doi: 10.1001/jama.281.17.1623. [DOI] [PubMed] [Google Scholar]
- 4.Al-Sarraf M, LeBlanc M, Shanker Giri PG, et al. Chemoradiotherapy Versus Radiotherapy in Patients With Advanced Nasopharyngeal Cancer: Phase III Randomized Intergroup Study 0099. J Clin Oncol. 1998;16:1310–1317. doi: 10.1200/JCO.1998.16.4.1310. [DOI] [PubMed] [Google Scholar]
- 5.Calais G, Alfonsi M, Bardet E, et al. Randomized Trial of Radiation Therapy Versus Concomitant Chemotherapy and Radiation Therapy for Advanced-Stage Oropharynx Carcinoma. J Natl Cancer Inst. 1999;91:2081–6. doi: 10.1093/jnci/91.24.2081. [DOI] [PubMed] [Google Scholar]
- 6.Adelstein DJ, Lavertu P, Saxton JP, et al. Mature Results of a Phase III Randomized Trial Comparing Concurrent Chemoradiotherapy with Radiation Therapy Alone in Patients with Stage III and IV Squamous Cell Carcinoma of the Head and Neck Cancer. 2000;88:876–83. doi: 10.1002/(sici)1097-0142(20000215)88:4<876::aid-cncr19>3.0.co;2-y. [DOI] [PubMed] [Google Scholar]
- 7.Brizel DM, Albers ME, Fisher SR, et al. Hyperfractionated Irradiation with or without Concurrent Chemotherapy for Locally Advanced Head and Neck Cancer. N Engl J Med. 1998;338:1798–804. doi: 10.1056/NEJM199806183382503. [DOI] [PubMed] [Google Scholar]
- 8.Cooper JS, Pajak TF, Forastiere AA, et al. Radiation Therapy Oncology Group 9501/Intergroup. Postoperative concurrent radiotherapy and chemotherapy for high-risk squamous-cell carcinoma of the head and neck. N Engl J Med. 2004 May 6;350(19):1937–44. doi: 10.1056/NEJMoa032646. [DOI] [PubMed] [Google Scholar]
- 9.Bernier J, Domenge C, Ozsahin M, et al. European Organization for Research and Treatment of Cancer Trial 22931. Postoperative irradiation with or without concomitant chemotherapy for locally advanced head and neck cancer. N Engl J Med. 2004 May 6;350(19):1945–52. doi: 10.1056/NEJMoa032641. [DOI] [PubMed] [Google Scholar]
- 10.Zelen M. The randomization and stratification of patients to clinical trials. J Chronic Dis. 1974;27:365–75. doi: 10.1016/0021-9681(74)90015-0. [DOI] [PubMed] [Google Scholar]
- 11.Early Breast Cancer Trialists Collaborative Group. Effects of radiotherapy and surgery in early breast cancer: an overview of randomized trials. N Engl J Med. 1995;333:1444–55. doi: 10.1056/NEJM199511303332202. [DOI] [PubMed] [Google Scholar]
- 12.Kalbfleisch JD, Prentice RL. The statistical analysis of failure time data. New York: John Wiley and Sons; 1980. [Google Scholar]
- 13.Gray RJ. A class of K-sample tests for comparing the cumulative incidence of a competing risk. Ann Stat. 1988;16:1141–1154. [Google Scholar]
- 14.Kaplan EL, Meier P. Nonparametric estimation from incomplete observations. J Amer Stat Assoc. 1958;53:457. [Google Scholar]
- 15.Mantel N. Evaluation of survival data and two new rank order statistics arising in its consideration. Cancer Chem Rep. 1966;5:163–170. [PubMed] [Google Scholar]
- 16.Cox DR. Regression models and life tables. J Royal Stat Soc (series B) 1972;34:187–229. [Google Scholar]
- 17.Rubin D, editor. Multiple imputations for nonresponse in surveys. New York: Wiley; 1987. [Google Scholar]
- 18.Bernier J, Cooper JS, Pajak TF, et al. Defining risk levels in locally advanced head and neck cancers: a comparative analysis of concurrent postoperative radiation plus chemotherapy trials of the EORTC (#22931) and RTOG (# 9501) Head Neck. 2005 Oct;27(10):843–50. doi: 10.1002/hed.20279. [DOI] [PubMed] [Google Scholar]
Associated Data
This section collects any data citations, data availability statements, or supplementary materials included in this article.