

Abstract
5-hydroxymethylcytosine (5-hmC), a derivative of 5-methylcytosine (5-mC), is abundant in the brain for unknown reasons. Our goal was to characterize the genomic distribution of 5-hmC and 5-mC in human and mouse tissues. We assayed 5-hmC using glucosylation coupled with restriction enzyme digestion, and interrogation on microarrays. We detected 5-hmC enrichment in genes with synapse-related functions in both human and mouse brain. We also identified substantial tissue-specific differential distributions of these DNA modifications at the exon-intron boundary, in both human and mouse. This boundary change was mainly due to 5-hmC in the brain, but due to 5-mC in non-neural contexts. This pattern was replicated in multiple independent datasets and with single molecule sequencing. Moreover, in human frontal cortex, constitutive exons contained higher levels of 5-hmC, relative to alternatively-spliced exons. Our study suggests a novel role for 5-hmC in RNA splicing and synaptic function in the brain.
The recent rediscovery of 5-hmC in mammals 1–3 demonstrates that covalent DNA modifications are more dynamic than previously believed. 5-hmC is generated by the oxidation of 5-mC, a reaction mediated by the Ten-Eleven Translocation (TET 1, 2 or 3) family of enzymes3. Traditional methods of assaying DNA modifications have either been unable to differentiate between 5-mC and 5-hmC (e.g. bisulfite mapping4) or have been specific for 5-mC (e.g. antibodies against 5-mC). Relative to other tissues, 5-hmC is particularly enriched in the brain, as observed in mice and humans 1,5. 5-mC at gene promoters suppresses transcription by recruiting transcriptional repressors 6. In the mouse cortex and cerebellum, 5-hmC is enriched within genes and appears to increase with increasing transcription levels 7,8. There is also accumulating evidence for 5-hmC as an intermediate in functional and literal DNA demethylation 9–12. Synchronous neuronal activity promotes active DNA demethylation of plasticity-related genes in the mouse brain via TET-mediated formation of 5-hmC 9; however, it is not known if such demethylation completely accounts for the enrichment of 5-hmC in the brain.
We mapped both 5-mC and 5-hmC in a variety of neuronal and non-neuronal tissues from mice and humans to investigate their respective roles. We labeled 5-hmC using the phage enzyme β-glucosyltransferase (BGT), followed by differential digestion of DNA with restriction enzymes either sensitive or insensitive to these DNA modifications (Fig. 1a). The resulting DNA fragments were amplified and interrogated on genome-wide tiling microarrays (Supplementary Table 1). This assay has the advantage of mapping modifications with up to single-CpG resolution, which was crucial for our ability to connect differences in DNA modifications to exon-intron boundaries.
Figure 1. 5-hmC measurement assay, array validation, and relationship to steady state mRNA levels.

(a) Experimental method for 5-hmC and 5-mC measurement on microarrays. (b) Volcano plots showing single microarray probe detection of 5-hmC in the mouse brain (top row, n = 11 samples) and liver (bottom row, n = 9 samples). Non-target sequences (left) are not affected by DNA glucosylation, resulting in a symmetric zero-centered distribution of intensities, while signals from target probes (right) are shifted to the upper-right, indicating protection of MspI targets after DNA glucosylation (orange rectangle; number beside rectangle shows probes that fall in the region). Mouse brain samples contain relatively larger 5-hmC densities as evidence. d by a greater shift in the corresponding volcano. X-axis: log difference in intensity of glucosylated DNA (gDNAglc) relative to unglucosylated DNA (gDNAref); y-axis: statistical significance of change (two-tailed t-test). (c) Average levels of 5-hmC (top) and 5-mC (bottom) in gene bodies (transcription start site to transcription end site) of various mouse tissues. Bars measure mean probe intensities (errors show standard error of mean); genes are grouped by deciles of increasing tissue-specific steady state mRNA levels. Black trendlines show number of probes per decile.
Results
Validation of 5-hmC assay
BGT transfers a glucose molecule specifically to the hydroxymethyl group of 5-hmC, thus rendering it resistant to digestion by the methylation insensitive MspI enzyme at the ChmCGG target site 13,14 (Supplementary Fig. 1a); 5-hmC is thus estimated by differential resistance to MspI-digestion with and without glucosylation of genomic DNA (gDNA). HpaII (targets the same site, CCGG) cannot cut CmCGG or ChmCGG, and conceptually its difference with MspI digestion is a measure of both 5-mC and 5-hmC. Subtraction of the 5-hmC estimate from the HpaII-based estimate therefore measures 5-mC. We validated the assay combining glucosylation and restriction enzyme digestion to measure 5-hmC with biochemical, molecular biological and in silico methods (Supplementary Fig. 1,2 and Supplementary Table 2,3). We verified that the addition of a glucose moiety to 5-hmC confers resistance to MspI digestion of modified oligonucleotides (Supplementary Fig. 1, 2) and that gDNA modifications can be measured on tiling microarrays (Fig. 1b).
For microarray normalization, we chose an algorithm that corrected for affinity bias due to probe sequence, a known issue for tiling arrays 15. We compared two sequence-based normalization algorithms using modification estimates from quantitative polymerase chain reaction (qPCR) (Supplementary Note 2, Supplementary Fig. 2a, Supplementary Table 2,3), and selected an algorithm described by Potter et al. 16 (Supplementary Note 1, equation 1). We also found that single probe estimates for 5-hmC or 5-mC provided less bias while maintaining precision for these data, as compared to averaging probe intensities in a local window (Supplementary Table 2). Despite the increased variance in single probe estimates, biological variability across samples significantly exceeded variability in technical replicates (Supplementary Fig. 2b; e.g. probe-wise increase due to biological variability, mean = 0.52, 95 % CI = [0.51,0.53], p < 10−16, one-sample t-test).
Average probe intensities had the relative magnitude expected from the three treatments: MspI-digested non-glucosylated gDNA had the lowest intensity (mean± SD = −1.45 ± 1.00; 134,521 target probes), followed by MspI-digested glucosylated gDNA (−1.35 ± 1.00); HpaII-digested non-glucosylated gDNA had the highest intensity (−0.81 ± 1.03). Negative values reflect the digestion (underrepresentation) of target sites relative to the baseline of undigested sequences.
Characterization of 5-mC and 5-hmC in adult mouse tissues
Using thin layer chromatography (TLC) and intensities from microarray probes, we verified that 5-hmC levels were the highest in mouse brain gDNA, compared to liver, kidney, pancreas and heart (Supplementary Table 4,5). This finding is consistent with previous reports 1,5. To investigate the origin of increased levels of 5-hmC in the brain, we identified genes and intergenic regions with significantly different 5-hmC in the mouse brain compared to other tissues. Of 134,521 probes that overlapped the non-repetitive genome (six chromosomes), 73,461 overlapped exactly one gene (defined by Mouse Genome Informatics (MGI) symbol; 2–238 probes per gene, median = 16.8). Out of 4,357 genes tested, 730 had different 5-hmC levels in the brain relative to the other tissues (repeated-measures analysis of variance (ANOVA), P < 10−2, false discovery rate (FDR) Q < 0.05; Supplementary Table 6). All but one gene had higher 5-hmC, and lower 5-mC, levels in the brain. Even within the brain, these genes contained above average 5-hmC levels (P < 10−4, bootstrapping (no replacement), median 5-hmC of randomly-sampled genes (R = 10,000)). Separately, we identified 83 differential intergenic probes that also had significantly higher 5-hmC levels in the brain (probe-wise linear regression, total of 60,721 intergenic probes, Q < 0.05; Supplementary Table 7).
We further explored possible associations of genic 5-hmC and steady-state mRNA levels in the mouse dataset. We related 5-hmC and 5-mC intensity levels from our microarrays to tissue-specific mRNA levels from a previously-published dataset 17 (Supplementary Note 1). In three out of five investigated tissues, 5-hmC showed a significant increase in genes with higher transcription (Fig. 1c, Supplementary Fig. 3). This trend was also observed in the brain, but did not reach statistical significance (P = 0.17, linear regression; Fig. 1c, Supplementary Fig. 3); the same was true for the 730 genes identified to have higher 5-hmC levels (P = 0.06, bootstrapping randomly-sampled genes (R=10,000)). In contrast, genic levels of 5-mC significantly decreased with increasing mRNA levels, in all five tissues (Fig. 1c and Supplementary Fig. 3).
Synaptic protein genes enriched for 5-hmC in mouse brain
To determine if the 730 genes obtained above had unifying cellular functions, we performed a functional overrepresentation analysis (ORA) (DAVID 18, background set of 4,357 genes tested). We observed that these genes were statistically overrepresented in 8 Gene Ontology (GO) terms (total 156 candidate terms), which in turn were associated with synapse function (Table 1). The top overrepresented terms were “cell adhesion” (Q = 1.3 × 10⁻⁶), “plasma membrane” (Q = 8.7 × 10⁻⁵), and “synapse” (Q = 3.5 × 10⁻⁴). These genes also had functional annotation clusters pertaining to ion channel activity, Rho GTPase signaling, and neuronal development (Supplementary Table 8). Interestingly, some of these 5-hmC rich genes showed transcript enrichment or specificity for non-neuronal brain cells. We identified the cell-type specificity of the 730 brain-enriched genes using a list from a previously published transcriptomic dataset of individual brain cell populations 19 (Supplementary Note 1). Using this list, 25 of the brain-enriched genes (3 %) have enriched transcription in astrocytes, 21 (3 %) in oligodendrocytes, and 57 (8 %) in neurons (Supplementary Table 9). By this definition, a few genes were also specific to the cell type (astrocytes: Rfx4, Gli3; oligodendrocytes: Elovl7, Cpm; neurons: Nts, Syt1, Nrg3, Trhde, Kcnc2, Clstn2).
Table 1.
Statistically overrepresented Gene Ontology categories in genes enriched for 5-hmC in the mouse brain, relative to that in other tissues.
| Term | Count | % | P | Q (BH) |
|---|---|---|---|---|
| GO:0022610, biological adhesion | 53 | 7.3 | 6.3 × 10⁻¹⁰ | 1.3 × 10⁻⁶ |
| GO:0007155, cell adhesion | 53 | 7.3 | 6.3 × 10⁻¹⁰ | 1.3 × 10⁻⁶ |
| GO:0005886, plasma membrane | 156 | 21.5 | 2.4 × 10⁻⁷ | 8.7 × 10⁻⁵ |
| GO:0045202, synapse | 33 | 4.5 | 1.9 × 10⁻⁶ | 3.5 × 10⁻⁴ |
| GO:0030054, cell junction | 41 | 5.6 | 1.2 × 10⁻⁵ | 1.4 × 10⁻³ |
| GO:0044459, plasma membrane part | 90 | 12.4 | 5.6 × 10⁻⁵ | 5.0 × 10⁻³ |
| GO:0044456, synapse part | 23 | 3.2 | 1.7 × 10⁻⁴ | 1.2 × 10⁻² |
| GO:0016337, cell-cell adhesion | 22 | 3.0 | 3.7 × 10⁻⁵ | 3.9 × 10⁻² |
We tested to see if the increase in brain 5-hmC observed in the 730 identified genes generalized to the entire functional class of synapse-related genes. We compared average 5-hmC in all genes mapped to the synapse-relevant GO terms to that in genes outside these categories (Supplementary Note 1) 20. Genes within each tested category (“synapse” and “synapse part”, “cell adhesion”, “plasma membrane”) had significantly higher 5-hmC levels (e.g. 5-hmC for “synapse”, n = 3,258 probes) compared to genes in other categories (n = 70,203; P = 3.2 × 10⁻²⁰, two-tailed Wilcoxon-Mann-Whitney (WMW) test; Fig. 2a, Supplementary Fig. 4). This effect persisted after controlling for GC content of the probe sequence, a parameter that could artificially influence probe intensity.
Figure 2. Levels of 5-hmC in mouse and human brains is higher in synapse-related genes, relative to other genes.
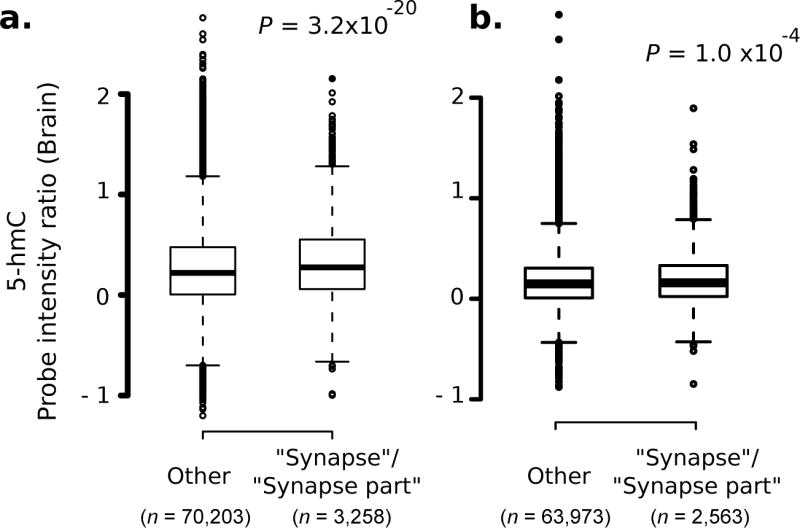
Intensity distribution of all probes in genes mapped to GO categories “synapse” and “synapse part”, relative to that in other genes. Data shown for (a) mouse and (b) human brain samples Mouse: six chromosomes, two-tailed WMW test. Human: six chromosomes, one-tailed WMW test. n denotes number of probes.
Enrichment of 5-hmC in synapse genes extends to human brain
We extended the comparison of 5-hmC enrichment in synapse-related genes to human brain by assaying gDNA from 28 human post-mortem brains (frontal cortex Brodmann area10 (BA10); Stanley Medical Research Institute and Harvard brain tissue resource center; demographic details in Supplementary Table 10). Human gDNA samples were processed the same way as the mouse gDNA samples (Supplementary Note 1), and interrogated on Affymetrix 2.0R human whole genome tiling microarrays E and F (Supplementary Table 1 for probe counts). Similar to the mouse brain, the human frontal cortex had higher 5-hmC levels within genes that mapped to the GO terms “synapse”, “synapse part”, “cell adhesion” and “plasma membrane” (“synapse” and “synapse part”: P = 1.0 × 10⁻⁴, one-tailed WMW test; Fig. 2b, Supplementary Fig. 5).
5-hmC marks the exon-intron boundary in the human brain
Several studies performed before the re-discovery of 5-hmC have noted a change in the density of modified cytosines at the exon-intron boundary of genes, with the density being higher on the exonic side 21,22. These studies, however, used bisulfite sequencing and therefore did not differentiate between 5-mC and 5-hmC. As our restriction enzyme-based assay provided single nucleotide resolution mapping of DNA modifications, we compared densities of each modification on either side of the exon-intron boundary (linear mixed-effects model, Online Methods). Distances to the boundary were measured from the second ‘C’ of the target sequence (‘CCGG’). DNA modification differences at exon-intron boundaries are reported for two regions: one immediate to the boundary (cumulative for the first 5 nucleotides, d = 5 bp) and one that captures the general peri-boundary trend (cumulative for the first 20 nucleotides, d = 20 bp). Relevant parameters (e.g. probe count) and statistics for all datasets are in Supplementary Table 11. Overall probe intensities for various DNA modifications in all datasets are in Supplementary Table 12.
Levels of all DNA modifications changed at the exon-intron boundary in human frontal cortex samples (n = 28 brain samples; Affymetrix tiling microarrays E and F, covering six chromosomes). Consistent with previous findings, we found higher densities of both modifications in exons relative to introns (d = 5, P = 2.8 × 10⁻⁷; and d = 20, P = 2.8 × 10−40; P-values from linear mixed-effects model unless otherwise stated; mean differences are not reported in the text as they are in arbitrary units of microarray intensity, and are not by themselves biologically meaningful). Most of this cross-boundary change in modification density was attributable to 5-hmC (d = 5 bp, P = 2.3 × 10⁻⁶; d = 20 bp, P = 2.8 × 10⁻²⁰; Fig. 3a, b). In contrast, 5-mC showed no changes closer to the boundary (d = 5 bp, P = 0.57) and relatively smaller exonic increases than 5-hmC for longer periboundary distances (d = 20 bp, P = 9.1 × 10⁻⁶; Fig. 3a, b). The change in 5-hmC, relative to 5-mC, was most evident in the first 5–10 bp from the boundary. For longer distances (up to 50 bp tested), both modifications showed robust increases in exons relative to introns (Fig. 3b, Supplementary Fig. 6a).
Figure 3. 5-hmC marks exon-intron boundaries in the human brain, and 5-mC marks that in the human liver.

(a) Probe intensities for 5-mC (left) and 5-hmC (right) as a function of distance from the boundary (28 brain samples, 6 chromosomes); x-axis: distance (bp) of modifiable cytosine from boundary. y-axis: median intensity of sample-averaged probes (5bp centered smoothing). P-values are from linear mixed-effects model (exon versus intron, d < 20bp from boundary); shading shows 95 % CI. (b) Cross-boundary differences for larger cumulative distances (d = 5–50 bp) from boundary. Inset: The dominant marking of 5-hmC was replicated in independent biological replicates (brain samples from patients diagnosed with psychosis, n = 54, 3 chromosomes). Shading shows 95%CI from bootstrapping exonic and intronic intensities separately. (c) Modifications in DNA from the human liver (n = 13, 3 chromosomes); left shows a detailed view around the boundary, while right shows cross-boundary changes at larger distances. Inset: Same view for age- and sex-matched brain samples done as a paired control. (d) Validation by single molecule sequencing. Left: Cross-boundary 5-hmC from a single human brain sample. Right: Relative exonic increase in % 5-hmC for cumulative distances from the boundary (d = 5–50 bp).
We also mapped DNA modifications in brain samples from patients diagnosed with schizophrenia and bipolar disorder 23, collectively termed “major psychosis” (n = 54 brain samples (frontal cortex BA10); Affymetrix tiling microarray E). Consistent with the findings in the control brain set reported above, gDNA from brains of psychosis patients also showed a predominant change in 5-hmC at the exon-intron boundary, at both distances (Fig. 3b inset, Supplementary Table 11 and Supplementary Fig. 6b).
To ascertain if the cross-boundary change was unique to brain tissue in humans, we analyzed human liver samples (n = 13) in parallel with age- and sex-matched frontal cortex samples (Supplementary Table 10). Here again, brain gDNA samples showed a larger change in 5-hmC than in 5-mC. In contrast, liver gDNA samples showed a predominant change in 5-mC, both at the boundary (d = 5, P = 4.8 × 10⁻⁶) and longer distances (d = 20, P = 4.8 × 10⁻¹²) (Fig. 3c, d, Supplementary Fig. 6c, d, Supplementary Table 11).
5-mC and 5-hmC boundary changes validated in human brain
We validated the findings in the human frontal cortex using three independent methods. First, to estimate the impact of GC differences in exons and introns, we compared probes representing introns to those representing exons, after matching for GC/AT content and distance from boundary (100 iterations to sample greater number of exonic probes). The overall trends of 5-hmC and 5-mC for matched probes were similar to those for unmatched probes (Supplementary Fig. 6e). 5-hmC cross-boundary differences were significant (p < 0.05, geometric mean of 100 iterations) for distances starting at d = 5 up to d = 35, while 5-mC showed a more modest gradual increase.
Second, we assayed 5-hmC by single molecule sequencing (SMS) (Helicos Biosciences Corp., Cambridge MA), which does not require PCR and microarray hybridization, thus eliminating artifacts due to DNA sequence composition 24. Genomic DNA from one frontal cortex sample was MspI-digested with or without prior glucosylation, followed by polyA end-labeling, and sequencing (Supplementary Note, Supplementary Table 13). Direct sequencing confirmed a sharp intronic decrease in 5-hmC at the exon-intron boundary (one-tailed WMW test, median exonic increase in 5-hmC =+ 4.6% for d = 20; P = 9.2 × 10⁻³; Fig. 3d, Supplementary Fig. 7). We were unable to accurately measure exon-intron differences for d = 5 due to a small number of reads 4 bp into the intron. However, the exonic increase in 5-hmC is evident for cumulative distances larger than 10 bp (Fig. 3d).
The third approach compared DNA enriched in 5-mC to a fraction depleted in 5-mC, separated using MethylMiner Methylated DNA Enrichment kit (Invitrogen; Supplementary Note 1). Each fraction was then subjected to the treatment as in Fig. 1a (n = 6 human frontal cortex samples; Supplementary Fig. 8a). We expected that if 5-mC levels in the brain actually changed across the exon-intron boundary, then we would detect a greater cross-boundary change in the 5-mC rich fraction relative to the depleted fraction. We did not observe such a change at the exon-intron boundary; in fact, intronic levels of 5-mC were slightly higher (P = 0.05, d = 20).
The above three control experiments collectively show that in the human frontal cortex, the change in 5-hmC at the exon-intron boundary exceeds that of 5-mC.
DNA modification at exon-intron boundaries in mouse tissues
To determine if the change in 5-hmC at exon-intron boundaries is unique to the human frontal cortex, we examined DNA in multiple mouse organs, including the mouse brain. Mouse brain samples (8 weeks old male C57/BL6) were split into frontal cortex and the remainder (including cerebellum and brain stem) (n = 15 samples per group, Affymetrix mouse tiling microarray A). The frontal cortex was analyzed separately to match the brain region investigated in human samples. Consistent with patterns in human brain, at d = 20 from the exon-intron boundary, the change in levels of DNA modifications were mainly due to 5-hmC in both frontal cortex (P = 7.5 × 10⁻⁶, linear mixed-effects model) and in the rest of the brain (P = 3.0 × 10⁻⁸) (Fig. 4a, b; Supplementary Table 11). In these contexts, the change in 5-hmC was not evident at the immediate boundary (e.g. P = 0.35 at d = 5 in frontal cortex), but rather was gradual over a region adjacent to the boundary. In contrast, 5-mC exhibited a more dramatic immediate cross-boundary change (P = 9 × 10⁻⁴ at d = 5) (Fig. 4a, b).
Figure 4. 5-hmC marks exon-intron boundaries in the mouse brain, but not in mouse organs of non-neural origin.

Peri-boundary modifications in DNA in the mouse brain: (a) frontal cortex, and (b) remainder (n = 15 animals per group, 3 chromosomes). Figure details are as those for Fig. 3. Left, middle: Median intensities around the exon-intron boundary. Right: Relative exonic increase at various cumulative distances from the boundary. (c) DNA modifications in non-neural mouse organs (n = 24 animals, 6 chromosomes; DNA from heart, liver, pancreas and kidney).
For non-neural organs, we used the mouse dataset described previously in this work (Supplementary Table 5; 36 samples from liver, pancreas, kidney, and heart, microarrays A and G). In agreement with the markings seen in the human liver, mouse organs of non-neural origin primarily had changes in cross-boundary densities of 5-mC (d = 5, P = 0.03), with a non-significant change in 5-hmC (d = 5, P = 0.25) (Fig. 4c, Supplementary Table 11). Although both types of DNA modifications show relatively higher exonic densities at the larger peri-boundary regions (d = 20), the magnitude of change in 5-mC (P = 3.4 × 10⁻¹⁹) exceeded that of 5-hmC (P = 5.7 × 10⁻³) (Fig. 4c).
5-mC and 5-hmC at the exon-intron boundary in cell lines
We next assayed a murine neuronal cell line which had undetectable (< 1%) global levels of 5-hmC measured by TLC (mHypoA-2/24; n = 18 samples, Supplementary Table 12). The microarray analysis, which is more sensitive to region-specific differences than TLC, detected a marginally significant change in 5-hmC at d = 20 (P = 0.045, linear mixed-effects model) and a highly significant difference in 5-mC (P = 1.6 × 10⁻¹⁷) (Supplementary Fig. 8b and Supplementary Table 11).
We also examined boundary differences in a B-lymphocyte dataset where cells were treated with suberoylanilide hydroxamic acid (SAHA). Histone deacetylase (HDAC) inhibitors like SAHA may promote DNA demethylation 25, and have also been shown to induce changes in pre-mRNA splicing 26. We examined whether SAHA induces changes in DNA modifications at the exon-intron junction. Vehicle-treated B lymphocytes (no SAHA) showed no 5-hmC exon-intron differences at d = 20 (P = 0.27); however, SAHA-treated cells showed an increase in the cross-boundary differences in a manner roughly corresponding to increasing doses of SAHA (P = 0.01, 8.8 × 10⁻⁴, and 3.6 × 10⁻⁴ for 0.01 μM, 0.02 μM and 0.1 μM of SAHA, respectively) (Supplementary Fig. 9, Supplementary Table 11).
Exonic 5-hmC and exon inclusion levels
Changes in DNA modifications at exon-intron boundaries may impact exon recognition and exon inclusion levels. To investigate this possibility, we measured 5-hmC as a function of exon inclusion levels, using RNAseq data for human frontal cortex and liver 27 (Online methods). Exon inclusion levels were measured as the proportion of transcripts that include a given exon; exons were classified as being alternatively-spliced (exon included in ≤ 80 % of gene transcripts) or constitutive (exon included in 100 % of gene transcripts) (Online Methods). We observed that, at d = 20, the median 5-hmC density was lower in alternatively-spliced exons, relative to constitutive exons (P = 0.04, two-tailed WMW test; see Supplementary Table 14 for probe counts and exon sampling), but it was not different for 5-mC (d = 20, P = 0.61); number of probes at d = 5 were too small for a meaningful comparison. The 5-hmC effect was even stronger at the level of the whole exon (P = 8.4 × 10⁻⁵); here a marginal change was observed in 5-mC levels (P = 0.025, Fig. 5a). The increase in 5-hmC was still borderline significant after probes in alternative and constitutive exons were matched for GC content (1000 iterations, 197 probes per group; geometric mean of P = 0.07 for 5-hmC and P = 0.08 for 5-mC). In the liver, neither 5-hmC nor 5-mC was different among the two types of exons (P = 0.13 for 5-hmC, P = 0.38 for 5-mC, Supplementary Table 14) (Fig. 5b).
Figure 5. Constitutive exons have higher 5-hmC levels than alternatively-spliced exons in human brain.
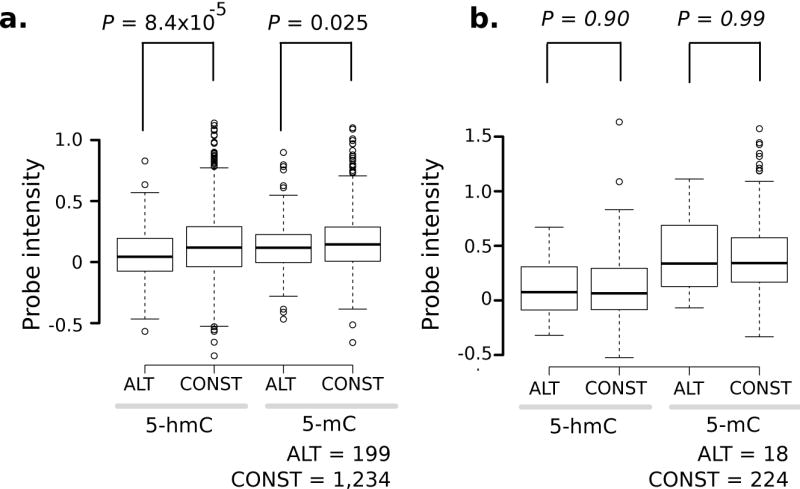
Comparison of probe-level intensities of each modification in alternatively-spliced (ALT) and constitutive (CONST) exons. Comparisons were made for (a) human brain and (b) human liver. P-values are from two-tailed WMW (α = 0.05). Probe count shown under boxplots for each panel; see Supplementary Table 14 for other details.
Separately, we found that average exonic 5-hmC in intron-less – or single exon – genes was lower than that in genes with multiple exons. For this analysis we used tiling array data for control human brains over six chromosomes (arrays E and F, 28 samples, sample median used for each probe; RefSeq gene definitions were used; within each category, duplicate bases were collapsed. We found that exonic 5-hmC in single-exon genes was statistically different from that in multi-exon genes (median, intronless = 0.06, multi-exon = 0.073; P = 0.026, two-tailed WMW; n: intronless = 1,256 probes, multi-exon = 22,500 probes). This finding is consistent with an exonic change in 5-hmC due to gene splicing.
Collectively, the results suggest that the density of 5-hmC proximal to splice sites and within exons could impact splicing and affect exon inclusion levels in the mammalian brain.
Discussion
In this study, we adapted a 5-hmC detection strategy that uses glucosylation-induced resistance to restriction enzymes for tiling microarray-based mapping of 5-hmC. The glucosylation-based detection of 5-hmC has been successfully used in other studies 7,8,28. Our microarray-based quantification of DNA modifications (verified by TLC) showed significantly higher levels of 5-hmC in brain as compared to other tissues, which is consistent with previous reports 1,5. We identified a large number of genes with higher densities of 5-hmC in the brain compared to those in heart, liver, kidney, and pancreas. More generally, we discovered a trend where 5-hmC in the gene body increases with increased transcription of the corresponding gene, while 5-mC decreases. This is consistent with the observation that 5-hmC prevents the binding of transcriptional repressor proteins and is found within actively-transcribed genes 7,29–31. Interestingly, the association between genic 5-hmC and mRNA levels was weakest in the brain (P = 0.17), suggesting that in addition to the regulation of gene activity 5-hmC may have other functions in the cell.
Functional annotation analysis revealed a statistical overrepresentation of terms pertaining to synaptic plasticity in genes enriched for 5-hmC in the brain. In particular, annotation clusters were composed of protein groups involved in distinct aspects of synaptic remodelling: ion channels, members of the Rho GTPase signalling pathway, and axon guidance molecules. Notably, most genes in these clusters encode proteins that are functionally located at the plasma membrane, rather than being cytosolic. The observation that 5-hmC is overrepresented in the genes controlling synaptic plasticity may shed a new light on the epigenetics of learning and memory. Adult animals with conditional double knockouts of genes encoding DNA methyltransferase 1 and 3b (Dnmt1 and Dnmt3b) in the cerebral cortex showed learning and memory defects in hippocampal-dependent learning tasks, suggesting that changes in DNA methylation occur in post-mitotic neurons 32. Fear conditioning, an experimental paradigm for emotional learning, results in the demethylation and transcriptional activation of reelin (RELN) 33. Recent mappings of 5-hmC in the brain have remarked a generation of 5-hmC and demethylation in response to neuronal activity, but the degree to which the two correspond is not completely clear 9,34. In the absence of DNA replication in post-mitotic neurons, it is possible that loci undergoing gene reactivation via DNA demethylation accumulate 5-hmC over time. Experiments that map 5-hmC over the course of multiple gene reactivations will explore whether, in the context of synaptic activity, this base marks a stable epigenetic state, or if it is an intermediate in cycles including complete demethylation (i.e. conversion to unmodified cytosines).
In addition to transcriptional regulation, it is possible that 5-hmC and 5-mC may impact the process of pre-mRNA splicing. Our finding of boundary changes in all modified cytosines replicates earlier observations that used bisulfite modification and sequencing 22,35,36. The separation of the two DNA modifications in our study showed that 5-hmC, rather than 5-mC, accounts for most of the density difference at the immediate exon-intron boundary in human frontal cortex samples. This finding was validated by three control experiments: comparison of GC/AT matched probes, Helicos single molecule sequencing, and methyl-binding domain (MBD)-enriched 5-mC mapping. While the mouse brain samples show a predominant change in 5-hmC at longer peri-boundary distances, the main change within the first 10 bp of the boundary was in 5-mC.
The non-neural tissues investigated included human liver and four mouse organs (liver, pancreas, heart and kidney). While these tissues had measurable levels of genomic 5-hmC density by TLC, modification changes at the exon-intron boundary were mainly due to 5-mC. In contrast to the pattern observed in the brain, peri-boundary changes in 5-hmC were relatively minor in these tissues. These findings suggest that any splicing-related functions DNA modification may have in non-neural organs are mediated mainly by 5-mC rather than 5-hmC. Separately, we found that B-lymphocytes show increased 5-hmC differences at the exon-intron boundary upon treatment with SAHA. SAHA is a chemotherapeutic agent that acts as a HDAC inhibitor and may promote DNA demethylation 25. As the dose used in this study is comparable to those in plasma of patients treated for cancer with SAHA 37, 5-hmC changes at the exon-intron boundary may also be expected to take place in vivo. Hence, it is also possible that such changes in 5-hmC in response to HDAC inhibition could also contribute to alternative splicing 26.
Previous studies have reported that exons are enriched in the histone modifications H3K36me3, H3K4me3, and H3K27me2, relative to flanking intronic regions 38–40. These modifications can recruit splicing regulators to impact alternative splicing of nascent transcripts 41. While the resolution of histone maps is limited by the size of nucleosomal DNA (147 bp), our DNA modification studies have identified changes in modification levels within 20 bp (and in some cases, within 5 bp) surrounding the exon-intron boundary. This precision argues for a specific effect at the exon-intron boundary as well as a possible difference between exons and introns as a whole, as described in earlier studies 34. Our finding that 5-hmC densities are lower in alternatively-spliced exons, relative to constitutive exons, complements the observation that H3K36me3 is less enriched in alternatively-spliced exons 39,42,43. DNA methylation has been shown to modulate exon inclusion levels by influencing rate of transcript elongation in B-lymphocytes. Lack of DNA methylation can promote exon inclusion by causing ‘pauses’ in RNA Polymerase II (RNA PolII)-mediated elongation, and may also affect RNA PolII elongation-dependent changes in alternative splicing by affecting the binding of the transcriptional repressor CTCF 44. There may also be other mechanisms by which DNA methylation could influence exon inclusion levels, for example, through the recruitment of splicing factors via methyl binding proteins.
Our findings suggest that tissue-specific distributions of 5-hmC or 5-mC at the exon-intron boundary, and within genes, may simultaneously influence both transcription and splicing. The direction of the influence remains unclear, as transcription and splicing may also affect epigenetic DNA modifications, and mechanisms for cross-talk likely exist between epigenetic regulation, splicing, and transcription 45,46.
Online Methods
Experimental outline
Our experimental strategy exploited the ability of the β-glucosyltransferase (BGT) enzyme of T4 phage to transfer a monomeric glucose residue from uridine diphospho-α-D-glucose (UDP-Glc) to the exocyclic hydroxyl group of 5-hmC in double-stranded DNA. This specific addition of a glucose moiety to 5-hmC blocks access of methylation insensitive endonucleases to their target sites thus making the DNA fragment resistant to digestion 1,2. Here we used isoschizomer restriction enzymes, HpaII and MspI, where HpaII only cleaves DNA when the CpG dinucleotide is unmethylated at CCGG, while MspI cleaves the CCGG sites independently of any natural CpG modification, including 5-mC and 5-hmC 3,4.
Microarray experiments were performed as illustrated in Fig 1. Each genomic DNA sample was split into three parts, one of which was subjected to BGT glucosylation and two of which were not glucosylated (details in Supplementary Note). One unglucosylated part was treated with MspI, serving as a baseline for digestion. The second unglucosylated part was treated with HpaII, which spares any modified cytosines at the recognition site. The BGT-glucosylated part was treated with MspI, and 5-hmC was measured as the decrease in digestion of this part, relative to the unglucosylated part. The difference between HpaII and MspI restriction efficacy on unglucosylated DNA reflected the sum of all modifications, and the difference between all modifications and 5-hmC was the measure of 5-mC.
Sample description
This study utilized datasets from various mouse organs, human brain and liver, and two cell lines. Male C57BL/6J mouse brain tissues (frontal cortex and remaining brain) and other organs (liver, pancreas, kidney, and heart) were obtained from 8-week old mice (Supplementary Table 5). All human brain samples were obtained from the Stanley Medical Research Institute brain collection (courtesy of Drs. Michael B. Knable, E. Fuller Torrey, Maree J. Webster, and Robert H. Yolken) and from the Harvard Brain Tissue Resource Center (courtesy of Dr. F. Benes). Human liver samples were obtained from commercial databanks (Curline (USA) and Cambridge Biosc (UK)). Liver samples were age- and sex-matched to brain samples. Demographic details are provided in Supplementary Table 10. Genomic DNA isolation was performed by standard proteinase K and phenol chloroform extraction.
Sample preparation for glucosylation and endonuclease restriction digestion
From each tissue, two 1 μg samples of genomic DNA were sheared to a 200 bp fragment length using a Covaris S2 sonifier (Covaris, USA). Sheared DNA was end-filled in the presence of T4 DNA polymerase (5 U) at 11°C for 20 min and purified using PN buffer from the QIAquick Nucleotide Removal Kit (Qiagen). The purified 1 μg of blunt-ended DNA was ligated with A1–25 adapters (10 μM) (Supplementary Table 15) in the presence of T4 DNA ligase (10 U) at 22°C for 3 h, inactivated at 65°C for 10 min, and purified with the QIAquick Nucleotide Removal Kit. One third (~300ng) of the purified DNA was treated with 200 μM uridine-5′-diphospho-α-D-glucose (UDP-Glc, Sigma), 80 ng BGT 5 in 100 mM Tris-HCl (pH 8.0) and 25 mM MgCl2 for 3 h at 37°C, and purified again. Thereafter, 200 ng of glucosylated DNA and 200 ng of untreated DNA were subjected to MspI digestion in a final volume of 20 μl for 12 h at 37°C, followed by enzyme inactivation at 80°C for 10 min. The same protocol was performed on 200 ng of untreated DNA using HpaII. Following the observation that some 5-hmC may be resistant to MspI digestion 6, we used 10 units of enzyme (50 fold surplus of the enzyme over the DNA substrate digested for 12 h). Restriction enzyme digested genomic DNA from each scenario was PCR amplified using adapter-specific primers (Supplementary Table 15). Amplified PCR products were fragmented, biotin-labeled, and hybridized on Affymetrix whole-genome tiling arrays (Supplementary Table 1), and scanned as described in the Affymetrix Chromatin Immunoprecipitation Assay protocol (http://media.affymetrix.com/support/downloads/manuals/chromatin_immun_ChIP.pdf)
Microarray data preprocessing
We distinguished between three types of probes on the whole-genome tiling microarray: “target probes”, which contain the restriction site CCGG, “flanking probes”, which do not contain the recognition sequence but could lie up to 200 bp upstream or downstream of a target probe (sheared DNA fragments were of average 200 bp), and “non-target probes” that neither contain a target sequence nor are within 200 bp (on either side) of the target sequence. Non-target probes are unaffected by enzymatic cleavage, and therefore, can be used as a baseline for array normalization. After comparing different array preprocessing algorithms (Supplementary Note), we chose to use a sequence-based algorithm after Potter et al.7.
The model (Supplementary Note, equation 1) was applied to non-target probes matched proportionally to target probes by GC content. Normalized intensities were obtained by subtracting the fitted value from raw probe intensities, resulting in a normal distribution of probe-level intensities. Each chip was independently normalized. All downstream analyses were carried out at the single-probe level (i.e. without windowing or peak-calling) and solely on target probes (henceforth referred to simply as ‘probes’). 5-hmC was measured as the log-difference between glucosylated DNA and native DNA following treatment with MspI (Fig. 1a). The sum of all the DNA modifications was measured as the log-difference between HpaII-treated unglucosylated DNA and MspI-treated unglucosylated DNA. 5-mC was estimated by the difference between all DNA modifications and 5-hmC.
Following normalization, probes overlapping repeats were excluded (RepeatMasker, simple repeats and segmental duplications; genomic annotations from UCSC genome browser, build mm8 for mouse, hg18 for human). Information on arrays and probe counts are listed in Supplementary Table 1. Unless otherwise specified, analysis was done using R software and BioConductor 8.
For the exon-intron boundary analysis, probes were required to have a ‘CCGG’ in both the Affymetrix probe sequence and the chromosomal sequence downloaded from UCSC; probes that did not meet this criterion were excluded.
Identification of 5-hmC enriched regions in mouse brain
Probes were filtered for those overlapping genes on either strand (RefSeq genes (refGene) downloaded from UCSC, mm8; range between txStart and txEnd columns). Probes overlapping multiple genes (gene defined by MGI gene symbol) were excluded, as were genes containing exactly one probe, resulting in 73,461 probes over 4,357 genes (range = 2 to 238 probes per gene, mean = 17). A repeated-measures ANOVA was conducted on probes in each gene, with tissue as a between-groups factor (‘Brain’ = 11 samples, ‘Other’ = 36 samples (9 each of liver, heart, kidney, pancreas)), and the biological sample as a within-groups error term. Probes within a gene were not averaged across samples, nor collapsed within a gene. Gene-wise nominal p-values were adjusted using the Benjamini-Hochberg method of FDR correction (BH; α = 0. 01). 730 genes had Q-values < 5 %; all but one of these had higher 5-hmC in the brain, and are therefore called ‘brain-enriched’.
Calculation of exon-intron boundary differential
Boundary regions were defined as regions at a certain distance on both sides of an exon start or end (RefSeq genes, internal exons only). Where multiple exons had the same extent ([chromosome, start, end] location), only one such exon was retained. For each probe, the distance from the modifiable C (of CCGG) was computed to the nearest exon (or intron) boundary; this value is the boundary distance of the probe (a value of zero was exonic in these calculations). Statistics were computed on probes that lay 5 or 20 bp on either side of the junction. The result at a distance of 20 bp reflected the general trend observed at the boundary, while that at 5 bp reflected immediate cross-boundary change. A linear mixed-effects model 9 was used to test probe intensity differences between the exonic and intronic side of the junction. Junction side was used as the fixed-effects term, and array type and sample were treated as random-effects terms (Supplementary Note); α = 0. 025 was used to indicate a statistically significant result.
Correlation of 5-hmC with exon inclusion levels
RNAseq from liver and cortex 10 were analyzed to identify cassette exons and their respective inclusion levels. Thresholds used to identify cassette exons are described in Supplementary Note. The inclusion level of an exon was defined as the proportion of gene transcripts in which the exon was present:% Exon Inclusion = 100*(sum(CiA)+ sum(ACj))/((sum(CiA)+ sum(ACj) + 2*(sum(CiC2)+ sum(C1Cj))), where Ci is any possible splicing donor upstream the alternative exon (including C1), and Cj any possible splicing acceptor downstream the alternative exon (including C2). Exons with multiple acceptor or donor splice sites or not supported by RNA-Seq were excluded. We defined an exon as ‘alternatively-spliced’ if the inclusion level was less than 80%, and as ‘constitutive’ if inclusion was 100 %. DNA methylation was assessed in those exons that overlapped ‘target probes’ (probes containing CCGG) (probe counts in Supplementary Table 14). Methylation levels of exons were computed at the whole-exon level and at d = 20 bp away from the boundary. Sample-averaged median probe intensities were compared between probes overlapping constitutive and alternative exons (two-tailed WMW test, α = 0. 05).
Methods Reference List
- 1.Huang LH, Farnet CM, Ehrlich KC, Ehrlich M. Digestion of highly modified bacteriophage DNA by restriction endonucleases. Nucleic Acids Res. 1982;10:1579–91. doi: 10.1093/nar/10.5.1579. [DOI] [PMC free article] [PubMed] [Google Scholar]
- 2.Josse J, Kornberg A. Glucosylation of deoxyribonucleic acid. III. alpha- and beta-Glucosyl transferases from T4-infected Escherichia coli. J Biol Chem. 1962;237:1968–1976. [PubMed] [Google Scholar]
- 3.Jin SG, Kadam S, Pfeifer GP. Examination of the specificity of DNA methylation profiling techniques towards 5-methylcytosine and 5-hydroxymethylcytosine. Nucleic Acids Res. 2010;38:e125. doi: 10.1093/nar/gkq223. [DOI] [PMC free article] [PubMed] [Google Scholar]
- 4.Tardy-Planechaud S, Fujimoto J, Lin SS, Sowers LC. Solid phase synthesis and restriction endonuclease cleavage of oligodeoxynucleotides containing 5-(hydroxymethyl)-cytosine. Nucleic Acids Res. 1997;25:553–559. doi: 10.1093/nar/25.3.553. [DOI] [PMC free article] [PubMed] [Google Scholar]
- 5.Lariviere L, Kurzeck J, Aschke-Sonnenborn U, Ruger W, Morera S. Crystallization and preliminary crystallographic study of a ternary complex between the T4 phage beta-glucosyltransferase, uridine diphosphoglucose and a DNA fragment containing an abasic site. Acta Crystallogr D Biol Crystallogr. 2002;58:1484–6. doi: 10.1107/S0907444902012969. [DOI] [PubMed] [Google Scholar]
- 6.Ichiyanagi K. Inhibition of MspI cleavage activity by hydroxymethylation of the CpG site: a concern for DNA modification studies using restriction endonucleases. Epigenetics. 2012;7:131–6. doi: 10.4161/epi.7.2.18909. [DOI] [PubMed] [Google Scholar]
- 7.Potter DP, Yan P, Huang THM, Lin S. Probe signal correction for differential methylation hybridization experiments. BMC Bioinformatics. 2008;9:453. doi: 10.1186/1471-2105-9-453. [DOI] [PMC free article] [PubMed] [Google Scholar]
- 8.Gentleman RC, et al. Bioconductor: open software development for computational biology and bioinformatics. Genome Biol. 2004;5:R80. doi: 10.1186/gb-2004-5-10-r80. [DOI] [PMC free article] [PubMed] [Google Scholar]
- 9.Vittinghoff E, GDV, Shiboski SC, McCulloch CE. Regression Methods in Biostatistics. 2005:253–290. [Google Scholar]
- 10.Brawand D, et al. The evolution of gene expression levels in mammalian organs. Nature. 2011;478:343–8. doi: 10.1038/nature10532. [DOI] [PubMed] [Google Scholar]
Supplementary Material
Acknowledgments
We thank Nicole Miller and Christopher Austin (The National Center for Advancing Translational Sciences, NIH) for providing cell lines for the SAHA experiment. We also thank Jean-Sebastien Doucet (Centre for Addiction and Mental Health) for assistance with mouse brain sample preparation. This research has been supported by the Canadian Institutes of Health Research (grants 199170 and 186007) and the US National Institutes of Health (grants MH074127, MH088413, DP3DK085698, HG005758 and HG004535) to A.P. and Canadian Institutes of Health Research grants to B.J.B., by the Research Council of Lithuania and the French Ministry of foreign and European affairs under the Lithuania-France bilateral collaboration program Gilibert (grant TAP-13/2011–2012) to S.M. and S.K. and the European Social Fund under the Global Grant measure (grant VP1-3.1- MM-07-K-01-105) to S.K. A.P. is Tapscott Chair in Schizophrenia Studies at the University of Toronto and a senior fellow of the Ontario Mental Health Foundation. M.I. is a recipient of a Human Frontier Science Program Organization Long Term Fellowship.
Footnotes
Author contributions
S.K., A.P., T.K. and S.P. conceived the study and designed the experiments. S.M., E.K., Z.L., and S.K. developed and verified the methods for 5-hmC detection. T.K., M.P., M.T., P.J., C.P., V.L., A.N., D.B., and A.W. conducted the microarray experiments. S.P., K.K., P.K., S.C.W., and R.K. developed bioinformatics methods and analyzed microarray data. P.K., T.K., S.P. and A.P. contributed to the design and data analysis of the Helicos sequencing experiment. M.X. and R.T. generated SAHA treated cell lines. M.I. and B.B. generated the lists of alternative and constitutive exons and perform 5-hmC comparisons. T.K., S.P., V.L., S.K., A.P. wrote the manuscript. All authors reviewed the manuscript.
References
- 1.Kriaucionis S, Heintz N. The nuclear DNA base 5-hydroxymethylcytosine is present in Purkinje neurons and the brain. Science. 2009;324:929–930. doi: 10.1126/science.1169786. [DOI] [PMC free article] [PubMed] [Google Scholar]
- 2.Penn NW, Suwalski R, O’Riley C, Bojanowski K, Yura R. The presence of 5-hydroxymethylcytosine in animal deoxyribonucleic acid. Biochem J. 1972;126:781–790. doi: 10.1042/bj1260781. [DOI] [PMC free article] [PubMed] [Google Scholar]
- 3.Tahiliani M, et al. Conversion of 5-methylcytosine to 5-hydroxymethylcytosine in mammalian DNA by MLL partner TET1. Science. 2009;324:930–935. doi: 10.1126/science.1170116. [DOI] [PMC free article] [PubMed] [Google Scholar]
- 4.Huang Y, et al. The behaviour of 5-hydroxymethylcytosine in bisulfite sequencing. PloS one. 2010;5:e8888. doi: 10.1371/journal.pone.0008888. [DOI] [PMC free article] [PubMed] [Google Scholar]
- 5.Globisch D, et al. Tissue distribution of 5-hydroxymethylcytosine and search for active demethylation intermediates. PLoS One. 2010;5:e15367. doi: 10.1371/journal.pone.0015367. [DOI] [PMC free article] [PubMed] [Google Scholar]
- 6.Deaton AM, Bird A. CpG islands and the regulation of transcription. Genes Dev. 2011;25:1010–22. doi: 10.1101/gad.2037511. [DOI] [PMC free article] [PubMed] [Google Scholar]
- 7.Jin SG, Wu X, Li AX, Pfeifer GP. Genomic mapping of 5-hydroxymethylcytosine in the human brain. Nucleic Acids Res. 2011 doi: 10.1093/nar/gkr120. [DOI] [PMC free article] [PubMed] [Google Scholar]
- 8.Song CX, et al. Selective chemical labeling reveals the genome-wide distribution of 5-hydroxymethylcytosine. Nat Biotechnol. 2011;29:68–72. doi: 10.1038/nbt.1732. [DOI] [PMC free article] [PubMed] [Google Scholar]
- 9.Guo JU, Su Y, Zhong C, Ming GL, Song H. Hydroxylation of 5-methylcytosine by TET1 promotes active DNA demethylation in the adult brain. Cell. 2011;145:423–34. doi: 10.1016/j.cell.2011.03.022. [DOI] [PMC free article] [PubMed] [Google Scholar]
- 10.He YF, et al. Tet-mediated formation of 5-carboxylcytosine and its excision by TDG in mammalian DNA. Science. 2011;333:1303–7. doi: 10.1126/science.1210944. [DOI] [PMC free article] [PubMed] [Google Scholar]
- 11.Ito S, et al. Tet proteins can convert 5-methylcytosine to 5-formylcytosine and 5-carboxylcytosine. Science. 2011;333:1300–3. doi: 10.1126/science.1210597. [DOI] [PMC free article] [PubMed] [Google Scholar]
- 12.Zhang L, et al. Thymine DNA glycosylase specifically recognizes 5-carboxylcytosine-modified DNA. Nat Chem Biol. 2012;8:328–30. doi: 10.1038/nchembio.914. [DOI] [PMC free article] [PubMed] [Google Scholar]
- 13.Huang LH, Farnet CM, Ehrlich KC, Ehrlich M. Digestion of highly modified bacteriophage DNA by restriction endonucleases. Nucleic Acids Res. 1982;10:1579–91. doi: 10.1093/nar/10.5.1579. [DOI] [PMC free article] [PubMed] [Google Scholar]
- 14.Josse J, Kornberg A. Glucosylation of deoxyribonucleic acid. III. alpha- and beta-Glucosyl transferases from T4-infected Escherichia coli. J Biol Chem. 1962;237:1968–1976. [PubMed] [Google Scholar]
- 15.Liu XS. Getting started in tiling microarray analysis. PLoS Comput Biol. 2007;3:1842–4. doi: 10.1371/journal.pcbi.0030183. [DOI] [PMC free article] [PubMed] [Google Scholar]
- 16.Potter DP, Yan P, Huang THM, Lin S. Probe signal correction for differential methylation hybridization experiments. BMC Bioinformatics. 2008;9:453. doi: 10.1186/1471-2105-9-453. [DOI] [PMC free article] [PubMed] [Google Scholar]
- 17.Lattin JE, et al. Expression analysis of G Protein-Coupled Receptors in mouse macrophages. Immunome Res. 2008;4:5. doi: 10.1186/1745-7580-4-5. [DOI] [PMC free article] [PubMed] [Google Scholar]
- 18.Huang DW, Sherman BT, Lempicki RA. Systematic and integrative analysis of large gene lists using DAVID bioinformatics resources. Nat Protoc. 2009;4:44–57. doi: 10.1038/nprot.2008.211. [DOI] [PubMed] [Google Scholar]
- 19.Cahoy JD, et al. A transcriptome database for astrocytes, neurons, and oligodendrocytes: a new resource for understanding brain development and function. J Neurosci. 2008;28:264–78. doi: 10.1523/JNEUROSCI.4178-07.2008. [DOI] [PMC free article] [PubMed] [Google Scholar]
- 20.Balsa-Canto E, Banga JR. AMIGO, a toolbox for advanced model identification in systems biology using global optimization. Bioinformatics. 2011;27:2311–3. doi: 10.1093/bioinformatics/btr370. [DOI] [PMC free article] [PubMed] [Google Scholar]
- 21.Chodavarapu RK, et al. Relationship between nucleosome positioning and DNA methylation. Nature. 2010;466:388–92. doi: 10.1038/nature09147. [DOI] [PMC free article] [PubMed] [Google Scholar]
- 22.Laurent L, et al. Dynamic changes in the human methylome during differentiation. Genome Res. 2010;20:320–331. doi: 10.1101/gr.101907.109. [DOI] [PMC free article] [PubMed] [Google Scholar]
- 23.Torrey EF, Webster M, Knable M, Johnston N, Yolken RH. The stanley foundation brain collection and neuropathology consortium. Schizophr Res. 2000;44:151–5. doi: 10.1016/S0920-9964(99)00192-9. [DOI] [PubMed] [Google Scholar]
- 24.Hart C, et al. Single-molecule sequencing: sequence methods to enable accurate quantitation. Methods Enzymol. 2010;472:407–30. doi: 10.1016/S0076-6879(10)72002-4. [DOI] [PubMed] [Google Scholar]
- 25.Ou JN, et al. Histone deacetylase inhibitor Trichostatin A induces global and gene-specific DNA demethylation in human cancer cell lines. Biochem Pharmacol. 2007;73:1297–307. doi: 10.1016/j.bcp.2006.12.032. [DOI] [PubMed] [Google Scholar]
- 26.Hnilicova J, et al. Histone deacetylase activity modulates alternative splicing. PLoS One. 2011;6:e16727. doi: 10.1371/journal.pone.0016727. [DOI] [PMC free article] [PubMed] [Google Scholar]
- 27.Brawand D, et al. The evolution of gene expression levels in mammalian organs. Nature. 2011;478:343–8. doi: 10.1038/nature10532. [DOI] [PubMed] [Google Scholar]
- 28.Davis T, Vaisvila R. High sensitivity 5-hydroxymethylcytosine detection in Balb/C brain tissue. J Vis Exp. 2011 doi: 10.3791/2661. [DOI] [PMC free article] [PubMed] [Google Scholar]
- 29.Jin SG, Kadam S, Pfeifer GP. Examination of the specificity of DNA methylation profiling techniques towards 5-methylcytosine and 5-hydroxymethylcytosine. Nucleic Acids Res. 2010;38:e125. doi: 10.1093/nar/gkq223. [DOI] [PMC free article] [PubMed] [Google Scholar]
- 30.Kondo E, Gu Z, Horii A, Fukushige S. The thymine DNA glycosylase MBD4 represses transcription and is associated with methylated p16(INK4a) and hMLH1 genes. Mol Cell Biol. 2005;25:4388–96. doi: 10.1128/MCB.25.11.4388-4396.2005. [DOI] [PMC free article] [PubMed] [Google Scholar]
- 31.Valinluck V, et al. Oxidative damage to methyl-CpG sequences inhibits the binding of the methyl-CpG binding domain (MBD) of methyl-CpG binding protein 2 (MeCP2) Nucleic Acids Res. 2004;32:4100–4108. doi: 10.1093/nar/gkh739. [DOI] [PMC free article] [PubMed] [Google Scholar]
- 32.Feng J, et al. Dnmt1 and Dnmt3a maintain DNA methylation and regulate synaptic function in adult forebrain neurons. Nat Neurosci. 2010;13:423–430. doi: 10.1038/nn.2514. [DOI] [PMC free article] [PubMed] [Google Scholar]
- 33.Miller CA, Sweatt JD. Covalent modification of DNA regulates memory formation. Neuron. 2007;53:857–69. doi: 10.1016/j.neuron.2007.02.022. [DOI] [PubMed] [Google Scholar]
- 34.Szulwach KE, et al. 5-hmC-mediated epigenetic dynamics during postnatal neurodevelopment and aging. Nat Neurosci. 2011;14:1607–16. doi: 10.1038/nn.2959. [DOI] [PMC free article] [PubMed] [Google Scholar]
- 35.Chodavarapu RK, et al. Relationship between nucleosome positioning and DNA methylation. Nature. 2010;466:388–92. doi: 10.1038/nature09147. [DOI] [PMC free article] [PubMed] [Google Scholar]
- 36.Hodges E, et al. High definition profiling of mammalian DNA methylation by array capture and single molecule bisulfite sequencing. Genome Res. 2009;19:1593–605. doi: 10.1101/gr.095190.109. [DOI] [PMC free article] [PubMed] [Google Scholar]
- 37.Kelly WK, et al. Phase I study of an oral histone deacetylase inhibitor, suberoylanilide hydroxamic acid, in patients with advanced cancer. J Clin Oncol. 2005;23:3923–31. doi: 10.1200/JCO.2005.14.167. [DOI] [PMC free article] [PubMed] [Google Scholar]
- 38.Kolasinska-Zwierz P, et al. Differential chromatin marking of introns and expressed exons by H3K36me3. Nat Genet. 2009;41:376–81. doi: 10.1038/ng.322. [DOI] [PMC free article] [PubMed] [Google Scholar]
- 39.Schwartz S, Meshorer E, Ast G. Chromatin organization marks exon-intron structure. Nat Struct Mol Biol. 2009;16:990–5. doi: 10.1038/nsmb.1659. [DOI] [PubMed] [Google Scholar]
- 40.Tilgner H, et al. Nucleosome positioning as a determinant of exon recognition. Nat Struct Mol Biol. 2009;16:996–1001. doi: 10.1038/nsmb.1658. [DOI] [PubMed] [Google Scholar]
- 41.Luco RF, et al. Regulation of alternative splicing by histone modifications. Science. 2010;327:996–1000. doi: 10.1126/science.1184208. [DOI] [PMC free article] [PubMed] [Google Scholar]
- 42.Andersson R, Enroth S, Rada-Iglesias A, Wadelius C, Komorowski J. Nucleosomes are well positioned in exons and carry characteristic histone modifications. Genome Res. 2009;19:1732–41. doi: 10.1101/gr.092353.109. [DOI] [PMC free article] [PubMed] [Google Scholar]
- 43.Kolasinska-Zwierz P, et al. Differential chromatin marking of introns and expressed exons by H3K36me3. Nat Genet. 2009;41:376–381. doi: 10.1038/ng.322. [DOI] [PMC free article] [PubMed] [Google Scholar]
- 44.Shukla S, et al. CTCF-promoted RNA polymerase II pausing links DNA methylation to splicing. Nature. 2011;479:74–9. doi: 10.1038/nature10442. [DOI] [PMC free article] [PubMed] [Google Scholar]
- 45.Irimia M, Blencowe BJ. Alternative splicing: decoding an expansive regulatory layer. Curr Opin Cell Biol. 2012 doi: 10.1016/j.ceb.2012.03.005. [DOI] [PubMed] [Google Scholar]
- 46.Luco RF, Allo M, Schor IE, Kornblihtt AR, Misteli T. Epigenetics in alternative pre-mRNA splicing. Cell. 2011;144:16–26. doi: 10.1016/j.cell.2010.11.056. [DOI] [PMC free article] [PubMed] [Google Scholar]
Associated Data
This section collects any data citations, data availability statements, or supplementary materials included in this article.