

Abstract
The formation of mature secretory granules is essential for proper storage and regulated release of hormones and neuropeptides. In pancreatic β-cells, cholesterol accumulation causes defects in insulin secretion and may participate in the pathogenesis of type 2 diabetes. Using a novel cholesterol analog, we show for the first time that insulin granules are the major sites of intracellular cholesterol accumulation in live β-cells. This is distinct from other, non-secretory cell types, in which cholesterol is concentrated in the recycling endosomes and the trans-Golgi network. Excess cholesterol was delivered specifically to insulin granules, which caused granule enlargement and retention of syntaxin 6 and VAMP4 in granule membranes, with concurrent depletion of these proteins from the trans-Golgi network. Clathrin also accumulated in the granules of cholesterol-overloaded cells, consistent with a possible defect in the last stage of granule maturation, during which clathrin-coated vesicles bud from the immature granules. Excess cholesterol also reduced the docking and fusion of insulin granules at the plasma membrane. Together, the data support a model in which cholesterol accumulation in insulin secretory granules impairs the ability of these vesicles to respond to stimuli, and thus reduces insulin secretion.
Keywords: insulin granule, cholesterol, BODIPY-cholesterol, syntaxin 6, membrane traffic, structured illumination microscopy
The regulated exocytosis of insulin-containing secretory granules from pancreatic β-cells is essential for the maintenance of blood glucose concentrations. In the setting of overnutrition and impaired insulin action in target tissues, defects in insulin secretion result in the development of type 2 diabetes. Dyslipidemia is a major contributing factor in the pathogenesis of type 2 diabetes (1). While the diabetogenic effect of hypercholesterolemia on β-cell function has been established (2–4), the molecular mechanisms underlying cholesterol-induced β-cell dysfunction are poorly understood. More broadly, how cholesterol may participate in secretory granule regulation has not been fully characterized.
Intracellular transport of cholesterol is tightly regulated. Abnormal cholesterol trafficking participates in the pathogenesis of Alzheimer’s disease, Parkinson’s disease, and Niemann-Pick type C disease (5). Cholesterol is synthesized in the endoplasmic reticulum, whose membranes contain the lowest amount of cholesterol. In most cells, membrane cholesterol content increases progressively through the secretory pathway, and the highest concentration is found in the plasma membrane. Together with other lipids, cholesterol creates tightly packed lipid microdomains. These domains may participate in packaging of insulin at the trans-Golgi network (TGN), which could lead to further enrichment of cholesterol in secretory granules (6).
The distribution of cholesterol in live β-cells has not been described. Biochemical measurements of lipid composition are often hindered by impurities of the isolated membranes (7). Filipin is widely used to image cholesterol in fixed cells, but fixation does not effectively preserve lipid organization. Direct visualization in living cells is essential to examining intracellular cholesterol distribution. Because the cholesterol molecule has few structural and chemical features that can be derivatized (8), existing fluorescent cholesterol analogs are few in number, and the available probes have had various limitations. A novel fluorescent cholesterol analog, with a BODIPY moiety linked to carbon-24 of the cholesterol side chain (BODIPY-cholesterol, or BODIPY-chol) was recently characterized in detail, both in vitro and in vivo (9–12). This probe closely mimics the membrane partitioning and trafficking of cholesterol. Importantly, it possesses excellent fluorescence properties, permitting direct visualization of cholesterol distribution in living systems using trace amounts of the probe and thus imposing the minimal perturbation to native membranes. In this study, we utilized BODIPY-chol to characterize cholesterol homeostasis in β-cells and to examine the effect of altered cholesterol on granule biogenesis. Our data show that cholesterol is highly enriched in insulin granules compared with other organelles in β-cells. Excess extracellular cholesterol is delivered readily to insulin granules, giving rise to enlarged insulin granules and impaired granule membrane remodeling.
The initial packaging of immature secretory granules occurs at the TGN, and includes not only the components of the mature granules but also many proteins not destined for secretion. During granule maturation, these proteins are selectively retrieved from the regulated secretory pathway by budding of clathrin-coated vesicles from the immature granules (13). Well-studied examples of proteins that transit through maturing granules include mannose 6-phosphate receptors, clathrin, furin, syntaxin 6, VAMP4, carboxypeptidase D and synaptotagmin IV (14–17). How each step in insulin granule biogenesis is affected by excess cholesterol remains unknown. Here we propose that cholesterol accumulates in insulin granules and that its excess causes a defect in the trafficking of key endosomal proteins. Our results inform how β-cell dysfunction may result, at least in part, from alterations in membrane lipids, which may contribute to diabetes pathogenesis.
RESULTS
Insulin granules are the major sites of intracellular cholesterol accumulation in β-cells
We visualized cholesterol distribution directly in live βcells using BODIPY-chol, which offers the brightness and resolution necessary for these imaging studies. The plasma membrane contains the largest pool of cholesterol and plays a critical role in β-cell function (18). Here we focused on cholesterol distribution among intracellular membranes. When cells were incubated with BODIPY-chol, the BODIPY fluorescence reached steady state by ~3 h. This labeling condition resulted in a negligible (< 1 %) increase in total cellular sterols (10). In our initial studies using this reagent, we observed intracellular punctate structures throughout the cytoplasm in MIN6, βTC3 and INS1 cultured β-cells. The BODIPY-chol labeled structures displayed rapid movement in non-starved cells, and behaved similarly to insulin granules when stimulated with KCl (19).
Markers of several punctate organelles were used to identify the BODIPY-chol positive structures in live β-cells (Figure 1). Phogrin is a transmembrane protein that is localized to insulin granules and has been used extensively to study insulin granule distribution and movement (19–21). Figure 1A shows that there was marked colocalization of BODIPY-chol with phogrin-mCherry (71.6±12.2 %, n=8), indicating that a major portion of the intracellular structures labeled with BODIPY-chol were insulin granules. Cells labeled with BODIPY-chol alone were used to verify that there was no BODIPY signal detected in the red channel using the 543 nm laser line. Furthermore, filipin, a widely-accepted cholesterol-binding probe, colocalized well with phogrin-mCherry in fixed cells (Supplemental Figure 1A–C). To provide unambiguous evidence that BODIPY-chol and phogrin-mCherry label the same organelles in live MIN6 cells, we used three-dimensional structured illumination microscopy (3D-SIM) (22). This super-resolution technique achieved sub-diffraction-limit imaging by improving the resolution from 250 nm to 90 nm in the x-y plane, and from 700 nm to 200 nm in the z direction. It revealed unprecedented details, such as how the granule lumen is surrounded by both BODIPY-chol and phogrin-mCherry in live β-cells (Figure 1B). To further emphasize this point, a half-view reconstructed insulin granule is presented in Supplemental Video 1. The data show that BODIPY-chol and phogrin-mCherry colocalize to individual granules in live MIN6 cells.
Figure 1.

BODIPY-chol is localized to insulin granules in live β-cells. MIN6 cells were transfected with phogrin-mCherry to label insulin granules (A and B, red), TfR-mCherry to label the recycling endosomes (C, red), ST-mRFP to label the TGN (E, red), or incubated overnight with rhodamine (Rh)-dextran to label the lysosomes (D, red). Cells were then labeled with BODIPY-chol (green in all panels) for 3 h at 37 °C and imaged live by confocal microscopy. The top row in each panel shows individual confocal planes; the bottom row shows projections of all confocal planes in a z-stack. (B) Three examples of super-resolution SIM images of phogrin-mCherry and BODIPY-chol localized to the same granule. The white scale bar, 10 μm, applies to A, C, D, E; Black scale bar for B: 0.5 μm.
The recycling endosome is a major site of cholesterol accumulation in many cells (23). Both dehydroergosterol (a naturally fluorescent cholesterol analog) and BODIPY-chol are concentrated in the endocytic recycling compartment in CHO cells (10). In contrast to the large juxtanuclear structures observed in CHO cells, TfR-positive recycling endosomes in MIN6 cells were smaller and appeared as discrete dots throughout the cytoplasm (Figure 1C). Only a small fraction of BODIPY-chol colocalized with TfR-mCherry (18.1±2.2 %, n=9). When BODIPY-chol was applied to 3T3-L1 mouse fibroblast cells, in which the recycling endosomes were also dispersed, almost all BODIPY-chol structures contained TfR (Supplemental Figure 1D–F, 86.4±4.5 % colocalization, n=9). These observations suggest that in the absence of insulin granules, the recycling endosomes are the major site of intracellular cholesterol accumulation in non-secretory cells, as shown in other studies. We also labeled lysosomes, using fluid-phase endocytosis of rhodamine-dextran. Figure 1D shows that BODIPY-chol was excluded from these organelles (7.0±1.2 % colocalization, n=7), consistent with the idea that free cholesterol is rapidly transported out of lysosomes (24). Finally, we labeled the TGN, which is known to contain high concentrations of cholesterol in other cell types (25). In MIN6 cells, the TGN exhibited a characteristic crescent-shaped morphology (Figure 1E), as shown by monomeric red fluorescent protein (mRFP) -tagged sialyltransferase (ST-mRFP). BODIPY-chol labeled dispersed puncta that did not colocalize well with this TGN marker (13.7±2.0 % colocalization, n=9). Together, the data support the idea that insulin granules are the main sites of cholesterol accumulation in cultured β-cells.
We next examined intracellular distribution of endogenous cholesterol. Postnuclear homogenate of MIN6 cells was loaded on a sucrose gradient and subjected to equilibrium centrifugation. Figure 2 shows the distributions of organelle markers (Figure 2A), and of insulin, proinsulin, and cholesterol contents (Figure 2B). In this representative experiment, immunoblots of syntaxin 6 and VAMP4 (present in the TGN and immature granules) and TGN38 (a TGN marker), along with the proinsulin peak, identified fraction 13 as the fraction that contained most of the immature granules. Mature granules were contained in the heavier fractions (14 and 15), consistent with the observation that the density of insulin granules increases during maturation (26). Fraction 9 contained TfR-positive recycling endosomes. Cholesterol measurement showed two peaks, with the smaller peak corresponding to the recycling endosomes (fraction 9) and the major peak insulin granules (both immature and mature granules in fractions 13–15), confirming that endogenous cholesterol was concentrated in insulin granules. We obtained similar results using rat INS1 β-cells (Supplemental Figure 2A, B). When cells were labeled with BODIPY-chol prior to subcellular fractionation, the profile of BODIPY fluorescence, measured by fluorescence spectroscopy, mirrored that of endogenous cholesterol on sucrose gradients. These results support the idea that the intracellular distribution of BODIPY-chol in our live-cell imaging reflects that of endogenous cholesterol in these cells.
Figure 2.
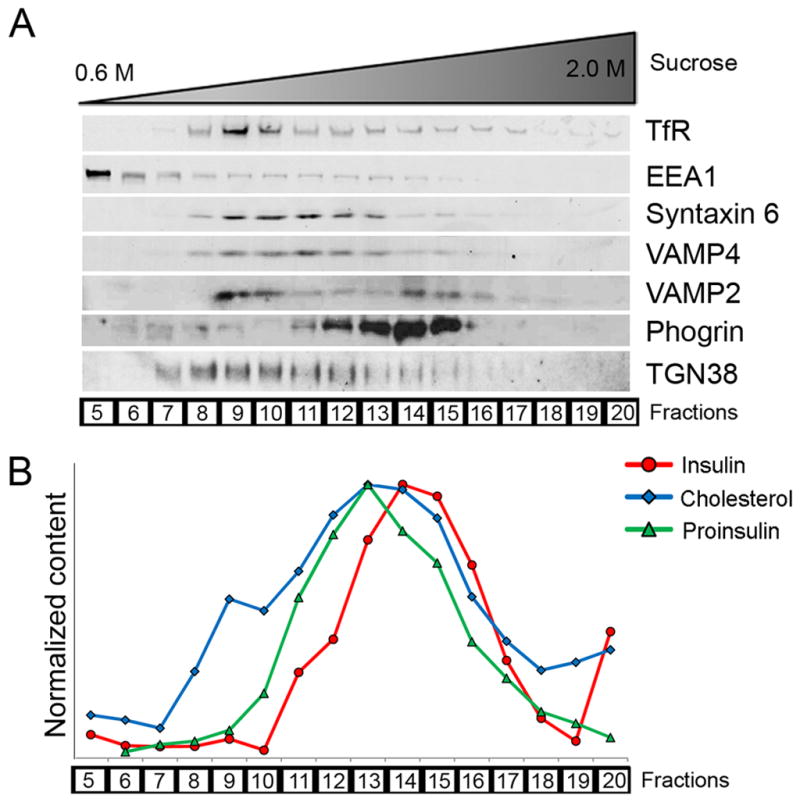
Endogenous cholesterol is enriched in insulin granules. Subcellular fractionation was used to determine intracellular distribution of endogenous cholesterol. Postnuclear MIN6 homogenates were subjected to equilibrium centrifugation on sucrose gradients, which separated intracellular organelles according to density. Sucrose density increased with fraction numbers. Equal volume aliquots were taken from each fraction, and immunoblotted for intracellular markers (A) or measured for insulin, proinsulin, and cholesterol contents (B). Insulin and proinsulin were quantified by ELISA; cholesterol was extracted with organic solvents and measured by a fluorometric assay. For display purposes, all values were normalized to the highest value in each type of measurement. The results presented in this figure were obtained from the same experiment for internal comparison, and are representative of four independent experiments.
Excess extracellular cholesterol is targeted to insulin granules
To build on the finding that cholesterol is enriched in insulin granules, we studied the effects of altered cholesterol abundance on these granules. We used methyl-β-cyclodextrin (MβCD), a cholesterol chelator, to extract cholesterol from the plasma membrane. We also used cholesterol-loaded MβCD (denoted as CHOL) to deliver exogenous cholesterol to the plasma membrane. MβCD and CHOL both modulate intracellular cholesterol content with high efficiency, due to rapid cholesterol transport between the plasma membrane and intracellular sites (27). As shown in Figure 3A, we incubated MIN6 cells with either CHOL or MβCD for 1 h at 37 °C to overload or deplete cellular cholesterol, respectively, and analyzed the cholesterol distribution using a sucrose gradient. The degree of cholesterol alteration relative to control cells is shown in Figure 3B. CHOL significantly increased cholesterol in the granules (Figure 3B, fraction 13), as well as the recycling endosomes (fraction 9) due to exchange with the plasma membrane. On the other hand, MβCD reduced cholesterol relatively uniformly among most organelles and perhaps to a greater degree from the recycling endosomes.
Figure 3.

Excess extracellular cholesterol is delivered to insulin granules. (A and B) Cholesterol distribution in cells with altered cholesterol levels. MIN6 cells were incubated in KRBH buffer alone (“control”), 5 mM MβCD or 5 mM CHOL for 1 h at 37 °C. (A) Cholesterol content was measured in fractions from subcellular fractionation of postnuclear supernatant by equilibrium centrifugation and normalized to protein content. Sucrose density increased with fraction numbers. (B) Data points from (A) expressed as the difference relative to the control. (C–N) MIN6 cells were transfected with either ST-mRFP to label the TGN (C–K) or phogrin-mCherry to label insulin granules (L–N), and imaged live by confocal microscopy. (F–H) Cells incubated with BODIPY-chol for 3 h had 5 mM CHOL added during the last 60 min. (I–N) Cells were cultured in lipoprotein deficient serum containing acLDL and 58035 for 48 h prior to being labeled with BODIPY-chol for 3 h. Bar, 10 μm, applies to all images.
We next examined BODIPY-chol labeling in cholesterol-overloaded cells. In addition to acute overloading with CHOL, we delivered cholesterol by using acetylated-LDL (acLDL). This particle is taken up by scavenger receptors, and thus bypasses the down-regulation of the LDL receptor that occurs when cellular cholesterol is elevated. To ensure a maximum increase in free cholesterol, acLDL was used in combination with 58035, an inhibitor of acyl-coenzyme A cholesterol acyltransferase, which converts free cholesterol to cholesterol esters (28). BODIPY-chol labeled punctate structures upon cholesterol overloading (Figures 3F, 3I, 3L, 5C), which colocalized very well with phogrin-mCherry in the insulin granules (Figures 3M, 5D) but not with ST-mRFP in the TGN (Figure 3, F–K). We conclude that the excess cholesterol was delivered to insulin granules and accumulated preferentially in these structures.
Figure 5.

Cholesterol overloading increases granule size in live β-cells. MIN6 cells were transfected with phogrin-mCherry (red) and labeled with BODIPY-chol (green). Control (A, B and F, G) and CHOL-treated (C, D and H, I) cells were imaged live by confocal microscopy (A–D, projections) or super-resolution SIM (F–I, single planes). (E) Area measurement of BODIPY-chol clusters after image thresholding. Data are mean ± SEM. * p<0.05 by student t-test. Smaller panels to the right of (F–I) are enlarged images of granules taken from the white boxes shown in (G and I). Bar, 1 μm.
Excess cholesterol changes insulin granule properties
Because excess cholesterol was targeted to insulin granules, we studied the effects of cholesterol overloading on granule membrane properties. We first examined the distribution of insulin granules using sucrose gradients by equilibrium centrifugation. Remarkably, insulin granules from cholesterol-overloaded cells were shifted toward less dense fractions (Figure 4A), suggesting that these granules have decreased densities. Cholesterol extraction by MβCD did not significantly affect the insulin granule density (Figure 4A). A similar result was obtained in INS1 cells (Supplemental Figure 2C). To determine if the decrease in density of cholesterol-overloaded granules was due to an increase in granule size, insulin granules were separated on sucrose gradients using velocity centrifugation. Figure 4B shows a greater migration of cholesterol-overloaded insulin granules into the heavier sucrose fractions, suggesting that these granules were indeed larger.
Figure 4.

Excess cholesterol alters insulin granule properties. Insulin distribution upon subcellular fractionation by equilibrium (A, separation by density) and velocity (B, separation by size) centrifugation on sucrose gradients. Sucrose density increased with fraction numbers. (A) CHOL treatment caused a shift of insulin granules toward lighter sucrose fractions, indicating a decrease in granule density. (B) CHOL treatment caused a shift of insulin granules toward heavier sucrose fractions, indicating an increase in granule size. (C–I) TEM analysis of control and cholesterol-overloaded (“CHOL”) insulin granules in MIN6 cells (C–F) and mouse islets (G–I). (E) Histogram of granules according to granule diameter. (F) Histogram of granules according to the ratio of granule diameter to dense core diameter. (I) Granule diameters plotted against dense core diameters for control and CHOL granules from mouse islets. Bar, 1 μm.
We next used transmission electron microscopy (TEM) to closely examine granules from control and cholesterol-overloaded cells. Mature insulin granules displayed the classically-described appearance of an electron lucent halo between their dense core and limiting membranes (Figure 4). TEM measurement of granule size (Figure 4E) demonstrated an increase in the delimited cross-sectional diameters of granule membranes in cholesterol-overloaded MIN6 cells (307±43 nm in CHOL vs. 258±33 nm in control cells, p<0.0001), consistent with our velocity centrifugation data (Figure 4B). Because the size of the dense core remained similar to that in control granules (data not shown), the cholesterol-overloaded granules had a higher ratio of granule diameter to core diameter (Figure 4F). This was reflected by a larger translucent halo space around insulin dense cores in cholesterol-overloaded granules (Figure 4, C and D), which may explain their shift to lighter densities (Figure 4A). We further verified this key finding in mouse pancreatic islets (Figure 4, G–I). When comparing insulin dense core diameters, the centers from control and cholesterol-overloaded granules fell close to each other on the x-axis (Figure 4I). However, there was a clear shift in the granule diameters, plotted on the y-axis (335±55 nm in CHOL and 263±48 nm in control cells, p<0.0001).
To exclude possible artifacts that might be introduced by chemical fixation of the samples used for TEM, we measured insulin granule size in live cells by confocal microscopy. Both BODIPY-chol and phogrin-mCherry labeled enlarged structures in cholesterol-overloaded MIN6 cells (Figure 5A–D). Figure 5E quantifies the cross-sectional fluorescence area of BODIPY-chol positive structures, and reveals a 1.8-fold increase in granule cross-sectional area when excess cholesterol was applied. In theory, SIM would offer superior resolution ideal for granule measurement. However, because rapid granule movements in live cells created artificial patterns during reconstruction, it was not possible to quantify a large number of granules using SIM. Nevertheless, examples of enlarged granules upon cholesterol overloading were captured in live cells by super-resolution SIM (Figure 5F–I). We conclude that in cholesterol-overloaded β-cells, excess cholesterol causes enlargement of the insulin granules.
Excess cholesterol alters the distribution of insulin granule membrane proteins
During granule biogenesis, a subset of proteins is removed from immature granules by clathrin-coated vesicle budding and results in a reduction in granule size (29). We wondered if a defect in the budding of clathrin-coated vesicles may contribute to the formation of enlarged granules in cholesterol-overloaded cells. Precedent for this idea includes the finding that Rab3D disruption results in inefficient furin removal and an increase in secretory granule size, which may be due to impaired granule maturation (30). We studied the removal of syntaxin 6 and VAMP4 from mature granules as a means to examine of the effect of cholesterol overloading on granule membrane remodeling. A similar strategy has been used to study the role of GGA in granule maturation (31). Syntaxin 6 transits through maturing granules prior to being transported back to the TGN via the endosomal pathway, and a defect in its trafficking could lead to reduced granule stimulus responsiveness and fusion specificity at the plasma membrane (14, 15).
At steady state, syntaxin 6 was present predominately in the TGN in control cells (32) (Figure 6, A–C and G–I). However, its distribution was dramatically affected by cholesterol overloading, which resulted in diminished localization to the TGN (Figures 6, D–F and J–L). Of note, the compact morphology of the TGN was not disrupted under the cholesterol loading conditions used (Figure 6, E and K). In this sense, cultured β-cells, which readily accumulated excess cholesterol in insulin granules instead of the endosomes and the TGN, differed from other cell types in which cholesterol overloading led to Golgi dispersion (33). Figure 6 shows that syntaxin 6 was not efficiently targeted to the TGN in cholesterol-overloaded cells, consistent with a defect in directing syntaxin 6 from insulin granules to the TGN. The distribution of VAMP4, another immature granule marker that is normally removed upon clathrin-coated vesicle budding from maturing granules (14), was similarly affected by cholesterol loading (Supplemental Figure 3A–F). Such a defect in syntaxin 6 and VAMP4 trafficking could be due to prolonged retention in insulin granules, or to inhibition of retrograde traffic from endosomes to TGN. The latter possibility was ruled out using a resident integral membrane protein of the TGN, TGN38. TGN38 reaches its steady state distribution in the TGN via the endocytic recycling pathway (34) and importantly, it does not enter immature secretory granules (16). As shown in Supplemental Figure 3G–L, in contrast to syntaxin 6, the predominant distribution of TGN38 in the TGN was only moderately affected by cholesterol overloading.
Figure 6.

Excess cholesterol affects the steady state distribution of an immature granule marker, syntaxin 6. Control (A–C, G–I) and CHOL-treated (D–F, J–L) MIN6 (A–F) and INS1 (G–L) cells transfected with ST-mRFP (red) were immunostained with syntaxin 6 antibody (green). Bar, 10 μm, applies to all images.
We considered the possibility that colocalization of syntaxin 6 and insulin would be increased in CHOL-treated cells, due to prolonged residence of syntaxin 6 in the mature insulin granules. In control cells, syntaxin 6 showed prominent TGN localization. There were also cytosolic puncta, likely representing endosomes (Figure 7B), that did not colocalize with insulin (Figure 7C, insets). In cholesterol-overloaded cells, there were more syntaxin 6 puncta overlapping with insulin (white arrowheads in Figure 7F), as well as reduced syntaxin 6 staining in the TGN. The fact that the overall colocalization of syntaxin 6 and insulin remained low was not unexpected, because syntaxin 6 associates only transiently with insulin granules (35). These data agree well with the observation that only a slight increase in the colocalization of syntaxin 6 with secretory granules was observed when clathrin-coated vesicle budding was blocked, using dominant-negative GGA proteins in PC12 cells (31). We observed extensive colocalization of insulin and syntaxin 6 in approximately 10 % of cells, indicating that syntaxin 6 may be trapped in mature granules in cholesterol-overloaded cells (Supplemental Figure 3M–O). It has been proposed that the separation of different types of membrane microdomains is required for syntaxin 6 removal from immature granules (36). Consistent with this idea, excess cholesterol may interfere with microdomain separation and thus impair syntaxin 6 removal from immature secretory granules.
Figure 7.

Retention of syntaxin 6 and VAMP4 is increased in cholesterol-overloaded (“CHOL”) insulin granules. Control and CHOL MIN6 cells were stained with insulin (A and D, red) and syntaxin 6 (B and E, green) antibodies. (C insets) Enlarged images of distinctly separated insulin and syntaxin 6 puncta. (F) Structures positive for both insulin and syntaxin 6 are highlighted by white arrowheads. Bar, 10 μm. (G–J) The extent of colocalization was quantified between insulin and syntaxin 6 (G, H), or insulin and VAMP4 (I, J). Details of image analysis are included in the Methods. Percent of colocalization was measured by area and by intensity. All values of CHOL vs. control cells showed p<0.05 by student t-test. n=6 pairs of images. Correlation scatterplots show corresponding pixel intensities from the two probes plotted against each other. A correlation coefficient, which measures the strength of association between the two probes, was generated for each pair of images and shown in the upper right corner. Values of 1 and 0 represent perfect colocalization and random distribution, respectively. (K, L) Granule-enriched and light-microsomal fractions from control and CHOL cells were obtained by sequential centrifugation steps. Each fraction was blotted for TfR, syntaxin 6 and VAMP4 (K), and quantified in (L). (L) Values from CHOL cells were normalized to those from the control (control = 1). * p<0.05 by student t-test against control cells, n=4. All data are mean ± SEM.
To quantify the colocalization of syntaxin 6 and insulin, we utilized the colocalization measurement tools in MetaMorph image analysis software. Both source images were thresholded to select only the punctate structures prior to performing the measurements. The degree of colocalization was expressed in two ways: as the area of overlap between two fluorescent probes or as the intensity in the overlapping regions. These measurements were then normalized to the total thresholded area or intensity, respectively. We obtained similar results using either parameter; both methods revealed statistically significant differences between control and cholesterol-overloaded cells (Figure 7G). In a correlation plot, the intensities of each probe are represented graphically on a pixel-by-pixel basis, using the corresponding pixel intensity values from the two images as X and Y coordinates. For correlation coefficients, a maximum value of 1.0 would show a straight line representing perfectly overlapping points in two identical images. Therefore, the more the two data sets correlate, the more the pixel values tend to concentrate along a straight line. This was the case when the scatterplot from cholesterol-overloaded cells (Figure 7H, right panel) was compared with that from control cells (Figure 7H, left panel). The correlation coefficient also increased for cholesterol-overloaded cells. Similar results were also obtained from colocalization measurements using insulin and VAMP4 (Figure 7, I and J). These data support the idea that excess cholesterol caused the retention of syntaxin 6 and VAMP4 on insulin granules.
To further support the idea that syntaxin 6 is more abundant on insulin granules from cholesterol-overloaded cells, we used a complementary, biochemical method. We separated granule-enriched and light-microsomal fractions using sequential centrifugations (37). The fold increase in insulin content from the granule fraction versus the light-microsomal fraction was 5.7±0.9 and 6.2±0.9 in control and CHOL cells, respectively. We then immunoblotted the fractions to quantify syntaxin 6, VAMP4 and TfR. As shown in Figure 7K, syntaxin 6 and VAMP4 were increased in the granule-enriched fraction and decreased in the light-microsomal fraction of cholesterol-overloaded cells. In contrast, TfR abundance in these fractions was not changed. We quantified data from repeated experiments in Figure 7L, which demonstrates that these differences were consistent and statistically significant. Importantly, increased localization of cargo proteins with secretory granules was previously interpreted as indicating retention in the mature granules, as a result of inhibition of clathrin-coated vesicle budding from the immature granules (31, 38). Our data are entirely consistent with this scenario, which would account for the findings we describe in cholesterol-overloaded βcells.
We next tested if clathrin was present on cholesterol-overloaded insulin granules. We used fluorescence microscopy to compare the distribution of clathrin with that of insulin in MIN6 cells. There were occasionally a few puncta in control cells that contained both insulin and clathrin (Figure 8C, white arrowheads), suggesting that the presence of clathrin on mature insulin granules was transient. The degree of colocalization of insulin and clathrin increased upon cholesterol addition (Figure 8F, white arrowheads). More interestingly, numerous examples of clathrin staining that partially overlapped or encircled individual insulin granules were found in cholesterol-overloaded cells (Figure 8G). These observations suggest that a budding process may have been initiated, but that it was blocked prior to fission of the clathrin-coated vesicles. To highlight these structures, simplified illustrations are included in the second row of Figure 8G with background noise removed after thresholding. Together, the data support the notion that the budding of clathrin-coated vesicles from immature insulin granules is impaired in cholesterol-overloaded β-cells, which results in inefficient retrieval of syntaxin 6, VAMP4 and clathrin from these granules.
Figure 8.

More clathrin is associated with cholesterol-overloaded insulin granules. Control and cholesterol-overloaded (“CHOL”) MIN6 cells were immunostained with insulin (A and D, red) and clathrin (B and E, green) antibodies. (C, F) Structures positive for both insulin and clathrin are highlighted by white arrowheads. White bar, 5 μm. (G) A region of the cell marked by the white box in (F). The top row of the panels in (G) shows enlarged images of insulin granules displaying regions overlapping with clathrin. The numbers correspond to the squares in (G). The bottom row outlines the relevant structures labeled by each antibody, with background fluorescence removed by thresholding. Black bar, 0.5 μm.
To determine if exposure to high glucose alters cholesterol content or insulin granule morphology, we treated MIN6 cells with 30 mM glucose for 36 h. The high glucose treatment resulted in 30.5±6.2 % (mean±SEM, n=6) increase in total cholesterol content, normalized to protein content. This was accompanied by an increase in granule size (Supplemental Figure 4). Granules were shifted to lighter fractions on equilibrium density gradients, and enlarged BODIPY-chol positive structures were observed by confocal microscopy. Therefore, the changes we report after cholesterol loading of cells may also be induced, possibly indirectly, by exposure of β-cells to prolonged hyperglycemia.
Finally, we investigated the functional consequences of cholesterol accumulation for insulin granule exocytosis. Excess cholesterol caused reduced glucose-stimulated insulin secretion from β-cells (Figure 9A) (2, 3, 18). To focus more specifically on the fusion step, we imaged VAMP2-pHluorin using total internal reflection fluorescence microscopy (TIRFM). VAMP2-pHluorin (or synapto-pHluorin) has been used as a sensitive reporter for insulin granule exocytosis, because pHluorin has little fluorescence inside an acidic secretory granule, and it becomes much more fluorescent when the pH is neutralized by granule fusion at the plasma membrane (39). Figure 9B shows that there were significantly fewer glucose-stimulated fusion events in cholesterol-overloaded INS1 cells. INS1 832/13 cells were used because of their robust responsiveness to glucose stimulation (40). We also used TIRFM of fixed cells stained with an insulin antibody to measure the ability of insulin granules to dock at the plasma membrane (Figure 9C–G). Under both basal and high glucose conditions, excess cholesterol caused a 26 % decrease in the amount of insulin in the TIRFM evanescent field (Figure 9G). We obtained similar results using TEM, which demonstrated that there were 31 % fewer docked granules, defined as having centers within 200 nm of the plasma membrane (41), in cholesterol-overloaded cells (Figure 9H). Interestingly, insulin granules with an enlarged halo space were less likely to be present near the plasma membrane (Figure 9I, J). As shown in Figure 4, a greater granule-to-core diameter ratio correlates with increased granule cholesterol. Whereas the distribution of this ratio among docked granules (Figure 9K, red) was similar to the overall profile of total granules (Figure 9K, green) in control cells, this was not the case in cholesterol-overloaded cells. In cholesterol-overloaded cells (Figure 9L), the ratio of granule-to-core diameters in docked granules (red) was substantially less than that of all granules (green). These data suggest that a certain granule size or composition was favored for docking, and any deviations from such optima due to excess cholesterol may impair docking.
Figure 9.

Excess cholesterol accumulation impairs insulin granule docking and fusion. For all experiments, 20 mM glucose was used for stimulation. (A) Glucose-stimulated insulin secretion (GSIS) was measured in control and CHOL INS1 cells. Basal secretion in control cells was set to 1. n=4. (B) Glucose-stimulated fusion events were measured by TIRFM in control and CHOL INS1 cells transfected with VAMP2-pHluorin. n=548 events from 7 cells. (C–G) Basal (C,E) and glucose-stimulated (15 min, D, F) control (C, D) and CHOL (E, F) MIN6 cells were fixed and stained with insulin antibody and imaged by TIRFM. Bar, 10 μm. (G) Quantification of background corrected fluorescence intensity normalized to cell area from experiments shown in (C–G). n=40 cells. (H–L) MIN6 cells or isolated islets cultured in 11 mM glucose were used. Granules having centers within 200 nm of the plasma membrane were defined as docked. (H) Fraction of docked granules in TEM images of control and CHOL MIN6 cells. n=34 cells. (I–L) TEM of control (I, K) and CHOL (J, L) mouse islets with the plasma membrane marked by red lines in (I, J). Bar, 1 μm. (K, L) Distribution profiles of docked (red) vs. total (green) granules. n=941 from 18 images. All panels, data are mean ± SEM; *, p<0.05 by student t-test against control cells.
DISCUSSION
The biogenesis of insulin granules is a prerequisite step for the proper storage, processing, and regulated secretion of insulin in pancreatic β-cells. Elevated cholesterol in β-cells has emerged as an important factor in the development of β-cell dysfunction. This study is aimed to characterize how cholesterol regulates insulin granule properties. Using BODIPY-chol, we are able to show for the first time that cholesterol is highly enriched in insulin granules relative to other intracellular compartments in live βcells (Figure 1). This is in contrast to fibroblast cells, in which intracellular cholesterol accumulates in the recycling endosomes and the TGN (Supplemental Figure 1D–F) (23, 27). Visualization of BODIPY-chol in insulin granules by SIM also provided the first super-resolution imaging of a lipid present in an intracellular organelle of living cells. Figure 1B, Figure 5F–I and Supplemental Video 1 show a donut-shaped fluorescence pattern displayed by BODIPY-chol incorporated in the circular granule membrane.
When a cholesterol analog, such as BODIPY-chol or dehydroergosterol, is added to the cell from the plasma membrane, it reaches its equilibrium distribution according to the chemical activity of cholesterol in each organelle (42, 43). Non-vesicular transport plays a key role in determining intracellular cholesterol distribution. Specific targeting by a carrier protein is unnecessary, because in fixed and permeabilized CHO cells, a non-specific carrier such as MβCD can deliver dehydroergosterol to the endocytic recycling compartment rapidly and efficiently (27). Thus, the fact that BODIPY-chol accumulates in insulin granules indicates that the granule membrane may possess unique physiochemical properties to facilitate incorporation of cholesterol. For example, phospholipids with large polar head size and high levels of acyl chain saturation could act to protect cholesterol from unfavorable exposure to water molecules and include cholesterol in low free-energy complexes with other lipids (42, 43). This favorable lipid environment would in turn give rise to a low chemical activity coefficient (escape tendency) that can effectively stabilize cholesterol in the granules.
Our previous study showed that hypercholesterolemia, such as that observed in obese animals, leads to elevated islet cholesterol levels (3). Together with other data, this result raises an important question: How do β-cells handle elevated cholesterol, i.e., where does excess cholesterol go? We show here that cholesterol loaded via the plasma membrane accumulates readily in insulin granules (Figure 3), and results in enlarged granule morphology (Figures 4 and 5). Granule enlargement is unlikely to be due to homotypic fusion or multigranular exocytosis of insulin granules, because the size of the dense core did not change significantly (Figure 4I). Unlike in neuroendocrine cells, homotypic fusion of two or more granules has not been shown in β-cells (44). The occurrence of multigranular exocytosis, in which multiple vesicles fuse with each other before exocytosis, is also rare in β-cells (45). The roughly 25 % increase in diameter or 50 % increase in surface area cannot be accounted for by simple osmotic swelling (46) or addition of cholesterol molecules alone (47).
Although our data suggest that excess cholesterol inhibits granule membrane remodeling, it is unlikely that such a defect in granule maturation fully accounts for the broad effect of cholesterol addition on a large portion of the granule population. The increased granule size results primarily from direct alterations of the granule membrane induced by cholesterol addition. Vesicle enlargement (with up to 80 % increased surface area) has been observed under other conditions, yet the detailed mechanisms of vesicle membrane dynamics remain unknown. When secretory vesicle membrane area was examined by treating the cells with L-DOPA for 60–90 min, there was a 20–34 % increase in granule diameter (48, 49). Similarly, chromaffin granules were 38 % larger in diameter in chromogranin A deficient mice (50). It was suggested that vesicle membrane may be added physically through cytosolic phospholipid transport proteins involved in secretory vesicle formation (51). Alternatively, small synaptic-like microvesicles (49), small lipid vesicles present between the dense core and the vesicle membrane (52), and flaccid vesicle membrane (46) have been proposed to provide additional membrane. Cholesterol accumulation also led to a 44 % increase in the diameters of late endosomes and a nearly compensating increase of other lipids in U18666A treated cells (53).
Cholesterol enrichment is known to modulate membrane curvature by activating phospholipases capable of converting lipids from one geometric shape to another, which would confer different topological constraints onto the membranes. For example, excess cholesterol in the granules may induce translocation of cytosolic phospholipase A2 (cPLA2) to insulin granules, similar to the finding that excess cholesterol in the Golgi induces translocation of cPLA2 to the Golgi membrane (33). Consequently, using granule phospholipids (cylindrical shaped) as substrates in β-cells for cPLA2 (54), cholesterol-induced activation of cPLA2 would result in accumulation of arachidonic acid (cone shaped) and lysophospholipids (inverted cone shaped) in the granule membrane. These possibilities are beyond the scope of the present study and will be investigated in the future.
It was shown that the loss of the ABC transporter G1 led to enlarged insulin granules with decreased cholesterol content in the granules (37). The seemingly contradictory results presented in this study and by Sturek et al. could be explained by the idea that there may be different cholesterol requirements at different stages of granule maturation. Adequate cholesterol may be necessary for the generation of a cholesterol-rich, condensed membrane for storing insulin, yet excessively high cholesterol content may cause enlarged granules by mechanisms listed above and by impaired egress of clathrin-coated vesicles during granule maturation. Together, the two studies suggest that insulin granules are negatively affected by both insufficient and excess cholesterol.
The idea that excess cholesterol may interfere with clathrin-coated vesicle budding from immature granules carries implications beyond insulin granule biogenesis. Excess cholesterol may alter the trafficking of many proteins, particularly those that must be sorted from immature secretory granules to endosomes (13). An extreme case occurs in lipid storage diseases, in which impaired membrane dynamics due to cholesterol accumulation could lead to a massive “traffic jam” involving both lipids and proteins (55). In secretory cells, membrane remodeling via clathrin-coated vesicle budding is required for the acquisition of organelle identity and stimulus responsiveness of mature granules (14, 15). Therefore, cholesterol overloading may lead to inefficient retrieval of certain SNARE proteins from mature granules, and thus reduce granule fusion at the plasma membrane. This idea is supported by the finding that in neuroendocrine PC12 cells, noncognate VAMP4 inhibited fusion at the plasma membrane by displacing the cognate, vesicle-anchored VAMP from fusion complexes (56). Indeed, Figure 9 shows reduced docking and fusion as a result of cholesterol accumulation in β-cells.
We conclude that insulin granules are the major sites for intracellular cholesterol accumulation in live β-cells. Excess cholesterol alters granule size and interferes with membrane remodeling. Our findings have potential importance for how insulin secretion is impaired in diabetes. Type 2 diabetes typically occurs in the setting of dyslipidemia, which may contribute to impaired β-cell function. Hyperglycemia itself can also impair insulin secretion. We found that prolonged culture of β-cells under high glucose conditions resulted in increased cholesterol content as well as enlarged insulin granule morphology. These findings raise the possibility that the effects of excess cholesterol we describe may contribute as one mechanism by which hyperglycemia impairs insulin secretion. More broadly, our results may pertain to a wide range of cells. Pancreatic β-cells and other secretory cells, especially neuroendocrine cells, share many common components involved in regulated secretion. Cholesterol may regulate granule properties similarly in these various cell types and contribute to a wide range of pathophysiology.
MATERIAL AND METHODS
MIN6 cultured β-cells (57) (passages 16–30) were grown in DMEM (11 mM glucose) supplemented with 100 U/mL Penicillin, 100 μg/mL Streptomycin, 10 % FBS, 2 mM L-glutamine and 50 μM 2-mercaptoethanol. KRBH buffer (128.8 mM NaCl, 4.8 mM KCl, 1.2 mM KH2PO4, 1.2 mM MgSO4, 2.5 mM CaCl2, 5 mM NaHCO3, 10 mM HEPE, pH 7.4) was used for experiments. INS1 832/13 cultured β-cells were grown and prepared for experiments as described (40). 3T3-L1 fibroblasts were cultured in DMEM (25 mM glucose) containing 10 % FBS. Mouse pancreatic islets were isolated and cultured as described (58). Transient transfections were performed with Lipofectamine 2000 (Invitrogen) according to the manufacturer’s protocol and cells cultured for 48 h prior to microscopy.
BODIPY-cholesterol (11) was generously provided by Dr. Robert Bittman (Queens College of The City University of New York, NY, NY). Cells were labeled with 1 μM BODIPY-chol for 3 h at 37 °C in KRBH buffer or DMEM supplemented with 5% LPDS. The following primary antibodies were used: VAMP2 (Dr. James Rothman, Yale School of Medicine, New Haven, CT), TfR (Invitrogen), EEA1 (Thermo Scientific), syntaxin 6 (Synaptic Systems; BD Transduction), VAMP4 (Abcam), TGN38 (AbD Scrotec), clathrin (Abcam), phogrin (Novus Biologicals) and insulin (Cell Signaling; Abcam). Constructs: phogrin-mCherry (Dr. David Piston, Vanderbilt University, Nashville, TN), ST-mRFP (Dr. Jack Rohrer, University of Zurich, Switzerland), TfR-mCherry (Dr. Michael Ehlers, Duke University Medical Center, Durham, NC), VAMP2-pHluorin (Dr. James Rothman, Yale School of Medicine, New Haven, CT). Rhodamine-dextran and Alexa Fluor- conjugated secondary antibodies were from Invitrogen. Insulin and proinsulin enzyme immunoassay kits were from Alpco Diagnostics (Salem, NH). MβCD, water-soluble cholesterol (CHOL), filipin, 58035 and all other chemicals were from Sigma.
Fluorescence microscopy
For immunostaining, cells were washed, fixed with 4 % paraformaldehyde for 20 min, permeabilized with 0.1 % Triton X-100 for 5 min, blocked with 5 % normal goat serum for 30 min, stained with primary antibodies for 1 h and secondary antibodies for 30 min, all at room temperature. Confocal microscopy was performed using an Axiovert 100M inverted microscope equipped with an LSM 510 laser-scanning unit and a 63× 1.2 NA plan Apochromat objective (Carl Zeiss, Inc.). 488-, 543-, and 633-nm laser lines were used to excite the green fluorophores (GFP/Alexa 488/BODIPY), the red fluorophores (mRFP/mCherry/Alexa 546/rhodamine) and Alexa 633, respectively. Emitted light was collected through band pass filters of 505–550 nm, 560–615 nm and 655–719 nm, respectively. Wide-field microscopy was carried out by a Zeiss plan-neofluar 40×/1.3 NA oil objective using a Zeiss Axiovert microscope equipped with a cooled CCD camera driven by AxioVision imaging software (Carl Zeiss). Rhodamine-dextran and mCherry were imaged using a rhodamine setting, and filipin used a DAPI setting. Identical image acquisition and display settings were used for all images from the same experiment.
Super-resolution structured illumination microscopy (SIM)
Images were acquired using an Olympus Plan-Apo 60× 1.42 NA objective lens and back-illuminated Cascade II 512 × 512 electron-multiplying CCD camera (Photometrics, Tucson, AZ) on the OMX system (Applied Precision) equipped with 488-, 568-, and 642-nm lasers. The laser beams were passed through a diffraction grating to generate an interference pattern at the sample position. The pattern was then shifted laterally through five phases and three angular rotations of 60 degrees. The Z-section had 0.125-μm intervals. Images resulting from minimal granule movement and photo bleaching were processed and reconstructed using computer algorithms to reveal the final super-resolution image.
Total internal reflection fluorescence microscopy (TIRFM)
Cells were imaged at 37 °C using an Olympus objective-type IX-70 inverted microscope fitted with a 60 × 1.45 N.A. TIRFM lens (Olympus, Center Valley, PA), controlled by Andor iQ software (Andor Technologies, Belfast, Ireland), and detected with a back-illuminated Andor iXon 897 EMCCD camera (512 × 512, 14 bit; Andor Technologies). The depth of the evanescent field was calculated to be 98 nm. Images were acquired every 200 ms. Analysis of fusion events were performed as previously described (59).
Electron microscopy
Cells were fixed with 2.5 % glutaraldehyde in 0.1 M sodium cacodylate buffer (pH 7.4) for 1 h at room temperature, rinsed with 0.1 M sodium cacodylate buffer, and post-fixed with 1 % osmium tetroxide in 0.1 M cacodylate buffer for 1 hour at room temperature. Samples then underwent a series of ethanol dehydration and embedded in EMbed812 resin, before sectioned (60 nm) and contrasted with 2 % uranyl acetate and lead citrate. Images were taken on FEI Tencai Biotwin transmission electron microscope using Morada CCD camera and iTEM software (Olympus).
Cholesterol manipulation
For depletion, cells were incubated with 5 mM MβCD at 37°C for 1 h, which removed cholesterol from both plasma membrane and intracellular stores because intracellular cholesterol effluxes efficiently to the plasma membrane where it is quickly removed by MβCD as the acceptor (27). To overload cholesterol, cells were incubated with 5 mM CHOL (soluble cholesterol from Sigma; 1 g cholesterol-MβCD complex contains approximately 40 mg cholesterol) at 37°C for 1 h. A second method for overloading cholesterol was to culture cells in lipoprotein deficient serum with 0.1 mg/mL acLDL and 5 μg/mL 58035 for 48 h. For TEM, isolated mouse islets were divided into two groups, incubated with agitation in KRBH in the absence (control) or presence (CHOL) of 10 mM CHOL for 1 h at 37 °C.
Subcellular fractionation
Subcellular fractionation of MIN6 and INS1 cells were performed using previously described methods (37, 60) with slight modifications. Briefly, cells were homogenized using 20 strokes in a Dounce-type Teflon tissue grinder (VWR) in homogenization buffer (20 mM Tris-HCl, pH 7.4, 0.5 mM EDTA, 0.5 mM EGTA, 250 mM sucrose, 1 mM DTT) containing Complete protease inhibitor cocktail (Roche Applied Science). All steps were performed at 4 °C. The postnuclear supernatant, which was obtained by centrifuging cell homogenate at 900 g for 10 minutes, was spun at 5,400 g for 15 minutes to obtain post-mitochondrial supernatant, and was subsequently spun at 25,000 g for 20 minutes to pellet the granule-enriched fraction. The supernatant was spun at 100,000 g for 1 h to pellet the light microsome fraction. The relative enrichment of insulin content in the granule fraction versus the light microsome fraction was determined using insulin ELISA (n=3). For equilibrium density centrifugation, the postnuclear supernatant was layered on top of a discontinuous sucrose gradient (0.4 – 2.0 M in 0.2 M steps), and spun in Beckman rotor SW41-Ti at 110,000 g for 18 h. For velocity centrifugation, the postnuclear supernatant was layered on top of a discontinuous sucrose gradient (0.3 – 1.0 M in 0.1 M steps), and spun in Beckman rotor SW41-Ti at 60,000 g for 1 h. Aliquots of 0.5 mL were taken out from the top, and were immunoblotted for organelle markers or assayed for insulin and proinsulin by ELISA. For cholesterol measurement, each fraction was subjected to lipid extraction with chloroform/methanol (2:1; v/v), dried down to a thin film, and resuspended in 1× working solution (Amplex Red Cholesterol Assay kit, Invitrogen). Cholesterol content was quantified in a 96-well plate by a fluorometric method using an enzyme-coupled reaction provided by the Amplex Red Cholesterol Assay kit (61).
Image analysis
All image analysis was performed using MetaMorph Image Analysis Software (Molecular Devices, Sunnyvale, CA). Images were first corrected for background and crossover as described (62). A threshold was then applied to each image such that cytosolic background fluorescence was excluded and only those pixels associated with clearly labeled intracellular structures were selected. To measure granule size by BODIPY-chol, regions of interest were created for distinct fluorescence clusters selected by image thresholding, using the function “Create Regions Around Objects”. The area of each region was then measured. To quantify the degree of colocalization between BODIPY-chol and various intracellular organelle markers, the area in the regions positive for both probes was measured and normalized to the total area containing the organelle marker. Using MetaMorph’s colocalization and correlation measurement tools, a correlation plot and a correlation coefficient for all selected pixels after thresholding were generated for each pair of images.
Supplementary Material
Video 1. Half-view 3D reconstruction of an insulin granule imaged by SIM with a 180° rotation about the z-axis. MIN6 cells were transfected with phogrin-mCherry (red), labeled with BODIPY-chol (green), and imaged live by 3D super-resolution SIM. The last frame displays an en face view of the orthogonal distribution of the two probes surrounding a hollow core. White bar: 0.5 μm.
Supplemental Figure 1. (A–C) Filipin staining colocalizes with phogrin-mCherry in fixed MIN6 cells. Cells were transfected with phogrin-mCherry, fixed and stained with a fluorescent cholesterol probe, filipin. Wide-field images were acquired using the standard rhodamine setting for phogrin-mCherry and the DAPI setting for filipin. Filipin and phogrin-mCherry are green and red in the merged image, respectively. (D–F) BODIPY-chol accumulates in recycling endosomes in 3T3-L1 mouse fibroblasts. 3T3-L1 cells were incubated with BODIPY-chol for 3 h at 37 °C, rinsed, and then with 10 μg/ml Alexa 633-Tf for 1 h at 37 °C. A single confocal plane is shown. Bar, 10 μm.
Supplemental Figure 2. (A, B) Endogenous cholesterol is enriched in insulin granules of INS1 rat cells. Subcellular fractionation was used to determine intracellular distribution of endogenous cholesterol. Postnuclear INS1 homogenates were subjected to equilibrium centrifugation on sucrose gradients, which separated intracellular organelles according to density. Sucrose density increased with fraction numbers. Equal volume aliquots were taken from each fraction, and immunoblotted for intracellular markers (A) or measured for insulin and cholesterol contents (B). Insulin was quantified by ELISA; cholesterol was extracted with organic solvents and measured by a fluorometric assay. For display purposes, both values were normalized to the highest value in each type of measurement. The results presented in this figure were obtained from the same experiment for internal comparison, and are representative of three independent experiments. (C) Excess cholesterol alters insulin granule properties in INS1 cells. Insulin distribution was measured by ELISA upon subcellular fractionation by equilibrium centrifugation on sucrose gradients. CHOL treatment resulted in a shift of insulin granules toward lighter sucrose fractions, indicating a decrease in granule density.
Supplemental Figure 3. Excess cholesterol affects the steady state distribution of immature granule markers, VAMP4 and syntaxin 6, but not a resident integral membrane protein of the TGN, TGN38. (A–F) Control and CHOL-treated MIN6 cells transfected with ST-mRFP (B, E) were immunostained with VAMP4 antibody (A, D). (G–L) Control and CHOL-treated MIN6 cells were immunostained with TGN38 (G, J) and syntaxin 6 (H, K) antibodies. (I, L) Differential interference contrast (DIC) images. (M–O) CHOL-treated MIN6 cells were stained with insulin (M, red) and syntaxin 6 (N, green) antibodies. Shown here is an example of extensive colocalization between insulin and syntaxin 6, indicating that Syntaxin 6 may be trapped in the mature granules in cholesterol-overloaded cells. All images show single confocal planes. Bar, 10 μm.
Supplemental Figure 4. Hyperglycemia leads to enlarged granule morphology. (A) Prolonged exposure of MIN6 cells to high glucose (30 mM, 36 h) shifted insulin granules to lighter fractions on sucrose gradients by equilibrium centrifugation. Sucrose density increased with fraction numbers. (B) TEM analysis shows high glucose resulted in a greater ratio of granule diameter to core diameter. (C) The BODIPY-chol positive structures in live MIN6 cells were enlarged after high-glucose treatment. These are single plane confocal images. Bar, 10 μm. (D) Area measurement of BODIPY-chol clusters after image thresholding. Data are mean ± SEM. * p<0.05 by student t-test.
Acknowledgments
We are grateful to Dr. Robert Bittman for his generous supply of BODIPY-cholesterol, which was a major tool in this study. We thank Ms. Xiaojian Zhao and Dr. Gary Cline for providing isolated mouse islets. We also thank Dr. Christoph Rahner and the Yale electron microscopy core facility for their help with the TEM study. We are indebted to Dr. David Castle for advice on experimental designs and critical reading of the manuscript. This work used the Center for Cell Imaging and the Diabetes Endocrinology Research Center Cell Biology Core at Yale University School of Medicine. This work was supported by National Institutes of Health grants K01DK078625 (to M.H.), P30DK45735 (Yale Diabetes Endocrinology Research Center, to M.H.), R01DK075772 (to J.S.B.), American Diabetes Association Grant 1-12-BS-16 (to J.S.B.) and by a grant from the W. M. Keck Foundation (to J.S.B.).
Abbreviations
- BODIPY-chol
BODIPY-cholesterol
- CHOL
cholesterol loaded on MβCD
- LDL
low-density lipoprotein
- MβCD
methyl-β-cyclodextrin
- SIM
structured illumination microscopy
- ST
sialyltransferase
- TEM
transmission electron microscopy
- TfR
transferrin receptor
- TGN
trans-Golgi network
- TIRFM
total internal reflection fluorescence microscopy
- VAMP4
vesicle-associated membrane protein 4
References
- 1.Unger RH. Lipotoxicity in the pathogenesis of obesity-dependent NIDDM. Genetic and clinical implications. Diabetes. 1995;44(8):863–870. doi: 10.2337/diab.44.8.863. [DOI] [PubMed] [Google Scholar]
- 2.Brunham LR, Kruit JK, Pape TD, Timmins JM, Reuwer AQ, Vasanji Z, Marsh BJ, Rodrigues B, Johnson JD, Parks JS, Verchere CB, Hayden MR. Beta-cell ABCA1 influences insulin secretion, glucose homeostasis and response to thiazolidinedione treatment. Nat Med. 2007;13(3):340–347. doi: 10.1038/nm1546. [DOI] [PubMed] [Google Scholar]
- 3.Hao M, Head WS, Gunawardana SC, Hasty AH, Piston DW. Direct effect of cholesterol on insulin secretion: a novel mechanism for pancreatic beta-cell dysfunction. Diabetes. 2007;56(9):2328–2338. doi: 10.2337/db07-0056. [DOI] [PubMed] [Google Scholar]
- 4.Fryirs M, Barter PJ, Rye KA. Cholesterol metabolism and pancreatic beta-cell function. Curr Opin Lipidol. 2009;20(3):159–164. doi: 10.1097/MOL.0b013e32832ac180. [DOI] [PubMed] [Google Scholar]
- 5.Maxfield FR, Tabas I. Role of cholesterol and lipid organization in disease. Nature. 2005;438(7068):612–621. doi: 10.1038/nature04399. [DOI] [PubMed] [Google Scholar]
- 6.Orci L, Montesano R, Meda P, Malaisse-Lagae F, Brown D, Perrelet A, Vassalli P. Heterogeneous distribution of filipin--cholesterol complexes across the cisternae of the Golgi apparatus. Proc Natl Acad Sci U S A. 1981;78(1):293–297. doi: 10.1073/pnas.78.1.293. [DOI] [PMC free article] [PubMed] [Google Scholar]
- 7.Klemm RW, Ejsing CS, Surma MA, Kaiser HJ, Gerl MJ, Sampaio JL, de Robillard Q, Ferguson C, Proszynski TJ, Shevchenko A, Simons K. Segregation of sphingolipids and sterols during formation of secretory vesicles at the trans-Golgi network. J Cell Biol. 2009;185(4):601–612. doi: 10.1083/jcb.200901145. [DOI] [PMC free article] [PubMed] [Google Scholar]
- 8.McIntosh AL, Atshaves BP, Huang H, Gallegos AM, Kier AB, Schroeder F. Fluorescence techniques using dehydroergosterol to study cholesterol trafficking. Lipids. 2008;43(12):1185–1208. doi: 10.1007/s11745-008-3194-1. [DOI] [PMC free article] [PubMed] [Google Scholar]
- 9.Gimpl G. Cholesterol-protein interaction: methods and cholesterol reporter molecules. Subcell Biochem. 2010;51:1–45. doi: 10.1007/978-90-481-8622-8_1. [DOI] [PubMed] [Google Scholar]
- 10.Holtta-Vuori M, Uronen RL, Repakova J, Salonen E, Vattulainen I, Panula P, Li Z, Bittman R, Ikonen E. BODIPY-cholesterol: a new tool to visualize sterol trafficking in living cells and organisms. Traffic. 2008;9(11):1839–1849. doi: 10.1111/j.1600-0854.2008.00801.x. [DOI] [PubMed] [Google Scholar]
- 11.Li Z, Mintzer E, Bittman R. First synthesis of free cholesterol-BODIPY conjugates. J Org Chem. 2006;71(4):1718–1721. doi: 10.1021/jo052029x. [DOI] [PubMed] [Google Scholar]
- 12.Marks DL, Bittman R, Pagano RE. Use of Bodipy-labeled sphingolipid and cholesterol analogs to examine membrane microdomains in cells. Histochem Cell Biol. 2008;130(5):819–832. doi: 10.1007/s00418-008-0509-5. [DOI] [PMC free article] [PubMed] [Google Scholar]
- 13.Arvan P, Castle D. Sorting and storage during secretory granule biogenesis: looking backward and looking forward. Biochem J. 1998;332 (Pt 3):593–610. doi: 10.1042/bj3320593. [DOI] [PMC free article] [PubMed] [Google Scholar]
- 14.Eaton BA, Haugwitz M, Lau D, Moore HP. Biogenesis of regulated exocytotic carriers in neuroendocrine cells. J Neurosci. 2000;20(19):7334–7344. doi: 10.1523/JNEUROSCI.20-19-07334.2000. [DOI] [PMC free article] [PubMed] [Google Scholar]
- 15.Klumperman J, Kuliawat R, Griffith JM, Geuze HJ, Arvan P. Mannose 6-phosphate receptors are sorted from immature secretory granules via adaptor protein AP-1, clathrin, and syntaxin 6-positive vesicles. J Cell Biol. 1998;141(2):359–371. doi: 10.1083/jcb.141.2.359. [DOI] [PMC free article] [PubMed] [Google Scholar]
- 16.Dittie AS, Thomas L, Thomas G, Tooze SA. Interaction of furin in immature secretory granules from neuroendocrine cells with the AP-1 adaptor complex is modulated by casein kinase II phosphorylation. EMBO J. 1997;16(16):4859–4870. doi: 10.1093/emboj/16.16.4859. [DOI] [PMC free article] [PubMed] [Google Scholar]
- 17.Varlamov O, Wu F, Shields D, Fricker LD. Biosynthesis and packaging of carboxypeptidase D into nascent secretory vesicles in pituitary cell lines. J Biol Chem. 1999;274(20):14040–14045. doi: 10.1074/jbc.274.20.14040. [DOI] [PubMed] [Google Scholar]
- 18.Hao M, Bogan JS. Cholesterol regulates glucose-stimulated insulin secretion through phosphatidylinositol 4,5-bisphosphate. J Biol Chem. 2009;284(43):29489–29498. doi: 10.1074/jbc.M109.038034. [DOI] [PMC free article] [PubMed] [Google Scholar]
- 19.Hao M, Li X, Rizzo MA, Rocheleau JV, Dawant BM, Piston DW. Regulation of two insulin granule populations within the reserve pool by distinct calcium sources. J Cell Sci. 2005;118(Pt 24):5873–5884. doi: 10.1242/jcs.02684. [DOI] [PubMed] [Google Scholar]
- 20.Wasmeier C, Hutton JC. Molecular cloning of phogrin, a protein-tyrosine phosphatase homologue localized to insulin secretory granule membranes. J Biol Chem. 1996;271(30):18161–18170. doi: 10.1074/jbc.271.30.18161. [DOI] [PubMed] [Google Scholar]
- 21.Pouli AE, Emmanouilidou E, Zhao C, Wasmeier C, Hutton JC, Rutter GA. Secretory-granule dynamics visualized in vivo with a phogrin-green fluorescent protein chimaera. Biochem J. 1998;333 (Pt 1):193–199. doi: 10.1042/bj3330193. [DOI] [PMC free article] [PubMed] [Google Scholar]
- 22.Toomre D, Bewersdorf J. A new wave of cellular imaging. Annu Rev Cell Dev Biol. 2010;26:285–314. doi: 10.1146/annurev-cellbio-100109-104048. [DOI] [PubMed] [Google Scholar]
- 23.Maxfield FR, Menon AK. Intracellular sterol transport and distribution. Curr Opin Cell Biol. 2006;18(4):379–385. doi: 10.1016/j.ceb.2006.06.012. [DOI] [PubMed] [Google Scholar]
- 24.Lange Y, Ramos BV. Analysis of the distribution of cholesterol in the intact cell. J Biol Chem. 1983;258(24):15130–15134. [PubMed] [Google Scholar]
- 25.Ikonen E. Cellular cholesterol trafficking and compartmentalization. Nat Rev Mol Cell Biol. 2008;9(2):125–138. doi: 10.1038/nrm2336. [DOI] [PubMed] [Google Scholar]
- 26.von Zastrow M, Castle JD. Protein sorting among two distinct export pathways occurs from the content of maturing exocrine storage granules. J Cell Biol. 1987;105(6 Pt 1):2675–2684. doi: 10.1083/jcb.105.6.2675. [DOI] [PMC free article] [PubMed] [Google Scholar]
- 27.Hao M, Lin SX, Karylowski OJ, Wustner D, McGraw TE, Maxfield FR. Vesicular and non-vesicular sterol transport in living cells. The endocytic recycling compartment is a major sterol storage organelle. J Biol Chem. 2002;277(1):609–617. doi: 10.1074/jbc.M108861200. [DOI] [PubMed] [Google Scholar]
- 28.Ross AC, Go KJ, Heider JG, Rothblat GH. Selective inhibition of acyl coenzyme A:cholesterol acyltransferase by compound 58–035. J Biol Chem. 1984;259(2):815–819. [PubMed] [Google Scholar]
- 29.Bauerfeind R, Huttner WB. Biogenesis of constitutive secretory vesicles, secretory granules and synaptic vesicles. Curr Opin Cell Biol. 1993;5(4):628–635. doi: 10.1016/0955-0674(93)90132-a. [DOI] [PubMed] [Google Scholar]
- 30.Kogel T, Gerdes HH. Roles of myosin Va and Rab3D in membrane remodeling of immature secretory granules. Cell Mol Neurobiol. 2010;30(8):1303–1308. doi: 10.1007/s10571-010-9597-6. [DOI] [PMC free article] [PubMed] [Google Scholar]
- 31.Kakhlon O, Sakya P, Larijani B, Watson R, Tooze SA. GGA function is required for maturation of neuroendocrine secretory granules. EMBO J. 2006;25(8):1590–1602. doi: 10.1038/sj.emboj.7601067. [DOI] [PMC free article] [PubMed] [Google Scholar]
- 32.Bock JB, Klumperman J, Davanger S, Scheller RH. Syntaxin 6 functions in trans-Golgi network vesicle trafficking. Mol Biol Cell. 1997;8(7):1261–1271. doi: 10.1091/mbc.8.7.1261. [DOI] [PMC free article] [PubMed] [Google Scholar]
- 33.Grimmer S, Ying M, Walchli S, van Deurs B, Sandvig K. Golgi vesiculation induced by cholesterol occurs by a dynamin- and cPLA2-dependent mechanism. Traffic. 2005;6(2):144–156. doi: 10.1111/j.1600-0854.2005.00258.x. [DOI] [PubMed] [Google Scholar]
- 34.Ghosh RN, Mallet WG, Soe TT, McGraw TE, Maxfield FR. An endocytosed TGN38 chimeric protein is delivered to the TGN after trafficking through the endocytic recycling compartment in CHO cells. J Cell Biol. 1998;142(4):923–936. doi: 10.1083/jcb.142.4.923. [DOI] [PMC free article] [PubMed] [Google Scholar]
- 35.Tooze SA, Flatmark T, Tooze J, Huttner WB. Characterization of the immature secretory granule, an intermediate in granule biogenesis. J Cell Biol. 1991;115(6):1491–1503. doi: 10.1083/jcb.115.6.1491. [DOI] [PMC free article] [PubMed] [Google Scholar]
- 36.Katsumata O, Fujita-Yoshigaki J, Hara-Yokoyama M, Yanagishita M, Furuyama S, Sugiya H. Syntaxin6 separates from GM1a-rich membrane microdomain during granule maturation. Biochem Biophys Res Commun. 2007;357(4):1071–1077. doi: 10.1016/j.bbrc.2007.04.053. [DOI] [PubMed] [Google Scholar]
- 37.Sturek JM, Castle JD, Trace AP, Page LC, Castle AM, Evans-Molina C, Parks JS, Mirmira RG, Hedrick CC. An intracellular role for ABCG1-mediated cholesterol transport in the regulated secretory pathway of mouse pancreatic beta cells. J Clin Invest. 2010;120(7):2575–2589. doi: 10.1172/JCI41280. [DOI] [PMC free article] [PubMed] [Google Scholar]
- 38.Hinners I, Wendler F, Fei H, Thomas L, Thomas G, Tooze SA. AP-1 recruitment to VAMP4 is modulated by phosphorylation-dependent binding of PACS-1. EMBO Rep. 2003;4(12):1182–1189. doi: 10.1038/sj.embor.7400018. [DOI] [PMC free article] [PubMed] [Google Scholar]
- 39.Tsuboi T, Rutter GA. Multiple forms of “kiss-and-run” exocytosis revealed by evanescent wave microscopy. Curr Biol. 2003;13(7):563–567. doi: 10.1016/s0960-9822(03)00176-3. [DOI] [PubMed] [Google Scholar]
- 40.Hohmeier HE, Mulder H, Chen G, Henkel-Rieger R, Prentki M, Newgard CB. Isolation of INS-1-derived cell lines with robust ATP-sensitive K+ channel-dependent and -independent glucose-stimulated insulin secretion. Diabetes. 2000;49(3):424–430. doi: 10.2337/diabetes.49.3.424. [DOI] [PubMed] [Google Scholar]
- 41.Olofsson CS, Gopel SO, Barg S, Galvanovskis J, Ma X, Salehi A, Rorsman P, Eliasson L. Fast insulin secretion reflects exocytosis of docked granules in mouse pancreatic B-cells. Pflugers Arch. 2002;444(1–2):43–51. doi: 10.1007/s00424-002-0781-5. [DOI] [PubMed] [Google Scholar]
- 42.Mesmin B, Maxfield FR. Intracellular sterol dynamics. Biochim Biophys Acta. 2009;1791(7):636–645. doi: 10.1016/j.bbalip.2009.03.002. [DOI] [PMC free article] [PubMed] [Google Scholar]
- 43.Lange Y, Steck TL. Cholesterol homeostasis and the escape tendency (activity) of plasma membrane cholesterol. Prog Lipid Res. 2008;47(5):319–332. doi: 10.1016/j.plipres.2008.03.001. [DOI] [PMC free article] [PubMed] [Google Scholar]
- 44.Arvan P, Halban PA. Sorting ourselves out: seeking consensus on trafficking in the beta-cell. Traffic. 2004;5(1):53–61. doi: 10.1111/j.1600-0854.2004.00152.x. [DOI] [PubMed] [Google Scholar]
- 45.Takahashi N, Hatakeyama H, Okado H, Miwa A, Kishimoto T, Kojima T, Abe T, Kasai H. Sequential exocytosis of insulin granules is associated with redistribution of SNAP25. J Cell Biol. 2004;165(2):255–262. doi: 10.1083/jcb.200312033. [DOI] [PMC free article] [PubMed] [Google Scholar]
- 46.Brodwick MS, Curran M, Edwards C. Effects of osmotic stress on mast cell vesicles of the beige mouse. J Membr Biol. 1992;126(2):159–169. doi: 10.1007/BF00231914. [DOI] [PubMed] [Google Scholar]
- 47.Hui SW, Stewart CM, Carpenter MP, Stewart TP. Effects of cholesterol on lipid organization in human erythrocyte membrane. J Cell Biol. 1980;85(2):283–291. doi: 10.1083/jcb.85.2.283. [DOI] [PMC free article] [PubMed] [Google Scholar]
- 48.Colliver TL, Pyott SJ, Achalabun M, Ewing AG. VMAT-Mediated changes in quantal size and vesicular volume. J Neurosci. 2000;20(14):5276–5282. doi: 10.1523/JNEUROSCI.20-14-05276.2000. [DOI] [PMC free article] [PubMed] [Google Scholar]
- 49.Gong LW, Hafez I, Alvarez de Toledo G, Lindau M. Secretory vesicles membrane area is regulated in tandem with quantal size in chromaffin cells. J Neurosci. 2003;23(21):7917–7921. doi: 10.1523/JNEUROSCI.23-21-07917.2003. [DOI] [PMC free article] [PubMed] [Google Scholar]
- 50.Kim T, Zhang CF, Sun Z, Wu H, Loh YP. Chromogranin A deficiency in transgenic mice leads to aberrant chromaffin granule biogenesis. J Neurosci. 2005;25(30):6958–6961. doi: 10.1523/JNEUROSCI.1058-05.2005. [DOI] [PMC free article] [PubMed] [Google Scholar]
- 51.Ohashi M, Jan de Vries K, Frank R, Snoek G, Bankaitis V, Wirtz K, Huttner WB. A role for phosphatidylinositol transfer protein in secretory vesicle formation. Nature. 1995;377(6549):544–547. doi: 10.1038/377544a0. [DOI] [PubMed] [Google Scholar]
- 52.Ornberg RL, Furuya S, Goping G, Kuijpers GA. Granule swelling in stimulated bovine adrenal chromaffin cells: regulation by internal granule pH. Cell Tissue Res. 1995;279(1):85–92. doi: 10.1007/BF00300694. [DOI] [PubMed] [Google Scholar]
- 53.Sobo K, Le Blanc I, Luyet PP, Fivaz M, Ferguson C, Parton RG, Gruenberg J, van der Goot FG. Late endosomal cholesterol accumulation leads to impaired intra-endosomal trafficking. PLoS One. 2007;2(9):e851. doi: 10.1371/journal.pone.0000851. [DOI] [PMC free article] [PubMed] [Google Scholar]
- 54.Juhl K, Hoy M, Olsen HL, Bokvist K, Efanov AM, Hoffmann EK, Gromada J. cPLA2alpha-evoked formation of arachidonic acid and lysophospholipids is required for exocytosis in mouse pancreatic beta-cells. Am J Physiol Endocrinol Metab. 2003;285(1):E73–81. doi: 10.1152/ajpendo.00086.2003. [DOI] [PubMed] [Google Scholar]
- 55.Liscum L. Niemann-Pick type C mutations cause lipid traffic jam. Traffic. 2000;1(3):218–225. doi: 10.1034/j.1600-0854.2000.010304.x. [DOI] [PubMed] [Google Scholar]
- 56.Scales SJ, Chen YA, Yoo BY, Patel SM, Doung YC, Scheller RH. SNAREs contribute to the specificity of membrane fusion. Neuron. 2000;26(2):457–464. doi: 10.1016/s0896-6273(00)81177-0. [DOI] [PubMed] [Google Scholar]
- 57.Miyazaki J, Araki K, Yamato E, Ikegami H, Asano T, Shibasaki Y, Oka Y, Yamamura K. Establishment of a pancreatic beta cell line that retains glucose-inducible insulin secretion: special reference to expression of glucose transporter isoforms. Endocrinology. 1990;127(1):126–132. doi: 10.1210/endo-127-1-126. [DOI] [PubMed] [Google Scholar]
- 58.Pongratz RL, Kibbey RG, Kirkpatrick CL, Zhao X, Pontoglio M, Yaniv M, Wollheim CB, Shulman GI, Cline GW. Mitochondrial dysfunction contributes to impaired insulin secretion in INS-1 cells with dominant-negative mutations of HNF-1alpha and in HNF-1alpha-deficient islets. J Biol Chem. 2009;284(25):16808–16821. doi: 10.1074/jbc.M807723200. [DOI] [PMC free article] [PubMed] [Google Scholar]
- 59.Xu Y, Rubin BR, Orme CM, Karpikov A, Yu C, Bogan JS, Toomre DK. Dual-mode of insulin action controls GLUT4 vesicle exocytosis. J Cell Biol. 2011;193(4):643–653. doi: 10.1083/jcb.201008135. [DOI] [PMC free article] [PubMed] [Google Scholar]
- 60.Sugawara K, Shibasaki T, Mizoguchi A, Saito T, Seino S. Rab11 and its effector Rip11 participate in regulation of insulin granule exocytosis. Genes Cells. 2009;14(4):445–456. doi: 10.1111/j.1365-2443.2009.01285.x. [DOI] [PubMed] [Google Scholar]
- 61.Amundson DM, Zhou M. Fluorometric method for the enzymatic determination of cholesterol. J Biochem Biophys Methods. 1999;38(1):43–52. doi: 10.1016/s0165-022x(98)00036-0. [DOI] [PubMed] [Google Scholar]
- 62.Hao M, Maxfield FR. Characterization of rapid membrane internalization and recycling. J Biol Chem. 2000;275(20):15279–15286. doi: 10.1074/jbc.275.20.15279. [DOI] [PubMed] [Google Scholar]
Associated Data
This section collects any data citations, data availability statements, or supplementary materials included in this article.
Supplementary Materials
Video 1. Half-view 3D reconstruction of an insulin granule imaged by SIM with a 180° rotation about the z-axis. MIN6 cells were transfected with phogrin-mCherry (red), labeled with BODIPY-chol (green), and imaged live by 3D super-resolution SIM. The last frame displays an en face view of the orthogonal distribution of the two probes surrounding a hollow core. White bar: 0.5 μm.
Supplemental Figure 1. (A–C) Filipin staining colocalizes with phogrin-mCherry in fixed MIN6 cells. Cells were transfected with phogrin-mCherry, fixed and stained with a fluorescent cholesterol probe, filipin. Wide-field images were acquired using the standard rhodamine setting for phogrin-mCherry and the DAPI setting for filipin. Filipin and phogrin-mCherry are green and red in the merged image, respectively. (D–F) BODIPY-chol accumulates in recycling endosomes in 3T3-L1 mouse fibroblasts. 3T3-L1 cells were incubated with BODIPY-chol for 3 h at 37 °C, rinsed, and then with 10 μg/ml Alexa 633-Tf for 1 h at 37 °C. A single confocal plane is shown. Bar, 10 μm.
Supplemental Figure 2. (A, B) Endogenous cholesterol is enriched in insulin granules of INS1 rat cells. Subcellular fractionation was used to determine intracellular distribution of endogenous cholesterol. Postnuclear INS1 homogenates were subjected to equilibrium centrifugation on sucrose gradients, which separated intracellular organelles according to density. Sucrose density increased with fraction numbers. Equal volume aliquots were taken from each fraction, and immunoblotted for intracellular markers (A) or measured for insulin and cholesterol contents (B). Insulin was quantified by ELISA; cholesterol was extracted with organic solvents and measured by a fluorometric assay. For display purposes, both values were normalized to the highest value in each type of measurement. The results presented in this figure were obtained from the same experiment for internal comparison, and are representative of three independent experiments. (C) Excess cholesterol alters insulin granule properties in INS1 cells. Insulin distribution was measured by ELISA upon subcellular fractionation by equilibrium centrifugation on sucrose gradients. CHOL treatment resulted in a shift of insulin granules toward lighter sucrose fractions, indicating a decrease in granule density.
Supplemental Figure 3. Excess cholesterol affects the steady state distribution of immature granule markers, VAMP4 and syntaxin 6, but not a resident integral membrane protein of the TGN, TGN38. (A–F) Control and CHOL-treated MIN6 cells transfected with ST-mRFP (B, E) were immunostained with VAMP4 antibody (A, D). (G–L) Control and CHOL-treated MIN6 cells were immunostained with TGN38 (G, J) and syntaxin 6 (H, K) antibodies. (I, L) Differential interference contrast (DIC) images. (M–O) CHOL-treated MIN6 cells were stained with insulin (M, red) and syntaxin 6 (N, green) antibodies. Shown here is an example of extensive colocalization between insulin and syntaxin 6, indicating that Syntaxin 6 may be trapped in the mature granules in cholesterol-overloaded cells. All images show single confocal planes. Bar, 10 μm.
Supplemental Figure 4. Hyperglycemia leads to enlarged granule morphology. (A) Prolonged exposure of MIN6 cells to high glucose (30 mM, 36 h) shifted insulin granules to lighter fractions on sucrose gradients by equilibrium centrifugation. Sucrose density increased with fraction numbers. (B) TEM analysis shows high glucose resulted in a greater ratio of granule diameter to core diameter. (C) The BODIPY-chol positive structures in live MIN6 cells were enlarged after high-glucose treatment. These are single plane confocal images. Bar, 10 μm. (D) Area measurement of BODIPY-chol clusters after image thresholding. Data are mean ± SEM. * p<0.05 by student t-test.