Abstract
The melanocortin-3 receptor (MC3R) is a member of family A rhodopsin-like G protein-coupled receptor. Mouse genetic studies suggested that MC3R and the related MC4R are non-redundant regulators of energy homeostasis. Lack of Mc3r leads to higher feed efficiency and fat mass. However, until now only a few MC3R mutations have been identified in humans and the role of MC3R in the pathogenesis of obesity was unclear. In the present study, we performed detailed functional studies on nine naturally occurring MC3R mutations recently reported. We found that all nine mutants had decreased cell surface expression. A260V, M275T, and L297V had decreased total expression whereas the other six mutants had normal total expression. Mutants S69C and T280S exhibited significant defects in ligand binding and signaling. The dramatic defects of T280S might be partially caused by decreased cell surface expression. In addition, we found mutants M134I and M275T had decreased maximal binding but displayed similar signaling properties as wild-type MC3R. All the other mutants had normal binding and signaling activities. Co-expression studies showed that all mutants except L297V did not affect wild-type MC3R signaling. Multiple mutations at T280 demonstrated the necessity of Thr for cell surface expression, ligand binding, and signaling. In summary, we provided detailed data of these novel human MC3R mutations leading to a better understanding of structure-function relationship of MC3R and the role of MC3R mutation in obesity.
Keywords: Melanocortin-3 receptor, Naturally occurring mutations, Obesity, Binding, Signaling, Cell surface expression
1. Introduction
Obesity, due to imbalance of energy intake and energy expenditure, has become an alarming epidemic in the western world. The causes of obesity include environmental, psychosocial and genetics factors [1]. Through the studies of identifying genetic factors of obesity, mutations in several genes encoding proteins involved in regulation of energy homeostasis have been found to be associated with obesity [2–5].
The melanocortin-3 receptor (MC3R) is considered a potential regulator of energy homeostasis [6–8]. It is a member of family A G protein-coupled receptors (GPCRs) [9, 10]. The principal endogenous ligands of MC3R are the small peptides cleaved from the proopiomelanocortin (POMC), including α- and γ-melanocyte-stimulating hormones (MSH). The endogenous antagonist for MC3R is Agouti-related protein [11, 12], which we showed to be also an inverse agonist for the MC3R [13]. MC3R is expressed in brain, placenta, stomach, duodenum, pancreas [9], kidney [14], as well as macrophages [15]. The highest density of MC3R mRNA has been found in hypothalamus, especially the ventromedial hypothalamic nucleus, the arcuate nucleus and the posterior hypothalamic area [16]. Since hypothalamus plays a key role in controlling energy homeostasis [11, 17], it was hypothesized that MC3R is involved in the regulation of energy homeostasis.
Rodent genetic studies showed that in the absence of Mc3r, mice did not exhibit hyperphagia [6, 7]. Due to a higher feed efficiency and alterations in nutrient partitioning, Mc3r knockout mice have increased fat mass, reduced lean mass, and normal metabolism with normal or even slightly decreased food intake [6–8]. In situ hybridization indicated that MC3R mRNA is distributed similarly with that of POMC mRNA in the arcuate nucleus, suggesting that MC3R also served as an inhibitory autoreceptor on POMC neurons and therefore stimulate food intake [18]. Recently, it is also reported that MC3R plays a critical role in entrainment to restricted feeding [19, 20].
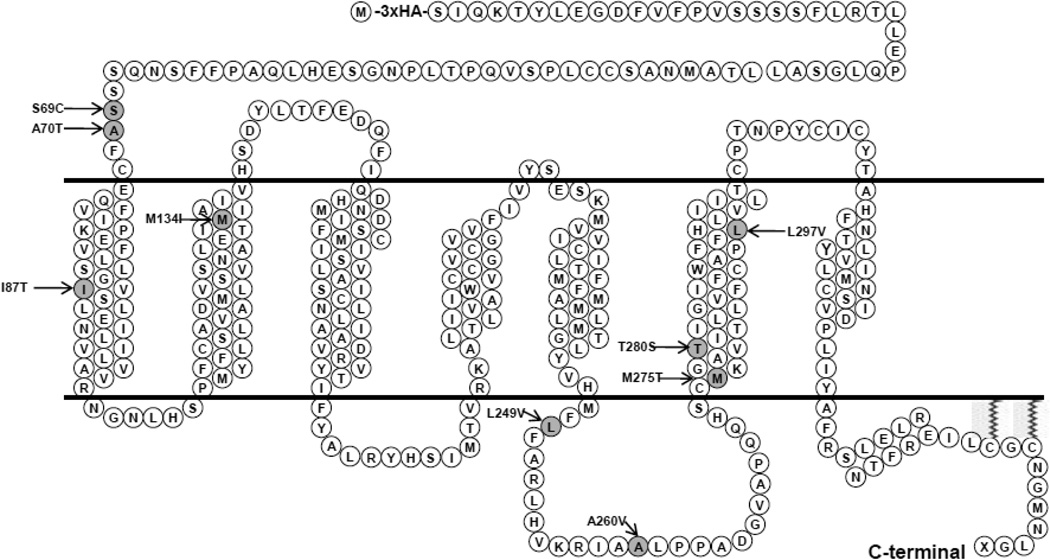
The role of MC3R mutation in human obesity is controversial. Unlike MC4R, where over 150 mutations have been identified [21], relatively few MC3R mutations have been reported [22–28] (reviewed in [29]). Recently, nine novel naturally occurring MC3R mutations were reported in Singaporean patients, two North American cohorts, and a Finnish cohort [24, 26, 30] (Fig. 1), but the functions of these mutations were incompletely characterized. In this study, we performed detailed functional analysis of these mutations in vitro.
Figure 1.
Schematic model of the human MC3R with the mutations studied in this study highlighted.
2. Materials and Methods
2.1. Plasmid and peptides
Wild-type (WT) human MC3R (hMC3R) cDNA tagged with 3×HA tags at the N-terminus inserted in vector pcDNA3.1 was obtained from Missouri S&T cDNA Resource Center (http://www.cDNA.org/, Rolla, MO). [Nle4, d-Phe7]-α-MSH (NDP-MSH) was purchased from Bachem (King of Prussia, PA). α-MSH was purchased from Phoenix Pharmaceuticals (Belmont, CA). d-Trp8-γ-MSH was obtained from Peptides International (Louisville, KY). 125I-NDP-MSH was obtained from the Peptide Radioiodination Service Center at the University of Mississippi (University, MS).
2.2. Site-directed mutagenesis of the human MC3R
Human MC3R mutations were generated by QuikChange™ site-directed mutagenesis kit (Stratagene, La Jolla, CA). Plasmids were prepared using IsoPure DNA purification kits from Denville Scientific (Metuchen, NJ). Automated DNA sequencing was performed by the DNA Sequencing Facility of University of Chicago Cancer Research Center (Chicago, IL) to confirm that the correct mutation was generated and no errors were introduced during the cycling reactions.
2.3. Cells and transfections
Human Embryonic Kidney (HEK) 293T cells, obtained from American Type Culture Collection (Manassas, VA), were grown at 5% CO2 in Dulbecco’s Modified Eagle’s Medium (DMEM) supplemented with 50 µg/ml of gentamicin, 100 IU/ml of penicillin, 100 µg/ml of streptomycin, 20µg/ml of amphotericin B, 10 mM Hepes and 10% newborn calf serum. Cells were plated on gelatin-coated 35mm 6-well clusters from Corning (Corning, NY). When the cells reached 50–70% confluency, transient transfection was performed with the calcium precipitation method [31]. One microgram of plasmid in 2ml media was used per 35mm well. Cells were incubated for approximately 48h after transfection before used to measure ligand binding and ligand stimulated cAMP generation.
2.4. Ligand binding to intact cells
Forty-eight hours after transfection, cells were washed twice with warm Waymouth’s MB752/1 media (Sigma-Aldrich, St. Louis, MO) containing 1mg/ml bovine serum albumin (BSA) (referred to as Waymouth/BSA). Fresh Waymouth/BSA was added to each well, incubated with 50 µl of 125I-NDP-MSH (~100,000 cpm) with or without different concentrations of unlabeled NDP-MSH, α-MSH or d-Trp8-γ-MSH at 37 C for 1h. The total volume in each well was 1 ml. The final concentrations of unlabeled ligands are indicated in the figures. After incubation, cells were washed twice with cold Hank’s balanced salt solution (Sigma-Aldrich) containing 1 mg/ml BSA to terminate the reaction. Then cells of each well were solubilized with 100µl of 0.5N NaOH. Cell lysates were collected with cotton swabs and counted in a gamma counter. All determinations were performed in duplicate and the experiment was performed at least three times. Maximal binding capacity (Bmax) and IC50 values were calculated using GraphPad Prism 4.0 (San Diego, CA).
2.5. Ligand stimulated cAMP generation
After 48h incubation, transfected HEK-293T cells were washed twice with warm Waymouth/BSA. Then fresh Waymouth/BSA containing 0.5mM isobutylmethylxanthine (Sigma-Aldrich) was added to each well. After 15 min incubation at 37 C, either Waymouth/BSA alone or different concentrations of ligands were added. The total volume in each well was 1 ml. The final concentrations of the ligands are indicated in the figures. After 1h incubation at 37 C, cells were then placed on ice to terminate the reaction, media were aspirated and intracellular cAMP were extracted with 0.5N percholoric acid containing 180µg/ml theophylline. The cAMP concentrations were measured by radioimmunoassay [13, 32]. All determinations were performed in triplicate and the experiment was performed at least three times. Maximal responses (Rmax) and EC50 values were calculated by GraphPad Prism 4.0.
2.6. Localization of MC3R expression by confocal microscopy
HEK293 cells stably transfected with WT or mutant hMC3Rs containing 3×HA tags at the N-terminus were plated onto poly-D-lysine-coated slides (Biocoat cellware from Falcon) and were immunostained with Alexa Flour 488-conjugated anti-HA.11 antibody on the third day using a protocol based on our previous report [33]. Briefly, on the day of experiment, cells were washed with filtered phosphate buffered saline for immunohistochemistry (PBS-IH) for three times and then were fixed with 4% paraformaldehyde in PBS-IH for 30 min. After three more washes with PBS-IH, cells were incubated with blocking solution (5% BSA in PBS-IH) for 1h at room temperature, and incubated with Alexa Fluor 488-labeled anti-HA.11 antibody (Covance, Berkeley, CA) diluted 1:100 in PBS-IH containing 0.5% BSA for 1h at room temperature in the dark. Then the cells were washed five times with PBS-IH and covered with VectaShield Mounting Media (Vector Laboratories) and a glass coverslip. Images were collected with a Bio-Rad laser scanning confocal microscope with excitation by 488nm argon laser and detected with a 530- to 560-nm filter.
2.7. Quantification of MC3R expression by flow cytometry
Flow cytometry was performed as described previously [34–36]. Briefly, HEK293 cells were plated on gelatin-coated 35mm 6-well clusters and transfected with 4 micrograms of plasmid in 2ml media for each well. After 48h incubation, cells were washed once with filtered PBS-IH, detached, and then precipitated by centrifugation at 500 × g. Cells were fixed by 4% paraformaldehyde in PBS-IH for 30 min, and for measuring total expression, cells were permeabilized with 1% Triton X-100 in PBS-IH for 4 min (this step was omitted for measuring cell surface expression). Cells were then blocked with PBS-IH containing 5% BSA for 1h. The cells were then stained with primary anti-HA.11 antibody (Covance) diluted 1:50 in PBS-IH containing 0.5% BSA for 1h, and washed with PBS-IH containing 0.5% BSA. The secondary Alexa Fluor 488-conjugated goat anti-mouse IgG (Invitrogen, Carlsbad, CA) diluted 1:2000 in PBS-IH containing 0.5% BSA was added under low light. After 1h incubation, cells were washed and resuspended in PBS-IH with 0.5% BSA. An Accuri flow cytometer with a 488-nm wavelength laser was applied to quantify hMC3R mutant expression in 15,000 cells from each transfection. Cells transfected with pcDNA3.1 empty vector were used as control for background staining. All the incubations and washes were performed at room temperature. The expression levels of the mutants were calculated as percentage of WT hMC3R expression as described before using the formula: [mutant − pcDNA3]/[WT − pcDNA3] ×100% [34–36]. Samples of cells transfected with pcDNA3.1 empty vector or WT hMC3R were included in each experiment and processed together with the samples transfected with mutant hMC3Rs.
2.8. Statistical analyses
Student’s t test was used to determine the significance of differences in the expression, ligand binding and signaling parameters between WT and mutant hMC3Rs. Statistical analysis was carried out using GraphPad Prism 4.0.
3. Results
3.1. Signaling properties of the mutant hMC3Rs in response to NDP-MSH, d-Trp8-γ-MSH or α-MSH stimulation
In order to investigate whether the missense mutations in human MC3R cause any alterations in the function of the receptor, the levels of intracellular cAMP generated in response to the agonists were measured.
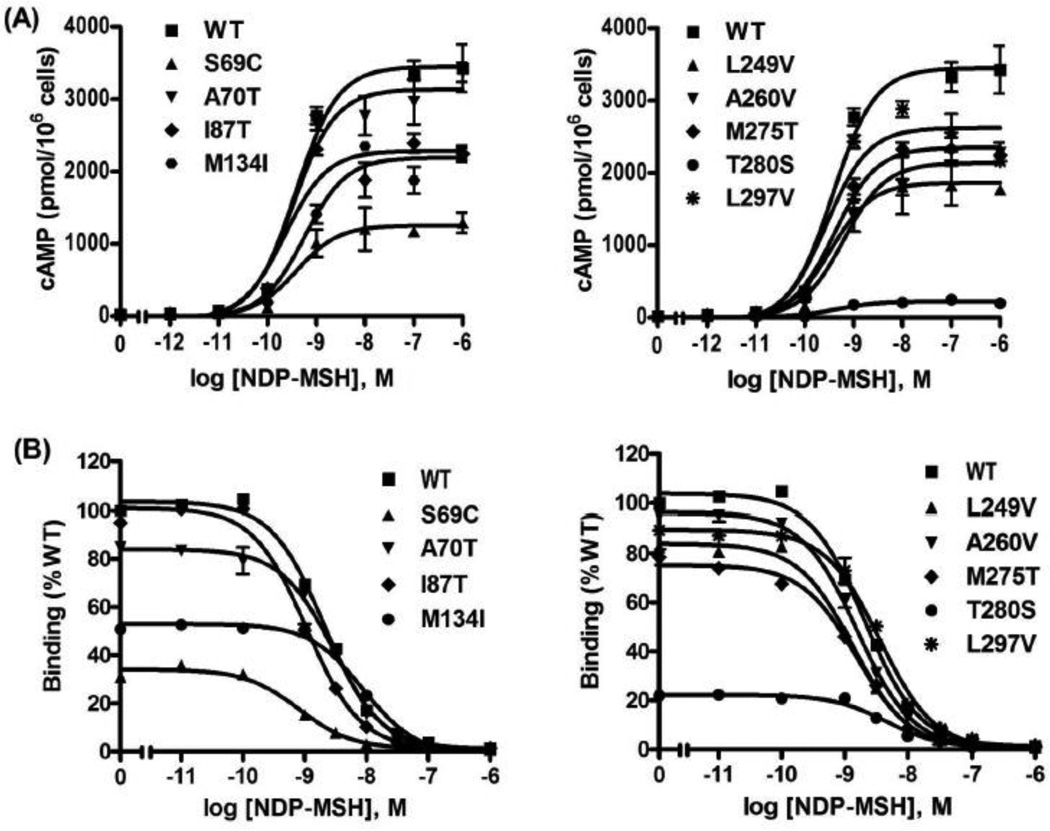
We first studied the signaling response to NDP-MSH stimulation. NDP-MSH is a superpotent analog of MCRs except MC2R [37]. As expected, NDP-MSH caused dose-dependent increases in intracellular cAMP levels in cells transfected with WT hMC3R. Fig. 2A showed the results of a typical experiment. In response to NDP-MSH, all the mutants showed similar EC50 as that of WT hMC3R. S69C and T280S displayed significant reduction in the maximal levels of cAMP generation compared to that of WT hMC3R (Table 1). The other mutants had apparent normal signaling.
Figure 2.
Signaling and ligand binding properties of the WT and mutant hMC3 NDP-MSH as the ligand. HEK293T cells were transiently transfected with the indicated hMC3R constructs and binding and signaling of the hMC3Rs were measured as described in Materials and Methods. In (A), HEK293T cells transiently transfected with the indicated hMC3R constructs were stimulated with different concentrations of NDP-MSH. Intracellular cAMP levels were measured using RIA. Results are expressed as the mean ± SEM of triplicate determinations within one experiment. In (B), different concentrations of unlabeled NDP-MSH were used to displace the binding of 125I-NDP-MSH to hMC3Rs on intact cells. Results shown are expressed as % of WT binding ± range from duplicate determinations within one experiment. All experiments were performed at least three times.
Table 1.
Binding and signaling properties of WT and mutant hMC3Rs with NDP-MSH as the ligand.
| hMC3R | n | NDP-MSH binding | NDP-MSH-stimulated cAMP | |
|---|---|---|---|---|
| IC50 (nM) | EC50 (nM) | Rmax (% WT) | ||
| WT | 8 | 2.06±0.37 | 0.36±0.02 | 100.00 |
| S69C | 3 | 0.81±0.04b | 0.39±0.07 | 54.67±8.49a |
| A70T | 3 | 1.88±0.56 | 0.37±0.13 | 103.96±2.18 |
| I87T | 3 | 1.08±0.11a | 0.29±0.09 | 91.05±10.14 |
| M134I | 3 | 1.94±0.49 | 0.51±0.08 | 80.31±12.26 |
| L249V | 3 | 1.98±0.41 | 0.43±0.12 | 84.98±18.29 |
| A260V | 3 | 1.53±0.03 | 0.52±0.17 | 91.96±18.09 |
| M275T | 3 | 2.22±0.65 | 0.46±0.04 | 89.72±7.27 |
| T280S | 3 | 1.07±0.13a | 0.29±0.15 | 12.86±5.64b |
| L297V | 3 | 2.30±0.66 | 0.49±0.23 | 106.87±14.46 |
Significantly different from the WT hMC3R, p < 0.05.
Significantly different from the WT hMC3R, p < 0.01.
The data are expressed as the mean ± SEM for the mutant hMC3Rs. The maximal responses (Rmax) were 2142 ± 507.5 pmol cAMP/106 cells for WT hMC3R.
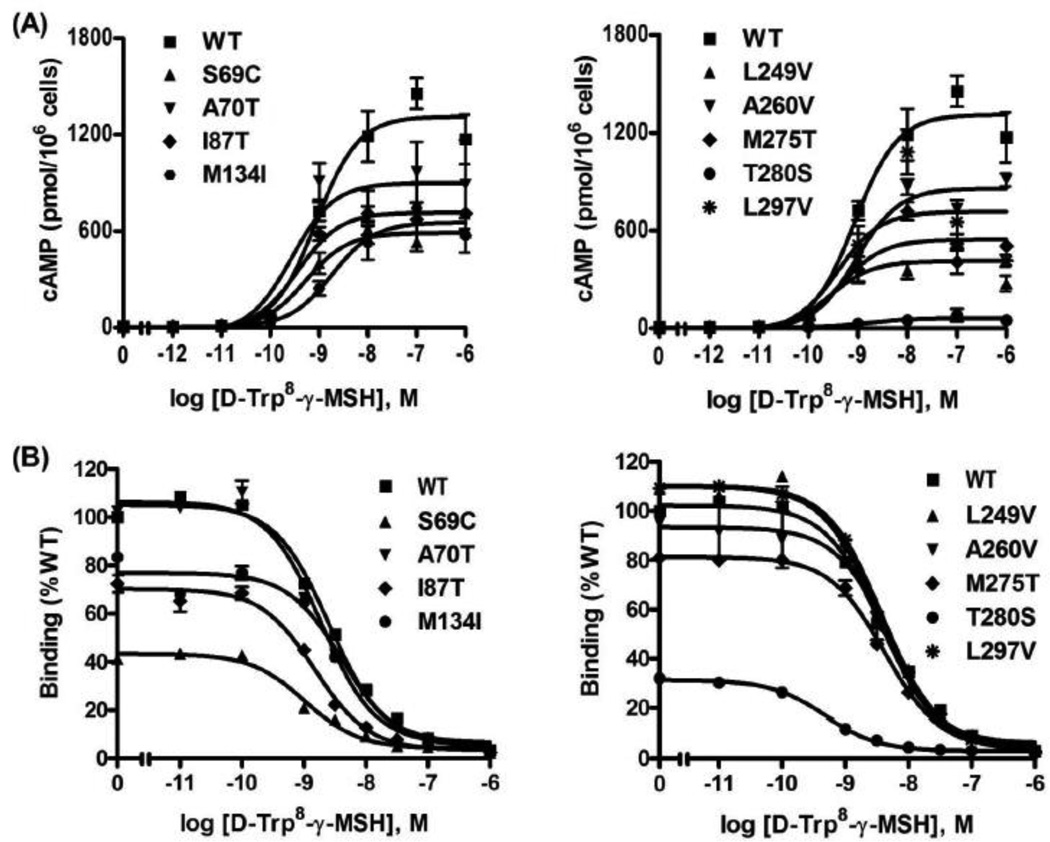
Then the signaling property was tested with d-Trp8-γ-MSH (Fig. 3A), which is a superpotent and more selective analog of γ-MSH [38]. γ-MSH is a potent endogenous MC3R agonist. With the stimulation of d-Trp8-γ-MSH, similar results to NDP-MSH stimulation were obtained (Table 2). Only S69C and T280S had significant decreases in maximal signaling compared to WT hMC3R (Table 2).
Figure 3.
Signaling and ligand binding properties of the WT and mutant hMC3 d-Trp8-γ-MSH as the ligand. See the legend to Fig. 2 for details. The only difference is that d-Trp8-γ-MSH was used as the ligand instead of NDP-MSH.
Table 2.
Binding and signaling properties of WT and mutant hMC3Rs with d-Trp8-γ-MSH as the ligand.
| hMC3R | n | d-Trp8-γ-MSH binding | d-Trp8-γ-MSH-stimulated cAMP | |
|---|---|---|---|---|
| IC50 (nM) | EC50 (nM) | Rmax (% WT) | ||
| WT | 15 | 9.86±2.47 | 0.76±0.08 | 100.00 |
| S69C | 3 | 8.20±2.38 | 0.57±0.11 | 42.59±1.40c |
| A70T | 3 | 4.38±1.27 | 0.95±0.24 | 145.97±40.50 |
| I87T | 3 | 4.49±1.52 | 0.38±0.10b | 82.38±13.93 |
| M134I | 3 | 18.98±1.26 | 1.26±0.13 | 128.96±31.04 |
| L249V | 3 | 6.19±1.25 | 0.52±0.07 | 111.78±7.54 |
| A260V | 3 | 4.99±1.49 | 1.01±0.17 | 99.85±33.38 |
| M275T | 3 | 4.49±0.21 | 0.45±0.04 | 119.87±29.30 |
| T280S | 3 | 0.52±0.05a | 2.17±0.48 | 3.76±1.00b |
| L297V | 3 | 4.53±1.51 | 0.46±0.02 | 137.78±19.95 |
Significantly different from the WT hMC3R, p < 0.05.
Significantly different from the WT hMC3R, p < 0.01.
Significantly different from the WT hMC3R, p < 0.001.
The data are expressed as the mean ± SEM for the mutant hMC3Rs. The maximal responses (Rmax) were 1747.31 ± 433.39 pmol cAMP/106 cells for WT hMC3R.
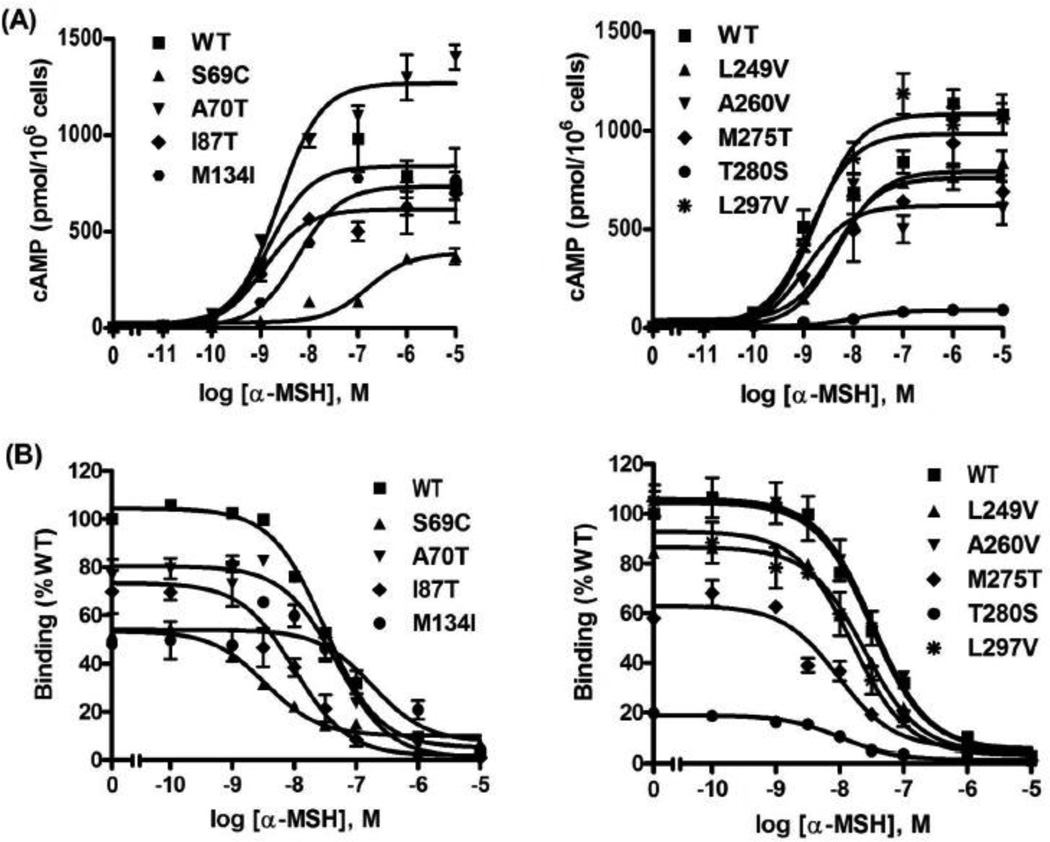
The signaling property was also investigated with the stimulation of α-MSH, an endogenous agonist (Fig. 4A). The EC50 of WT hMC3R for α-MSH was about 5-fold higher than that for NDP-MSH. S69C and T280S displayed significantly increased EC50 and significantly decreased maximal signaling (Table 3). All the other mutants had normal signaling properties compared to WT hMC3R.
Figure 4.
Signaling and ligand binding properties of the WT and mutant hMC3 α-MSH as the ligand. See the legend to Fig. 2 for details. The only difference is that α-MSH was used as the ligand instead of NDP-MSH.
Table 3.
Binding and signaling properties of WT and mutant hMC3Rs with α-MSH as the ligand.
| hMC3R | n | α-MSH binding | α-MSH-stimulated cAMP | |
|---|---|---|---|---|
| IC50 (nM) | EC50 (nM) | Rmax (% WT) | ||
| WT | 13 | 36.68±6.50 | 1.68±0.19 | 100.00 |
| S69C | 4 | 6.75±1.57a | 4.42±0.59a | 36.34±0.89c |
| A70T | 3 | 30.39±9.27 | 2.42±0.09 | 194.46±79.36 |
| I87T | 3 | 6.60±1.75a | 1.96±0.52 | 107.42±22.47 |
| M134I | 3 | 31.1±13.28 | 7.48±2.05 | 129.69±39.45 |
| L249V | 3 | 27.73±1.81 | 3.69±0.94 | 133.33±28.31 |
| A260V | 3 | 26.00±3.69 | 2.07±0.51 | 97.42±21.32 |
| M275T | 3 | 24.76±8.99 | 3.64±0.87 | 71.97±18.10 |
| T280S | 3 | 3.44±0.60a | 22.39±5.72a | 4.20±3.32b |
| L297V | 3 | 32.31±10.73 | 2.37±0.37 | 145.61±31.40 |
Significantly different from the WT hMC3R, p < 0.05.
Significantly different from the WT hMC3R, p < 0.01.
Significantly different from the WT hMC3R, p < 0.001.
The data are expressed as the mean ± SEM for the mutant hMC3Rs. The maximal responses (Rmax) were 1407.77 ± 411.25 pmol cAMP/106 cells for WT hMC3R.
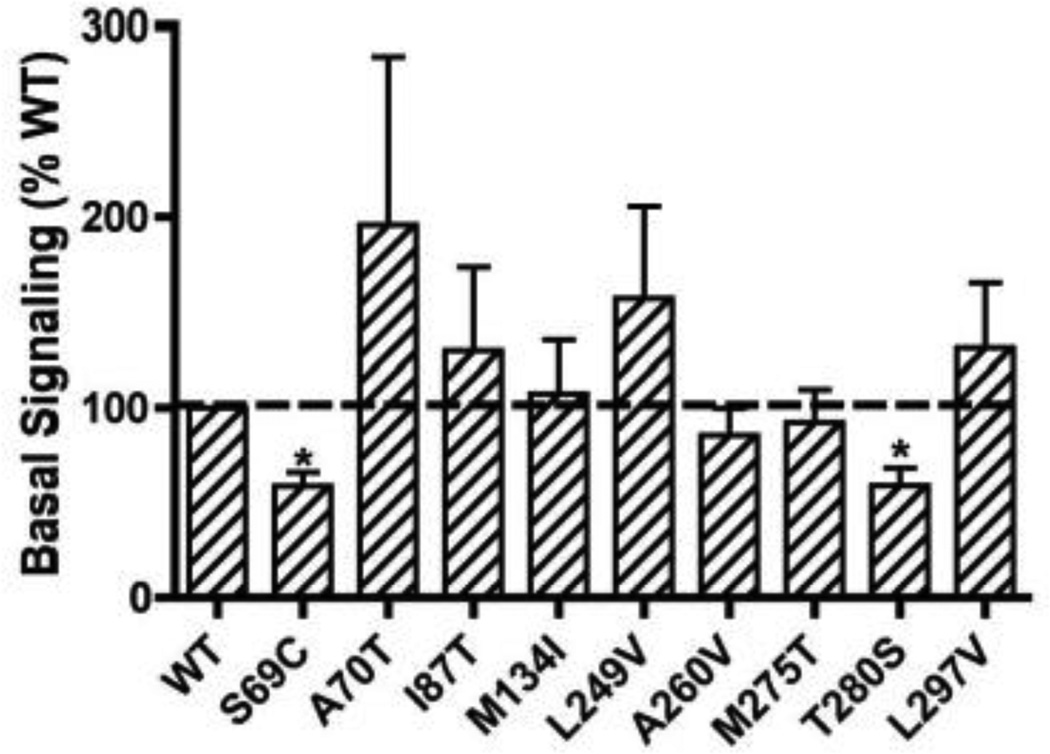
Unlike the human MC4R, which has significant constitutive activity that can easily be measured, the WT hMC3R has little constitutive activity [39]. The basal cAMP levels in cells transfected with WT hMC3R were similar to the basal cAMP levels in cells transfected with empty vector pcDNA3 [39]. In the current study, none of the mutants had increased basal activity compared to WT hMC3R (Fig. 5). S69C and T280S had small but statistically significant decreases in basal activities (Fig. 5).
Figure 5.
Basal activities of the WT and mutant hMC3Rs. The results are expressed as % of WT basal signaling. Shown are mean ± SEM of 5–8 experiments. The basal cAMP levels in HEK293T cells expressing WT hMC3R were 9.68 ± 1.47 pmol/106 cells (mean ± SEM). Star (*) indicates significantly different from WT hMC3R.
3.2. Ligand binding of the mutant hMC3Rs
To investigate whether the mutants had normal binding activity, competitive ligand binding assays were performed. The three ligands used above were used as the competitors. When NDP-MSH was used as ligand (Fig. 2B), S69C and T280S showed significantly decreased IC50s (Table 1). All the other mutants had similar IC50s as the WT hMC3R. When d-Trp8-γ-MSH was used as the competitor (Fig. 3B), only T280S showed significantly reduced IC50 (Table 2) whereas the other mutants had similar IC50s as the WT hMC3R. When α-MSH was used as the competitor (Fig. 4B), three mutants (S69C, I87T and T280S) had significantly decreased IC50s whereas the other mutants had similar IC50s as the WT hMC3R (Table 3).
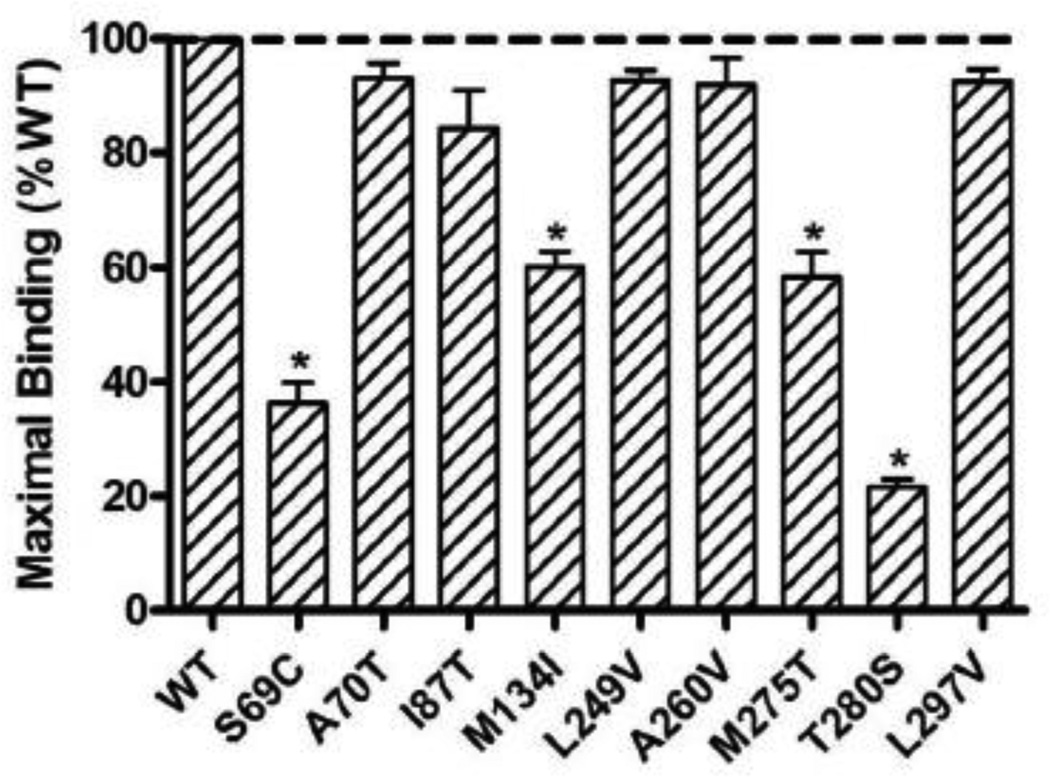
As shown in Fig. 6, four mutants (S69C, M134I, M275T and T280S) showed significantly reduced maximal binding. All the other mutants had relatively normal maximal binding.
Figure 6.
Maximal binding of the WT and mutant hMC3Rs. The results are expressed as % of WT maximal binding. Shown are mean ± SEM of all the binding experiments. Star (*) indicates significantly different from WT hMC3R.
3.3. Localization studies of mutant hMC3Rs by confocal microscopy
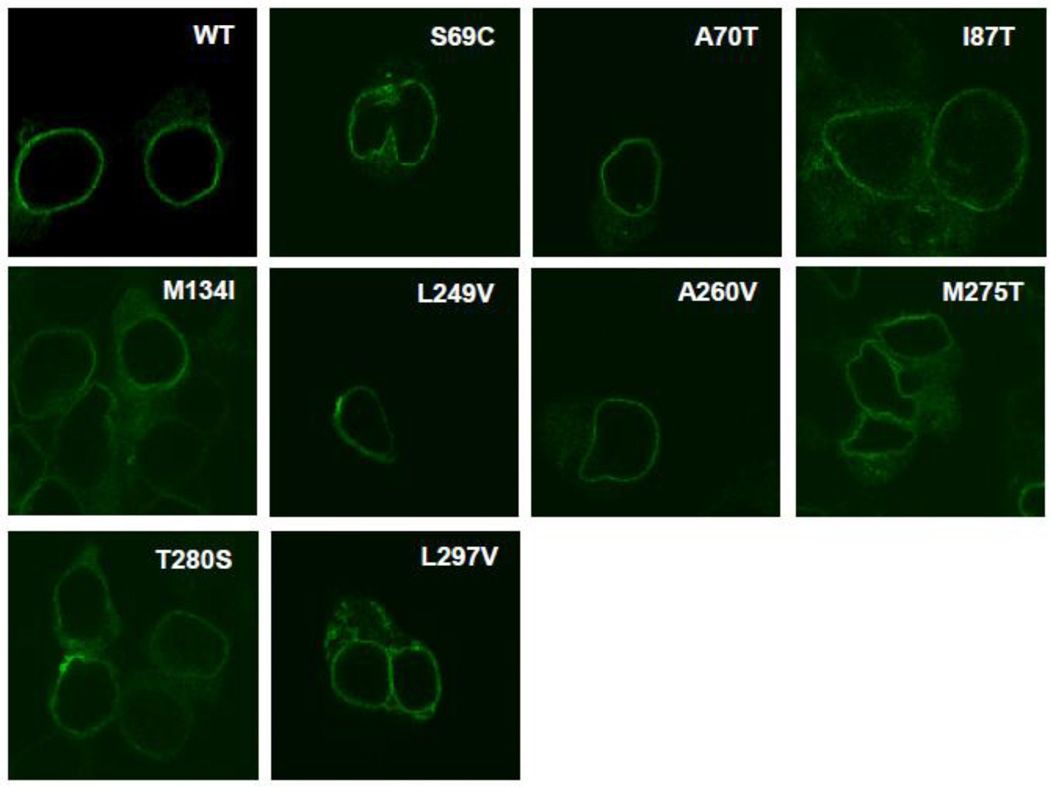
To investigate the localization of these mutants, especially the mutants that displayed functional defects, confocal microscopy was performed. The Alexa-Fluor labeled HA antibody, which selectively binds to the three-tandem HA epitope tags at the N-terminus of hMC3R, revealed the localization of hMC3R. As shown in Fig. 7, every mutant was expressed at the cell surface, including the mutants that had significant defects in ligand binding and signaling properties, such as S69C and T280S.
Figure 7.
Confocal imaging of cell surface expression of WT and mutant hMC3Rs. The WT or mutant 3HA-MC3Rs stably expressed in HEK293 cells were stained with Alexa Flour-conjugated anti-HA monoclonal antibody and imaged by confocal microscopy. This experiment was done twice with similar results.
3.4. Quantification of mutant hMC3R expression by flow cytometry
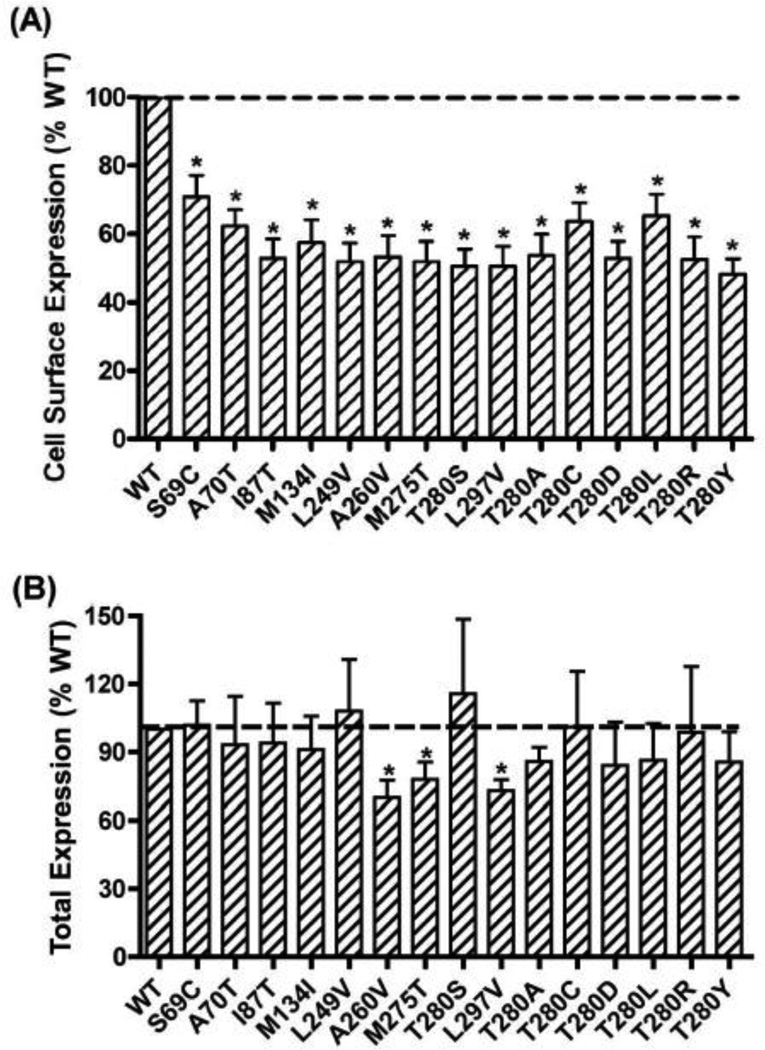
To quantitate mutant hMC3R expression, flow cytometry was performed. The data in non-permeabilized cells showed that all nine mutants had significantly decreased cell surface expression compared to WT hMC3R (Fig. 8A). As shown in Fig. 8B, the results in permeabilized cells showed that A260V, M275T, and L297V had small but statistically significant decreases in total expression levels. The other six mutants had similar total expression levels as that of WT hMC3R.
Figure 8.
Quantitative measurement of cell surface (A) or total (B) expression of WT and mutant hMC3Rs by flow cytometry. In (A), cell surface expression of the WT and mutant hMC3Rs were measured by flow cytometry. The results were expressed as % of WT cell surface expression levels after correction of the nonspecific staining in cells transiently transfected with the empty vector as described in Materials and Methods. Data were mean ± SEM of 8–9 experiments. Star (*) indicates significantly different from WT hMC3R. In (B), total expression of the WT and mutant hMC3R were measured by flow cytometry. The results were expressed as % of WT total expression levels after correction of the nonspecific staining in cells transiently transfected with the empty vector as described in Materials and Methods. Data were mean ± SEM of 6–7 experiments. Star (*) indicates significantly different from WT hMC3R.
3.5. Co-expression studies of hMC3R mutations
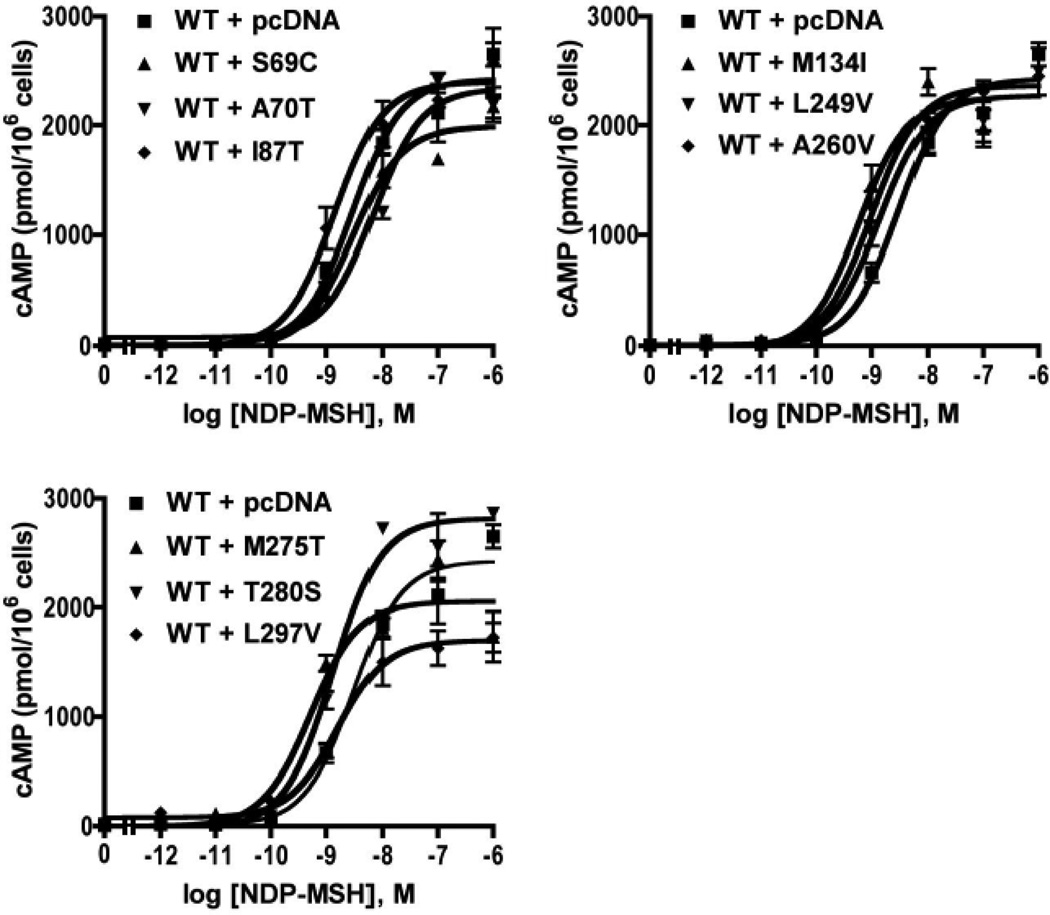
To investigate whether the mutant hMC3Rs had any dominant negative activity on WT hMC3R signaling, co-expression experiments were performed. WT and empty vector or mutant hMC3Rs were co-transfected into HEK293T cells with the ratio of 1:1. As shown in Fig. 9, L297V exhibited slight inhibition on WT hMC3R signaling. All the other mutants had no dominant negative activity on WT hMC3R signaling (Fig. 9 and Table 4).
Figure 9.
Accumulation of intracellular cAMP in cells expressing WT and/or mutant hMC3Rs. HEK293T cells were transiently transfected with the indicated MC3R constructs, and intracellular cAMP levels were measured by RIA. The same amount of WT hMC3R plasmid was present in all groups. Empty vector was added to keep plasmid concentrations constant among the different groups. Results are expressed as the mean ± SEM of triplicate determinations within one experiment. All experiments were performed at least three times.
Table 4.
NDP-MSH-stimulated signaling in cells co-transfected with WT and/or mutant hMC3Rs.
| hMC3R | n | NDP-MSH-stimulated cAMP | |
|---|---|---|---|
| EC50 (nM) | Rmax (% WT) | ||
| WT + pcDNA | 5 | 1.67±0.41 | 100.00 |
| WT + S69C | 3 | 1.66±0.71 | 94.05±6.76 |
| WT + A70T | 3 | 3.13±1.96 | 121.06±34.59 |
| WT + I87T | 3 | 1.41±0.47 | 95.62±13.69 |
| WT + M134I | 3 | 0.55±0.14 | 80.74±6.23 |
| WT + L249V | 3 | 1.04±0.18 | 86.39±8.48 |
| WT + A260V | 3 | 1.42±0.31 | 85.63±9.52 |
| WT + M275T | 3 | 0.48±0.09 | 92.66±17.08 |
| WT + T280S | 4 | 1. 50±0.23 | 81.20±22.68 |
| WT+ L297V | 3 | 0.90±0.35 | 78.89±2.32a |
Significantly different from WT hMC3R + pcDNA, p < 0.05.
The data are expressed as the mean ± SEM for the mutant hMC3Rs. The maximal responses (Rmax) were 2452.40 ±308.11 pmol cAMP/106 cells for WT hMC3R + pcDNA.
3.6. Multiple mutagenesis of T280
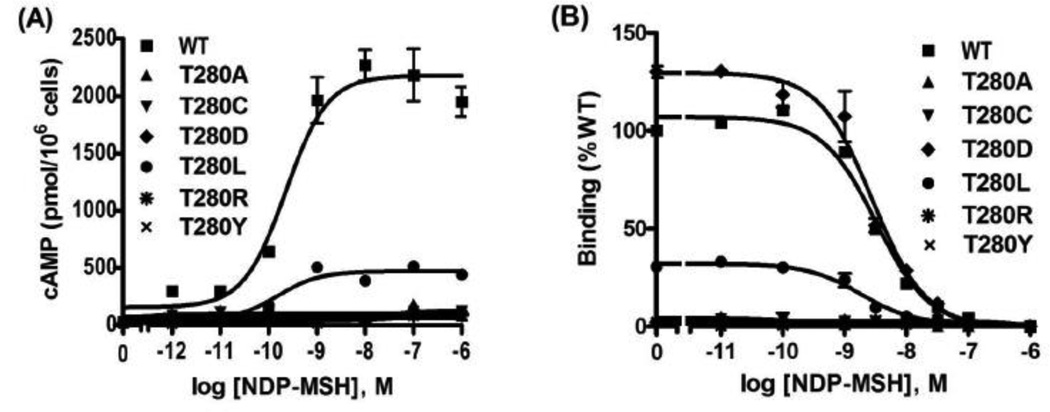
Although retaining some binding activity, T280S was almost devoid of signaling, which attracted our attention. The only difference between threonine and serine is that threonine has an extra methyl group. To further investigate the importance of T280 in hMC3R, multiple mutations were generated, changing T280 to hydrophobic (Ala, Leu and Tyr), polar (Cys), negatively charged (Asp), or positively charged (Arg) residues. The ligand binding and signaling properties of these mutants were measured using NDP-MSH as the ligand (Fig. 10 and Table 5). The results showed that no ligand binding could be detected for T280A, T280C, T280R and T280Y. The maximal binding for T280L was significantly decreased, whereas T280D had similar maximal binding as the WT hMC3R. T280D and T280L had similar IC50 to that of WT hMC3R. Signaling experiments showed that T280A, T280C, T280D, T280R, and T280Y had no response to NDP-MSH stimulation. T280L had similar EC50 as WT hMC3R, but the maximal signaling was significantly decreased (Fig. 10 and Table 5).
Figure 10.
Multiple mutagenesis of T280. T280 was mutated to Ala, Cys, Leu, Asp, Arg, and Tyr. The signaling (A) and ligand binding (B) properties of these mutants were measured using NDP-MSH as the ligand.
Table 5.
Binding and signaling properties of multiple mutations at T280 with NDP-MSH as the ligand.
| hMC3R | n | NDP-MSH binding | n | NDP-MSH-stimulated cAMP | ||
|---|---|---|---|---|---|---|
| IC50 (nM) | Bmax (% WT) | EC50 (nM) | Rmax (% WT) | |||
| WT | 3 | 4.56±2.24 | 100.00 | 3 | 0.63±0.41 | 100.00 |
| T280A | 3 | ND | ND | 3 | ND | ND |
| T280C | 3 | ND | ND | 3 | ND | ND |
| T280D | 3 | 3.91±1.68 | 115.97±10.06 | 3 | ND | ND |
| T280L | 3 | 4.06±2.26 | 37.78±8.48a | 3 | 1.47±1.18 | 26.35±3.15b |
| T280R | 3 | ND | ND | 3 | ND | ND |
| T280Y | 3 | ND | ND | 3 | ND | ND |
Significantly different from the WT hMC3R, p < 0.05.
Significantly different from the WT hMC3R, p < 0.01.
ND, could not be determined.
The data are expressed as the mean ± SEM for the mutant hMC3Rs. The maximal responses (Rmax) were 3220.33 ±720.98 pmol cAMP/106 cells for WT hMC3R.
The results of flow cytometry showed that in non-permeabilized cells, all mutants were expressed at the cell surface, but at significantly lower levels compared to the WT hMC3R (Fig. 8A). In permeabilized cells, all mutants had similar total expression levels as the WT hMC3R (Fig. 8B).
4. Discussion
In this study, we performed detailed functional analysis of nine naturally occurring MC3R mutations that have not been studied in detail before. Among these nine mutations, S69C was identified in a lean person, and the other mutations were found in obese patients [24, 26, 30]. All mutants had decreased cell surface expression. Six mutants had normal total protein expression. A260V, M275T, and L297V had small, although statistically significant, decreases in total protein expression. Four mutants (S69C, M134I, M275T and T280S) had significantly decreased maximal binding and two mutants (S69C and T280S) had significant defects in signaling.
To investigate whether the mutant hMC3Rs were mislocalized, we performed confocal microscopy and flow cytometry. Confocal microscopy in non-permeabilized cells showed that all mutants were expressed on the cell surface (Fig. 7) but flow cytometry showed that cell surface expression levels were significantly decreased to about 50~75% of WT hMC3R (Fig. 8A). Flow cytometry in permeabilized cells showed that six mutants had normal total protein expression levels whereas A260V, M275T, and L297V had small, although statistically significant, decreases in total protein expression levels (Fig. 8B). These results suggest that six mutants, including S69C, A70T, I87T, M134I, L249V, and T280S, were retained intracellularly due to misfolding. The majority of GPCR mutations causing human diseases belong to this class [40] and intracellular retention comprises the majority of MC4R mutations causing obesity [41].
A260V, M275T, and L297V had small decreases in total protein expression levels (Fig. 8B). Premature termination and frameshift mutations are predicted to cause decreased protein levels, partly due to nonsense-mediated mRNA decay [40]. However, only a few examples were reported for missense mutations that result in decreased total protein expression. A naturally occurring synonymous mutation of human dopamine D2 receptor was reported to markedly change mRNA stability through changing mRNA secondary structure and therefore caused decreased protein expression [42]. Whether similar mechanism accounts for the decreased total expression for the three hMC3R mutations in the present study remains to be studied. We reported recently that several missense mutations in the MC4R gene also cause decreased total expression levels [35, 36]. It should be emphasized that total expression levels were not measured in many of the functional studies on naturally occurring mutations in GPCRs that cause human diseases.
Mutant T280S exhibited dramatic functional defects in both binding and ligand-stimulated intracellular cAMP generation (Figs. 2–6 and Tables 1–3). T280S also had significantly reduced cell surface expression (Figs. 7 and 8). The functional defects of T280S might be due to, at least partially, the decrease in cell surface expression. Comparing binding and signaling data suggested that it was also defective in signaling per se. T2806.36 sits deeply in the transmembrane domain 6 (TM6), near the intracellular surface (6.36 is a nomenclature system illustrating the position of a residue in TM, [43]). TM6 plays an important role in GPCR signaling mechanism [44]. Therefore, we generated additional mutations at codon 280 changing Thr to different classes of amino acids and performed detailed functional analysis (Fig. 10). The results showed that all these mutants were expressed at the cell surface but had significantly decreased cell surface expression levels (Fig. 8A), although the total expression levels were normal (Fig. 8B). No binding or signaling could be detected for T280A, T280C, T280R and T280Y. Therefore these mutants were defective in ligand binding. T280D was a signaling defective mutant with normal ligand binding. T280L displayed similar EC50 and IC50 as WT hMC3R, but had significantly decreased maximal binding and signaling (Fig. 10 and Table 5). We suggested that for T280L, due to decreased cell surface expression, maximal binding and signaling were decreased. Our data demonstrated the importance of T280 in different aspects of hMC3R functions including receptor expression, ligand binding and signaling. Changing Thr to Ser that has similar structure as Thr caused significant functional defects; however, mutating the polar Thr to the negatively charged Asp or hydrophobic nonpolar Leu maintained partial receptor function. These results demonstrated that it is not reliable to predict the functional ramification of mutations simply based on their amino acid characteristics. Instead detailed functional studies are necessary.
Mutants M134I and M275T had decreased maximal ligand binding (Fig. 6), consistent with their reduced cell surface expression. But they had normal signaling (Table 1–3), suggesting the presence of spare receptor [41]. A70T and M134I were identified in two unrelated Asian children and their obese mothers. Both mother and child carrying M134I had type 2 diabetes [24] indicating that decreased cell surface expression might cause decreased signaling in vivo.
Previously, functional studies were reported for several naturally occurring MC3R mutations. For I183N, first reported in 2002 [22], three studies showed that the mutation causes a total loss of signaling [24, 45, 46]. Three mutations, A293T, I335S, and X361S, were identified from an Italian cohort [25]. Two groups independently showed that I335S is a loss of function mutation, whereas no significant defect could be identified for A293T and X361S [25, 39]. Recent genetic studies in Europe reported new MC3R mutations in obese patients causing dramatic functional defects [27, 28]. Of the three mutations identified from an obese cohort in Belgium (N128S, V211I, and L299V), functional studies showed that L299V has impaired function due to decreased cell surface expression resulting in defective signaling, whereas although N128S and V211I are expressed on the cell surface, N128S has increased EC50 and V211I has decreased maximal response in response to α-MSH stimulation [28]. Another study showed that the prevalence of functionally relevant mutations is significantly higher in the obese group in Italian and French cohorts [27].
Because the mutations were identified in heterozygous state, we performed co-transfection experiments to investigate whether the mutant receptor had dominant negative effect on the WT receptor signaling. Our data showed that most of the mutants have no dominant negative effect (Fig. 9 and Table 4). Only L297V had small, although significant, effect on WT hMC3R signaling (Fig. 9 and Table 4). These data were consistent with previous studies demonstrating lack of dominant negative effect on the other MC3R mutations [39, 45], similar to the MC4R mutations [47, 48]. It has been reported that MC3R homodimerize [49] and dimerization is considered to be responsible for dominant negative activity exerted by some mutant GPCRs [50] including MC4R [49, 51]. Whether the mutant receptors studied herein can heterodimerize with the WT receptor remains to be investigated.
In the related MC4R, more than 150 distinct mutations have been reported and mutations in the MC4R are widely accepted to be the most common monogenic form of obesity and an important contributor to polygenic obesity (reviewed in [21]). Genetic, clinical, and pharmacological data from numerous studies were supportive of this hypothesis. However, relatively few mutations in the MC3R have been identified in humans and their relevance in obesity pathogenesis is still hotly debated (reviewed in [29]). At least twenty-four mutations in the MC3R have been identified in humans. In a recent editorial, we suggested that because of the phenotype of Mc3r knockout mice (increased fat mass with normal body weight), human genetic studies on the MC3R mutation and disorders in energy balance should pay special attention to the body fat (adiposity) instead of simple body weight (for example, using body mass index) [29], the so-called “deep phenotyping” [52]. Large-scale molecular genetic studies (quantitatively or case-control, population-based or extreme groups), with thorough phenotyping, combined with detailed functional studies as presented in this manuscript, will likely help to clarify the potential pathogenic role of MC3R mutation in human energy balance disorder [29].
In summary, we obtained detailed functional data of nine naturally occurring MC3R mutations. We demonstrated that T280S might be a possible pathogenic cause for human obesity and T280 played an important role in MC3R expression, binding and signaling, contributing to a better understanding of structure-function relationship of MC3R. Whether and how the mutants that did not affect signaling are related to human adiposity remains to be further studied, preferably vetted in vivo. Their decreased cell surface expression likely will have physiological consequence. The accumulating literature supports the hypothesis that MC3R mutations are associated with human obesity or adiposity, predisposing the carrier to obesity in the current obesogenic environment. This predisposition is most likely due to haploinsufficiency rather than dominant negative activity.
Highlights.
MC3R mutations predispose humans to obesity.
T280 is important for cell surface expression, ligand binding, and signaling.
Decreased total protein expression is common among missense MC3R mutations.
Acknowledgements
This study was supported by grants from the National Institute of Health (R15DK077213) and Animal Health and Diseases Research Program as well as Interdisciplinary Grant from Auburn University College of Veterinary Medicine. Fan Yang was supported by a fellowship from China Scholarship Council of the People’s Republic of China. We thank Ms Hui Huang for help in flow cytometry experiments, and Dr. Robert C. Speth for providing the iodinated NDP-MSH at low cost. We also appreciate the Flow Cytometry Core Facility at Auburn University College of Veterinary Medicine (Dr. R. C. Bird, director) for their assistance.
Abbreviations
- GPCR
G protein-coupled receptor
- hMC3R
human melanocortin-3 receptor
- MC4R
melanocortin-4 receptor
- MSH
melanocyte stimulating hormone
- POMC
proopiomelanocortin
- WT
wild-type
Footnotes
Publisher's Disclaimer: This is a PDF file of an unedited manuscript that has been accepted for publication. As a service to our customers we are providing this early version of the manuscript. The manuscript will undergo copyediting, typesetting, and review of the resulting proof before it is published in its final citable form. Please note that during the production process errors may be discovered which could affect the content, and all legal disclaimers that apply to the journal pertain.
Disclosure
None.
References
- 1.Spiegelman BM, Flier JS. Obesity and the regulation of energy balance. Cell. 2001;104:531–543. doi: 10.1016/s0092-8674(01)00240-9. [DOI] [PubMed] [Google Scholar]
- 2.Clement K, Vaisse C, Lahlou N, Cabrol S, Pelloux V, Cassuto D, Gourmelen M, Dina C, Chambaz J, Lacorte JM, Basdevant A, Bougneres P, Lebouc Y, Froguel P, Guy-Grand B. A mutation in the human leptin receptor gene causes obesity and pituitary dysfunction. Nature. 1998;392:398–401. doi: 10.1038/32911. [DOI] [PubMed] [Google Scholar]
- 3.Krude H, Biebermann H, Luck W, Horn R, Brabant G, Gruters A. Severe early-onset obesity, adrenal insufficiency and red hair pigmentation caused by POMC mutations in humans. Nat Genet. 1998;19:155–157. doi: 10.1038/509. [DOI] [PubMed] [Google Scholar]
- 4.Farooqi IS, Keogh JM, Yeo GS, Lank EJ, Cheetham T, O'Rahilly S. Clinical spectrum of obesity and mutations in the melanocortin 4 receptor gene. N Engl J Med. 2003;348:1085–1095. doi: 10.1056/NEJMoa022050. [DOI] [PubMed] [Google Scholar]
- 5.Hinney A, Vogel CI, Hebebrand J. From monogenic to polygenic obesity: recent advances. European child & adolescent psychiatry. 2010;19:297–310. doi: 10.1007/s00787-010-0096-6. [DOI] [PMC free article] [PubMed] [Google Scholar]
- 6.Chen AS, Marsh DJ, Trumbauer ME, Frazier EG, Guan XM, Yu H, Rosenblum CI, Vongs A, Feng Y, Cao L, Metzger JM, Strack AM, Camacho RE, Mellin TN, Nunes CN, Min W, Fisher J, Gopal-Truter S, MacIntyre DE, Chen HY, Van der Ploeg LH. Inactivation of the mouse melanocortin-3 receptor results in increased fat mass and reduced lean body mass. Nat Genet. 2000;26:97–102. doi: 10.1038/79254. [DOI] [PubMed] [Google Scholar]
- 7.Butler AA, Kesterson RA, Khong K, Cullen MJ, Pelleymounter MA, Dekoning J, Baetscher M, Cone RD. A unique metabolic syndrome causes obesity in the melanocortin-3 receptor-deficient mouse. Endocrinology. 2000;141:3518–3521. doi: 10.1210/endo.141.9.7791. [DOI] [PubMed] [Google Scholar]
- 8.Zhang Y, Kilroy GE, Henagan TM, Prpic-Uhing V, Richards WG, Bannon AW, Mynatt RL, Gettys TW. Targeted deletion of melanocortin receptor subtypes 3 and 4, but not CART, alters nutrient partitioning and compromises behavioral and metabolic responses to leptin. FASEB J. 2005;19:1482–1491. doi: 10.1096/fj.05-3851com. [DOI] [PubMed] [Google Scholar]
- 9.Gantz I, Konda Y, Tashiro T, Shimoto Y, Miwa H, Munzert G, Watson SJ, DelValle J, Yamada T. Molecular cloning of a novel melanocortin receptor. J Biol Chem. 1993;268:8246–8250. [PubMed] [Google Scholar]
- 10.Roselli-Rehfuss L, Mountjoy KG, Robbins LS, Mortrud MT, Low MJ, Tatro JB, Entwistle ML, Simerly RB, Cone RD. Identification of a receptor for γ melanotropin and other proopiomelanocortin peptides in the hypothalamus and limbic system. Proc Natl Acad Sci U S A. 1993;90:8856–8860. doi: 10.1073/pnas.90.19.8856. [DOI] [PMC free article] [PubMed] [Google Scholar]
- 11.Gantz I, Fong TM. The melanocortin system. Am J Physiol. 2003;284:E468–E474. doi: 10.1152/ajpendo.00434.2002. [DOI] [PubMed] [Google Scholar]
- 12.Ellacott KL, Cone RD. The role of the central melanocortin system in the regulation of food intake and energy homeostasis: lessons from mouse models. Philosophical transactions of the Royal Society of London. Series B, Biological sciences. 2006;361:1265–1274. doi: 10.1098/rstb.2006.1861. [DOI] [PMC free article] [PubMed] [Google Scholar]
- 13.Tao YX, Huang H, Wang ZQ, Yang F, Williams JN, Nikiforovich GV. Constitutive activity of neural melanocortin receptors. Methods Enzymol. 2010;484:267–279. doi: 10.1016/B978-0-12-381298-8.00014-9. [DOI] [PubMed] [Google Scholar]
- 14.Humphreys MH. γ-MSH, sodium metabolism, and salt-sensitive hypertension. Am J Physiol. 2004;286:R417–R430. doi: 10.1152/ajpregu.00365.2003. [DOI] [PubMed] [Google Scholar]
- 15.Getting SJ, Riffo-Vasquez Y, Pitchford S, Kaneva M, Grieco P, Page CP, Perretti M, Spina D. A role for MC3R in modulating lung inflammation. Pulm Pharmacol Ther. 2008;21:866–873. doi: 10.1016/j.pupt.2008.09.004. [DOI] [PubMed] [Google Scholar]
- 16.Jegou S, Boutelet I, Vaudry H. Melanocortin-3 receptor mRNA expression in pro-opiomelanocortin neurones of the rat arcuate nucleus. J Neuroendocrinol. 2000;12:501–505. doi: 10.1046/j.1365-2826.2000.00477.x. [DOI] [PubMed] [Google Scholar]
- 17.Cone RD. The central melanocortin system and energy homeostasis. Trends Endocrinol Metab. 1999;10:211–216. doi: 10.1016/s1043-2760(99)00153-8. [DOI] [PubMed] [Google Scholar]
- 18.Marks DL, Hruby V, Brookhart G, Cone RD. The regulation of food intake by selective stimulation of the type 3 melanocortin receptor (MC3R) Peptides. 2006;27:259–264. doi: 10.1016/j.peptides.2005.01.025. [DOI] [PMC free article] [PubMed] [Google Scholar]
- 19.Sutton GM, Perez-Tilve D, Nogueiras R, Fang J, Kim JK, Cone RD, Gimble JM, Tschop MH, Butler AA. The melanocortin-3 receptor is required for entrainment to meal intake. J Neurosci. 2008;28:12946–12955. doi: 10.1523/JNEUROSCI.3615-08.2008. [DOI] [PMC free article] [PubMed] [Google Scholar]
- 20.Sutton GM, Begriche K, Kumar KG, Gimble JM, Perez-Tilve D, Nogueiras R, McMillan RP, Hulver MW, Tschop MH, Butler AA. Central nervous system melanocortin-3 receptors are required for synchronizing metabolism during entrainment to restricted feeding during the light cycle. FASEB J. 2010;24:862–872. doi: 10.1096/fj.09-142000. [DOI] [PMC free article] [PubMed] [Google Scholar]
- 21.Tao YX. The melanocortin-4 receptor: Physiology, pharmacology, and pathophysiology. Endocr Rev. 2010;31:506–543. doi: 10.1210/er.2009-0037. [DOI] [PMC free article] [PubMed] [Google Scholar]
- 22.Lee YS, Poh LK, Loke KY. A novel melanocortin 3 receptor gene (MC3R) mutation associated with severe obesity. J Clin Endocrinol Metab. 2002;87:1423–1426. doi: 10.1210/jcem.87.3.8461. [DOI] [PubMed] [Google Scholar]
- 23.Feng N, Young SF, Aguilera G, Puricelli E, Adler-Wailes DC, Sebring NG, Yanovski JA. Co-occurrence of two partially inactivating polymorphisms of MC3R is associated with pediatric-onset obesity. Diabetes. 2005;54:2663–2667. doi: 10.2337/diabetes.54.9.2663. [DOI] [PMC free article] [PubMed] [Google Scholar]
- 24.Lee YS, Poh LK, Kek BL, Loke KY. The role of melanocortin 3 receptor gene in childhood obesity. Diabetes. 2007;56:2622–2630. doi: 10.2337/db07-0225. [DOI] [PubMed] [Google Scholar]
- 25.Mencarelli M, Walker GE, Maestrini S, Alberti L, Verti B, Brunani A, Petroni ML, Tagliaferri M, Liuzzi A, Di Blasio AM. Sporadic mutations in melanocortin receptor 3 in morbid obese individuals. Eur J Hum Genet. 2008;16:581–586. doi: 10.1038/sj.ejhg.5202005. [DOI] [PubMed] [Google Scholar]
- 26.Calton MA, Ersoy BA, Zhang S, Kane JP, Malloy MJ, Pullinger CR, Bromberg Y, Pennacchio LA, Dent R, McPherson R, Ahituv N, Vaisse C. Association of functionally significant Melanocortin-4 but not Melanocortin-3 receptor mutations with severe adult obesity in a large North American case-control study. Hum Mol Genet. 2009;18:1140–1147. doi: 10.1093/hmg/ddn431. [DOI] [PMC free article] [PubMed] [Google Scholar]
- 27.Mencarelli M, Dubern B, Alili R, Maestrini S, Benajiba L, Tagliaferri M, Galan P, Rinaldi M, Simon C, Tounian P, Hercberg S, Liuzzi A, Di Blasio AM, Clement K. Rare melanocortin-3 receptor mutations with in vitro functional consequences are associated with human obesity. Hum Mol Genet. 2011;20:392–399. doi: 10.1093/hmg/ddq472. [DOI] [PubMed] [Google Scholar]
- 28.Zegers D, Beckers S, de Freitas F, Peeters AV, Mertens IL, Verhulst SL, Rooman RP, Timmermans JP, Desager KN, Massa G, Van Gaal LF, Van Hul W. Identification of three novel genetic variants in the melanocortin-3 receptor of obese children. Obesity (Silver Spring) 2011;19:152–159. doi: 10.1038/oby.2010.127. [DOI] [PubMed] [Google Scholar]
- 29.Tao YX. Mutations in the melanocortin-3 receptor (MC3R) gene: Impact on human obesity or adiposity. Curr Opin Investig Drugs. 2010;11:1092–1096. [PubMed] [Google Scholar]
- 30.Valli-Jaakola K. PhD dissertation. Helsinki, Finland: Department of Medicine, University of Helsinki; 2007. Molecular genetic studies of melanocortin receptors in morbid obesity; p. 68. [Google Scholar]
- 31.Chen C, Okayama H. High-efficiency transformation of mammalian cells by plasmid DNA. Mol Cell Biol. 1987;7:2745–2752. doi: 10.1128/mcb.7.8.2745. [DOI] [PMC free article] [PubMed] [Google Scholar]
- 32.Fan ZC, Sartin JL, Tao YX. Molecular cloning and pharmacological characterization of porcine melanocortin-3 receptor. J Endocrinol. 2008;196:139–148. doi: 10.1677/JOE-07-0403. [DOI] [PubMed] [Google Scholar]
- 33.Tao YX, Segaloff DL. Functional characterization of melanocortin-4 receptor mutations associated with childhood obesity. Endocrinology. 2003;144:4544–4551. doi: 10.1210/en.2003-0524. [DOI] [PubMed] [Google Scholar]
- 34.Wang SX, Fan ZC, Tao YX. Functions of acidic transmembrane residues in human melanocortin-3 receptor binding and activation. Biochem Pharmacol. 2008;76:520–530. doi: 10.1016/j.bcp.2008.05.026. [DOI] [PMC free article] [PubMed] [Google Scholar]
- 35.Fan ZC, Tao YX. Functional characterization and pharmacological rescue of melanocortin-4 receptor mutations identified from obese patients. J Cell Mol Med. 2009;13:3268–3282. doi: 10.1111/j.1582-4934.2009.00726.x. [DOI] [PMC free article] [PubMed] [Google Scholar]
- 36.Wang ZQ, Tao YX. Functional studies on twenty novel naturally occurring melanocortin-4 receptor mutations. Biochim Biophys Acta. 2011;1812:1190–1199. doi: 10.1016/j.bbadis.2011.06.008. [DOI] [PMC free article] [PubMed] [Google Scholar]
- 37.Sawyer TK, Sanfilippo PJ, Hruby VJ, Engel MH, Heward CB, Burnett JB, Hadley ME. 4-Norleucine, 7-D-phenylalanine-α-melanocyte-stimulating hormone: a highly potent α-melanotropin with ultralong biological activity. Proc Natl Acad Sci U S A. 1980;77:5754–5758. doi: 10.1073/pnas.77.10.5754. [DOI] [PMC free article] [PubMed] [Google Scholar]
- 38.Grieco P, Balse PM, Weinberg D, MacNeil T, Hruby VJ. D-Amino acid scan of γ-melanocyte-stimulating hormone: importance of Trp8 on human MC3 receptor selectivity. J Med Chem. 2000;43:4998–5002. doi: 10.1021/jm000211e. [DOI] [PubMed] [Google Scholar]
- 39.Tao YX. Functional characterization of novel melanocortin-3 receptor mutations identified from obese subjects. Biochim Biophys Acta. 2007;1772:1167–1174. doi: 10.1016/j.bbadis.2007.09.002. [DOI] [PubMed] [Google Scholar]
- 40.Tao YX. Inactivating mutations of G protein-coupled receptors and diseases: Structure-function insights and therapeutic implications. Pharmacol Ther. 2006;111:949–973. doi: 10.1016/j.pharmthera.2006.02.008. [DOI] [PubMed] [Google Scholar]
- 41.Tao YX. Molecular mechanisms of the neural melanocortin receptor dysfunction in severe early onset obesity. Mol Cell Endocrinol. 2005;239:1–14. doi: 10.1016/j.mce.2005.04.012. [DOI] [PubMed] [Google Scholar]
- 42.Duan J, Wainwright MS, Comeron JM, Saitou N, Sanders AR, Gelernter J, Gejman PV. Synonymous mutations in the human dopamine receptor D2 (DRD2) affect mRNA stability and synthesis of the receptor. Hum Mol Genet. 2003;12:205–216. doi: 10.1093/hmg/ddg055. [DOI] [PubMed] [Google Scholar]
- 43.Ballesteros JA, Weinstein H. Integrated methods for the construction of three-dimensional models and computational probing of structure-function relations in G protein-coupled receptors. Methods Neurosci. 1995;25:366–428. [Google Scholar]
- 44.Millar RP, Newton CL. The year in G protein-coupled receptor research. Mol Endocrinol. 2010;24:261–274. doi: 10.1210/me.2009-0473. [DOI] [PMC free article] [PubMed] [Google Scholar]
- 45.Tao YX, Segaloff DL. Functional characterization of melanocortin-3 receptor variants identify a loss-of-function mutation involving an amino acid critical for G protein-coupled receptor activation. J Clin Endocrinol Metab. 2004;89:3936–3942. doi: 10.1210/jc.2004-0367. [DOI] [PubMed] [Google Scholar]
- 46.Rached M, Buronfosse A, Begeot M, Penhoat A. Inactivation and intracellular retention of the human I183N mutated melanocortin 3 receptor associated with obesity. Biochim Biophys Acta. 2004;1689:229–234. doi: 10.1016/j.bbadis.2004.03.009. [DOI] [PubMed] [Google Scholar]
- 47.Cone RD. Haploinsufficiency of the melanocortin-4 receptor: part of a thrifty genotype? J Clin Invest. 2000;106:185–187. doi: 10.1172/JCI10628. [DOI] [PMC free article] [PubMed] [Google Scholar]
- 48.Roth CL, Ludwig M, Woelfle J, Fan ZC, Brumm H, Biebermann H, Tao YX. A novel melanocortin-4 receptor gene mutation in a female patient with severe childhood obesity. Endocrine. 2009;36:52–59. doi: 10.1007/s12020-009-9156-4. [DOI] [PubMed] [Google Scholar]
- 49.Mandrika I, Petrovska R, Wikberg J. Melanocortin receptors form constitutive homo- and heterodimers. Biochem Biophys Res Commun. 2005;326:349–354. doi: 10.1016/j.bbrc.2004.11.036. [DOI] [PubMed] [Google Scholar]
- 50.Tao YX, Johnson NB, Segaloff DL. Constitutive and agonist-dependent self-association of the cell surface human lutropin receptor. J Biol Chem. 2004;279:5904–5914. doi: 10.1074/jbc.M311162200. [DOI] [PubMed] [Google Scholar]
- 51.Biebermann H, Krude H, Elsner A, Chubanov V, Gudermann T, Gruters A. Autosomal-dominant mode of inheritance of a melanocortin-4 receptor mutation in a patient with severe early-onset obesity is due to a dominant-negative effect caused by receptor dimerization. Diabetes. 2003;52:2984–2988. doi: 10.2337/diabetes.52.12.2984. [DOI] [PubMed] [Google Scholar]
- 52.Muller MJ, Bosy-Westphal A, Krawczak M. Genetic studies of common types of obesity: a critique of the current use of phenotypes. Obes Rev. 2010;11:612–618. doi: 10.1111/j.1467-789X.2010.00734.x. [DOI] [PubMed] [Google Scholar]


