Abstract
Photoplethysmography is one of the optical techniques has been developed for experimental use in vascular disease. It has several advantages over other traditional experimental approaches. Because of its non-invasive, safe, costeffective and easy-to-use properties, it is considered as a useful diagnostic tool. The further developments in the Photoplethysmograph may replace it among other tools used in the assessment of vascular diseases such as blood test and ultrasound. This overview discusses the different terminologies used for the photoplethysmograph and reveals the research discontinuity among different disciplines. Moreover, it suggests standard terminologies as a resolution for a confusion persisted for more than 50 years.
Keywords: Plethysmogram, acceleration photoplethysmogram, second derivative photoplethysmogram, digital volume pulse, pulse wave, pulse oximeter.
INTRODUCTION
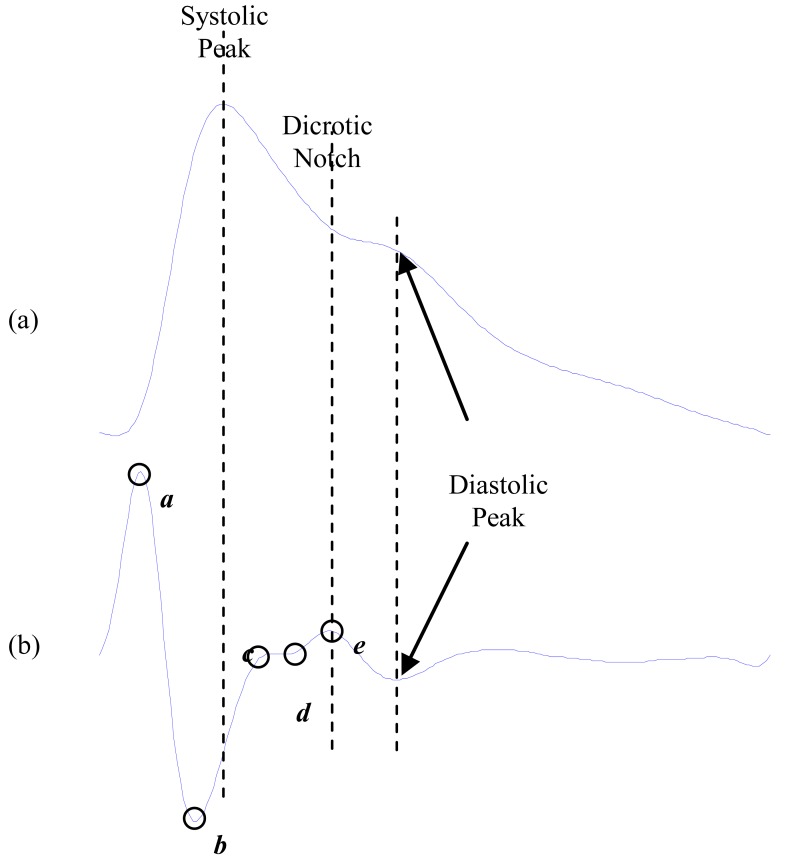
Photoplethysmography reflects the blood movement in the vessel, which goes from the heart to the fingertips through the blood vessels in a wave-like motion [1], as shown in Fig. (1a). It is an optical measurement technique uses an invisible infrared light send in the tissue and the amount of the backscattered light corresponds with the variation of the blood volume [2].
Fig. (1).
Signal Measurements [5] (a) fingertip photoplethysmogram (b) second derivative wave of photoplethysmogram. The photoplethysmogram waveform consists of one systolic wave and one diastolic wave while the second derivative photoplethysmogram waveform consists of four systolic waves (a, b, c, and d waves) and one diastolic wave (e wave).
The photoplethysmography (PPG), introduced by Hertzman in 1938 [3], is mainly reflects the blood volume changes in the finger arterioles. It has been recognized as non-invasive, simple, reliable, and cost-effective method of measuring arterial pulse waves in relation to changes in wave amplitude. Therefore, it is considered as a fast developing tool which easily can replace other traditional tools used in the vascular disease assessment such blood test, ultrasound, Doppler, Magnetic resonance angiography and computed tomography angioraphy. However, the wave contour itself has not been analyzed because of the difficulty in detecting minute changes in the phase of the inflections.
In 1978, Ozawa reported (in Japanese) [4] that the second derivative of the photoplethysmogram wave has characteristic contours (waves) that facilitated the interpretation of the original photoplethysmogram waves, as shown in Fig. (1b). Therefore, the second derivative of the photoplethysmogram was developed as a method allowing more accurate recognition of the inflection points and easier interpretation of the original plethysmogram wave.
The original photoplethysmogram wave form consists of two waves: systolic and diastolic waves, as shown Fig. (1a). The second derivative of the original photoplethysmogram waveform includes four systolic waves and one diastolic wave, namely a-wave (early systolic positive wave), b-wave (early systolic negative wave), c-wave (late systolic reincreasing wave), d-wave (late systolic redecreasing wave) and e-wave (early diastolic positive wave), as shown Fig. (1b).
Although the usage of photoplethysmography has been increasing in science and engineering during the past 50 years, there is still a lack of common terminologies for photoplethysmograph and its second derivative signals. This has caused substantial confusion and disagreement during discussions in literature and in interpretation of the large number of publications in both area science and engineering. This may waste the researcher’s efforts by generating redundant results and also may limit the scientific progress in this multidisciplinary field.
This overview discusses the different plethysmography terminologies and proposes common terminologies to resolve the difficulties and confusion between scientific communities.
METHODOLOGY
Photoplethysmogram
Some of the literature review to explain the different usage of different terminologies for photoplethysmogram:
Digital Velocity Pulse (DVP)
In 2002, Millasseau et al. [6] used the DVP terminology when they provided a simple, reproducible, non-invasive measure of large artery stiffness using the contour analysis of the DVP.
In 2006, Padilla et al. [7] used the DVP terminology when they suggested a useful relation among the stiffness index SIDVP = h / ΔTDVP obtainedobtained of simple form by DVP and the ankle-brachial pulse wave velocity (abPWV), as well as the values of sanguineous pressure, whereas abPWV = Lab / ΔT , and Lab measured distance between ankle-brachial location.
In 2007, Alty et al. [8] used the DVP terminology when they developed a method to accurately classify subjects into high and low PWV (equivalent to high and low CVD risk) using features extracted from their DVP waveform has been presented.
Plethysmogram (PTG)
In 1999, Mishima et al. [9] used the PTG terminology they found the increase in mean RR interval and the decrease in baseline deflection of the PTG strongly correlates of autogenic training.
In 2005, Yashima et al. [10] used the PTG terminology when they proposed a new stress evaluation technique using the photoplethysmogram (PTG) by applying Morlet wavelets.
In 2007, Kageyama et al. [11] used the PTG terminology when they performed wavelet analysis of the finger-tip photo-plethysmogram (PTG) in order to quantify the stress stage.
Photoplethysmogram (PPG)
In 2008, Abe et al. [12] used the PPG terminology when they proposed a method for evaluating effects of visually-induced motion sickness using ICA for Photoplethysmography (PPG).
In 2008, Cox et al. [13] used the PPG terminology when they proposed the use of photoplethysmogram (PPG) morphology as an indicator of hypovolemic states and its correlation with blood pressure.
In 2009, Gil et al. [14] used the PPG terminology when they analysed the heart rate variability (HRV) during decreases in the amplitude fluctuations of photopletysmography (PPG) events for obstructive sleep apnea syndrome screening.
Second Derivative Photoplethysmogram
Some of the literature review to explain the different usage of different terminologies for the second derivative plethysmogram:
Second Derivative Photoplethysmogram (SDPTG)
In 1998, Takazawa et al. [4] used the SDPTG terminology when they demonstrated that the b/a ratio reflects increased arterial stiffness, hence the b/a ratio increases with age. Moreover, they found the (b-c-d-e)/a ratio may be useful for evaluation of vascular aging and for screening of arteriosclerotic disease. The waves a, b, c, d, and e are demonstrated in Fig. (1b).
In 1998, Imanaga et al. [15] used the SDPTG terminology when they provided a direct evidence that magnitude of b/a of the APG is related to the distensibility of the peripheral artery, and suggest that magnitude of b/a is a useful non-invasive index of atherosclerosis and altered arterial distensibility.
In 2007, Baek et al. [16] used the SDPTG terminology when they confirmed that the b/a ratio and the aging index (SDPTG-AI) increased with age, and the c/a, d/a, and e/a ratios decreased with age. The informal aging index (b-e)/a has been suggested as a replacement for the known formula (b-c-d-e)/a.
In 2007, Kimura et al. [17] used the SDPTG terminology when they proposed a the efficacy of Kamishoyosan herb for patients with Premenstrual syndrome was quantitatively ascertained using the APG.
Acceleration Photoplethysmogram (APG)
In 1994, Katsuki et al. [18] used the APG terminology when they suggested that the present APG index is adequate about the individual reproducibility, and it has the possibility to apply as an index of arteriosclerosis.
In 1996, Takada et al. [19] used the APG terminology when they concluded that simply categorized wave patterns of APG could be a useful noninvasive tool to evaluate aging in cardiovascular system.
In 2000, Bortolotto [20] used the APG terminology when they introduced the APG Age Index as a useful measure for evaluation of vascular aging in hypertensives.
In 2005,Ushiroyama et al. [21] used the APG terminology when they reported that patients with a sensation of coldness showed an improvement of the APG index (b - c - d)/a upon Sho treatment, which includes Kamishoyosan. Sho is one of the main concepts of Kampo medicine, and corresponds to the holistic tailored treatment suitable for the individual patient’s symptoms.
In 2006, Nousou et al. [22] used the APG terminology when they developed a diagnosis assistance system with a light load to the testee. This system measures the acceleration plethysmogram and reproduces the diagnosis by using Self-Organizing Maps. In 2007, Taniguchi et al. [23] used the APG terminology when they proposed a method for using the APG variability to evaluate the surgeon's stress in his/her using a surgical assistant system. In 2008, Fujimoto et al. [24] used the APG terminology when they proposed a possibility to diagnosis of stress by accelerated plethysmogram applied the criterion which combines two evaluation based on chaos theory; trajectory parallel measure method and size of neighbourhood space in chaos attractor.
Second Derivative Digital Velocity Pulse (SDDVP)
To date, two papers have been found using the SDDVP. The first by Millasseau et al. in 2003 [25] when they used the photoplethysmogram to examine the vascular impact of aging and vasoactive drugs.
The second paper by Rivas-Vilchis et al. in 2007, [26] when they used the photoplethysmogram to assess the vascular effects of PC6 (Neiguan) in healthy and hypertensive subjects.
In 2007, Taniguchi et al. [23] used the APG terminology when they proposed a method for using the
Several general preferences regarding standard terminologies for Photoplethysmogram signals have been introduced as following:
Standardization of Photoplethysmogram terminologies is highly desirable.
Each terminology system should be as simple as possible and has been used the most in literature.
The symbols should indicate the nature of the Photoplethysmogram signal type.
A symbol representing a given charge should not be easily confused with any of those representing the other biomedical signals types.
Various sets of symbols were proposed and problems associated with each set were noted as following:
Photoplethysmograph, Photoplethysmogram,and Digital Pulse Volume are the same terminologies with different a symbol PTG, PPG, and DVP.
Second Derivative Photoplethysmograph, Acceleration Photoplethysmograph are the same terminologies with different symbols SDPTG, and APG.
SEARCH STRATEGY
The data collected from PubMed database has been used for English literature and ScienceLinksJapan for Japanese literature. The reason behind choosing the PubMed database, it comprises more than 19 million citations for biomedical articles from MEDLINE and life science journals back to 1948.
PubMed includes links to full-text articles which may be found in other databases such as PubMed Central or at publisher web sites.
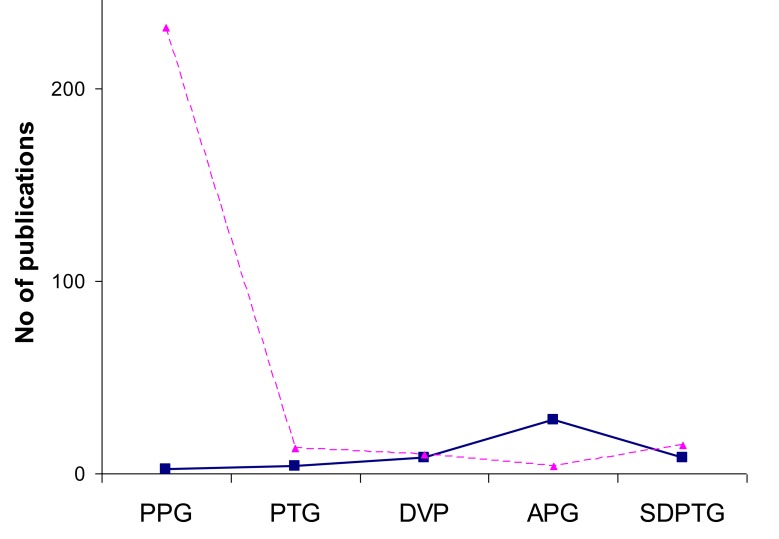
The total number of references for “Photoplethysmography” terminology was 1024, “Photoplethysmogram” was 91, “PPG”was 232, “PTG”was 13, “DVP” was 10, “APG” was 4, and “SDPTG” was 15 in PUBMED database.
On the other hand, the total number of references for “Photoplethysmography” terminology was 23, “Photoplethysmogram” was 24, “PPG”was 2, “PTG”was 4, “DVP” was 8, “APG” was 28, and “SDPTG” was 8 in SCIENCELINKS Japanese database.
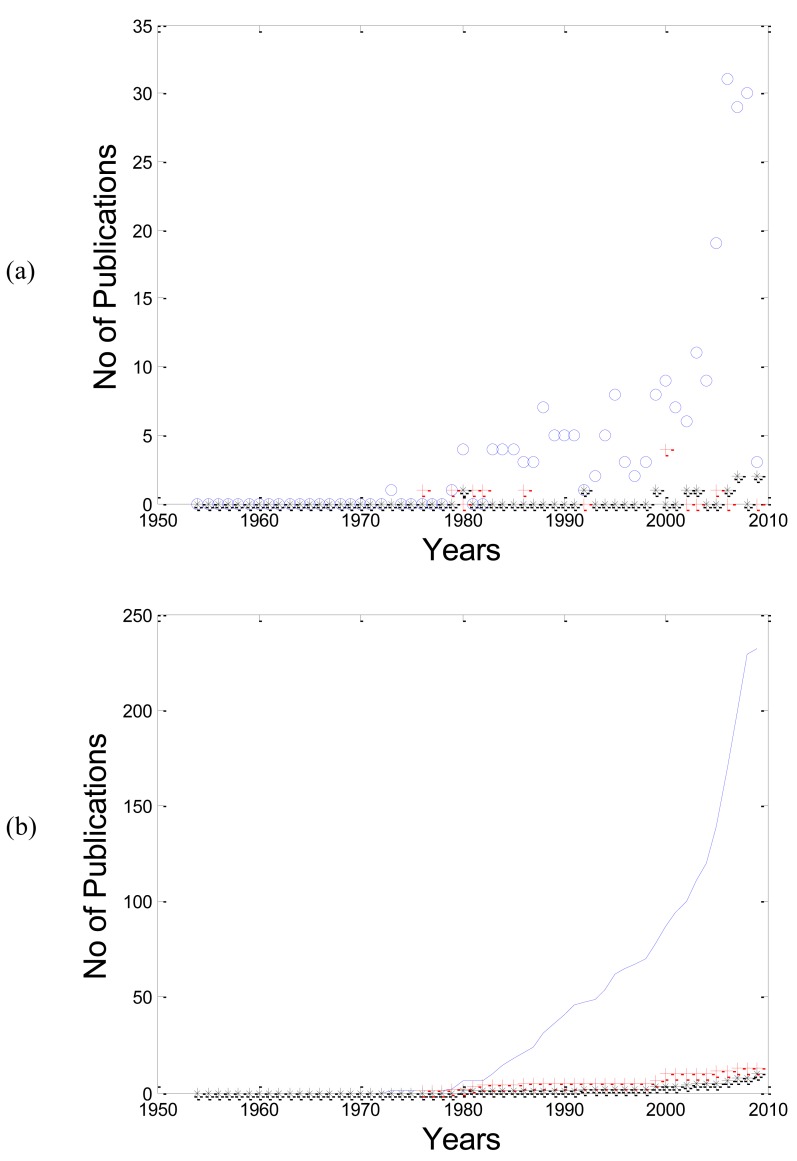
As shown in Fig. (2a); the number of publications for “PPG” is increasing with years more than “PTG” and “DVP”. In Fig. (2b), the cumulative sum of PPG clearly shows an exponential increase through years.
Fig. (2).
(a) the relationship between the photoplethysmogram terminologies (PPG”o”, PTG”+”, and DVP “*”) and the number of publications through years. (b) The relationship between the cumulative sum of PPG” solid curve”, PTG “dashed curve”, and DVP” dotted curve” terminologies with their number of publications. It is clear that the use of PPG is increasing exponentially over time.
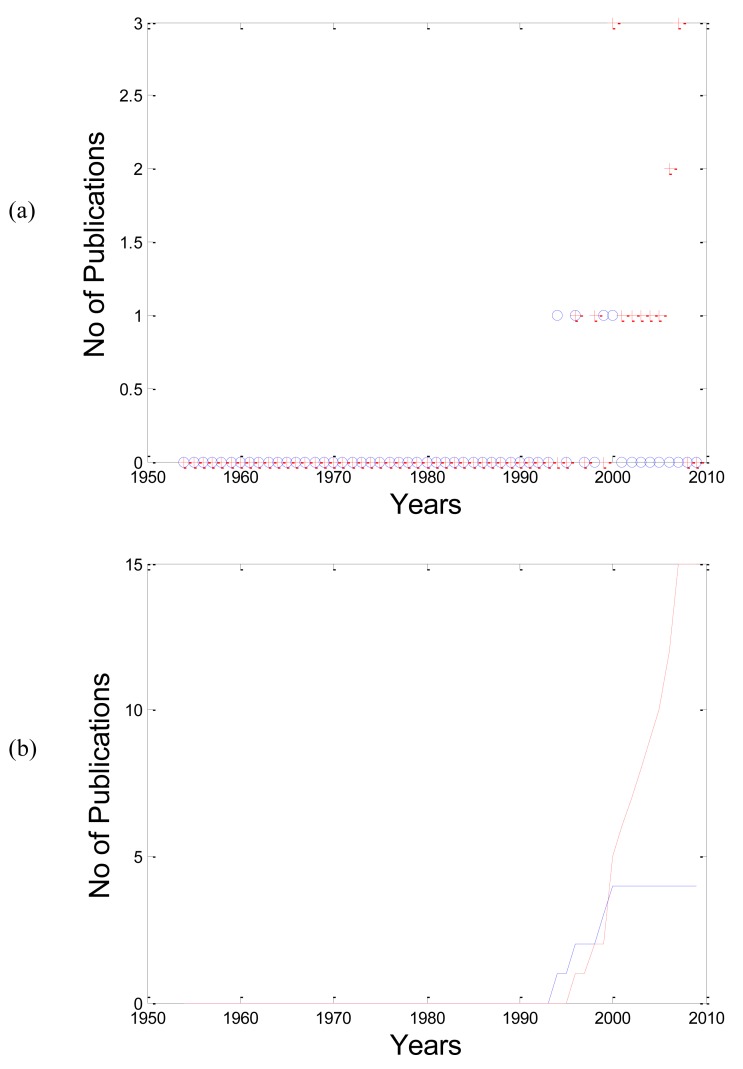
As shown in Fig. (3a); the number of publications for “APG” is increasing with years more than “SDPTG”. In Fig. (3b), the cumulative sum of APG clearly shows an exponential increase through years.
Fig. (3).
(a) The relationship between the acceleration photoplethysmogram terminologies (APG”+” and SDPTG ”o”) and their number of publications through years. (b) The relationship between the cumulative sum of APG” solid curve” and SDPTG” dotted curve” terminologies with their number of publications. It is clear that the use of SDPTG is increasing exponentially over time.
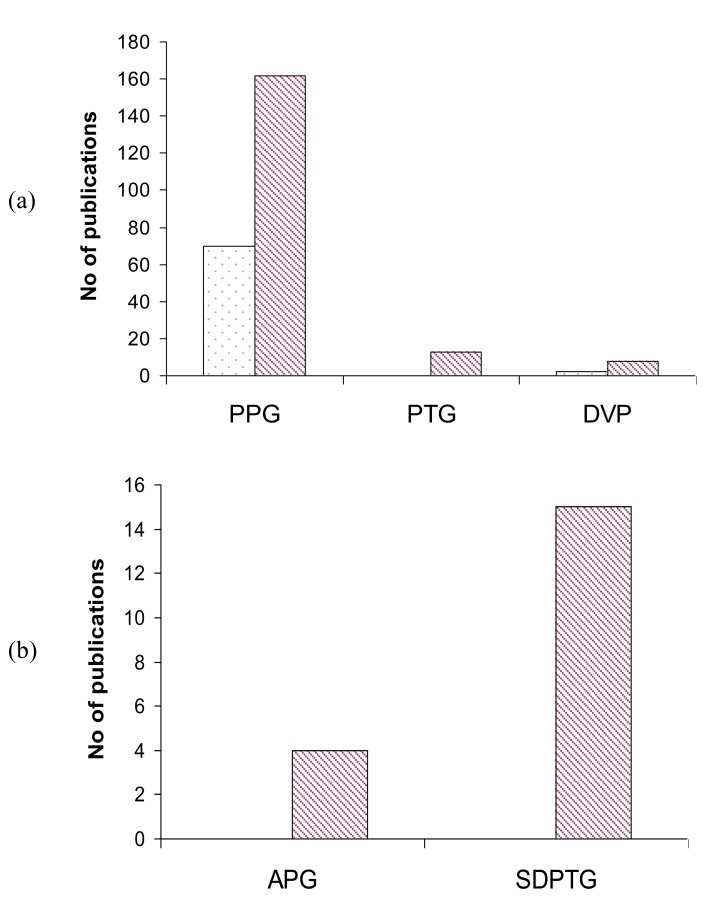
By categorizing the number of publication by its discipline, it is interesting to notice in Fig. (4a) that the usage of “PPG “,”PTG”, and “DVP” terminologies is more in Engineering than science “SDPTG”. In Fig. (4b), the usage of “APG” and “SDPTG” vanishes in Engineering compared to Science.
Fig. (4).
(a) usage of PPG, PTG and DVP in engineering field (dotted blocks) and science (dashed blocks). (b) usage of APG and SDPTG in science field because the number of publications using APG and SDPTG in engineering field is very limited.
The significant result in Fig. (5) shows that all Photoplethysmography terminologies are coherent between PubMed and ScienceLinksJapan in all terminologies except APG. APG has been used by Japanese scientist more than western scientist. Therefore, the recommended as standard naming for the discussed terminologies is:
| Terminology | Acronym |
| Photoplethysmography Photoplethysmogram Digital Velocity Pulse |
PPG |
| Second Derivative Photoplethysmography Second Derivative Photoplethysmogram Second Derivative Digital Velocity Pulse Acceleration Plethysmography |
APG |
Fig. (5).
Overall terminologies published in English literature ”dashed line” while the”solid line” in Japanese literature. It is clear that PPG is the most used acronym for photoplethysmogram and APG is the most used acronym for the second derivative of the photoplethysmogram signal.
CONCLUSION
The author suggests to all scientists and engineers active in photoplethymogram work to use PPG (for photoplethysmogram) and APG (for the second derivative photoplethysmogram) terminologies in oral presentations and written publications. The usage of different terminologies for the same signal can lead to a disconnect between different groups of engineers and scientists.
These standard terminologies will save the researcher’s efforts and overcome generating redundant results. It will also speed up the scientific progress in this multidisciplinary field. This paper is an attempt to resolve the difficulties and confusion regarding plethysmography terminologies which have persisted for more than 50 years.
ACKNOWLEDGEMENT
Mohamed Elgendi would like to gratefully acknowledge the Australian government and Charles Darwin University whose generous scholarships facilitated this research. He would like also to thank Prof. Friso De Boer, and Mrs. Mirjam Jonkman for their support. Elgendi would like also to acknowledge Dr. Justin Dauwels for proofreading the paper.
CONFLICT OF INTEREST
The authors confirm that this article content has no conflicts of interest.
REFERENCES
- 1.Tokutaka H, Maniwa Y, Gonda E, et al. Construction of a General Physical Condition Judgment System Using Acceleration Plethysmogram Pulse-Wave Analysis. Berlin/Heidelberg: Springer; 2009. pp. 307–15. [Google Scholar]
- 2.Alnaeb M, Alobaid N, Seifalian A, Mikhailidis D, Hamilton G. Optical techniques in the assessment of peripheral arterial disease. Curr Vasc Pharmacol. 2007;5:53–9. doi: 10.2174/157016107779317242. [DOI] [PubMed] [Google Scholar]
- 3.Hertzman A. The blood supply of various skin areas as estimated by the photoelectric plethysmograph. Am J Physiol. 1938;1924:329–40. [Google Scholar]
- 4.Takazawa K, Tanaka N, Fujita M, et al. Assessment of vasocative agents and vascular aging by the second derivative of photoplethysmogram waveform. Hypertension. 1998;32:365–70. doi: 10.1161/01.hyp.32.2.365. [DOI] [PubMed] [Google Scholar]
- 5.Elgendi M. On the analysis of fingertip photoplethysmogram signals. Curr Cardiol Rev. 2012;8(1):14–25. doi: 10.2174/157340312801215782. [DOI] [PMC free article] [PubMed] [Google Scholar]
- 6.Millasseau S, Kelly R, Ritter J, Chowienczyk P. Determination of age-related increases in large artery stiffness by digital pulse contour analysis. Clin Sci. 2002;103:371–7. doi: 10.1042/cs1030371. [DOI] [PubMed] [Google Scholar]
- 7.Padilla JM, Berjano EJ, Saiz J, Facila L, Diaz P, Merce S. Assessment of relationships between blood pressure, pulse wave velocity and digital volume pulse. Comp Cardiol. 2006;33:893–6. [Google Scholar]
- 8.Alty SR, Angarita-Jaimes N, Millasseau SC, Chowienczyk PJ. Predicting arterial stiffness from the digital volume pulse waveform. Biomed Eng IEEE Trans. 2007;54(12):2268–75. doi: 10.1109/tbme.2007.897805. [DOI] [PubMed] [Google Scholar]
- 9.Mishima N, Kubota S, Nagata S. Psychophysiological correlates of relaxation induced by standard autogenic training. J Psychother Psychosomat. 1999;68(4):207–13. doi: 10.1159/000012334. [DOI] [PubMed] [Google Scholar]
- 10.Yashima K, Sasaki T, Kageyama Y, Odagaki M, Hosaka H. Application of wavelet analysis to the plethysmogram for the evaluation of mental stress. Eng Med Biol Soc 2005 IEEE-EMBS 2005 27th Annual International Conference of the IEEE. 2005. [DOI] [PubMed]
- 11.Kageyama Y, Odagaki M, Hosaka H. Wavelet Analysis for Quantification of Mental Stress Stage by Finger-tip Photo-plethysmography. Eng Med Biol Soc 2007 EMBS 2007 29th Ann Intern Conf IEEE. 2007. [DOI] [PubMed]
- 12.Abe M, Yoshizawa M, Sugita N, et al. A method for evaluating effects of visually-induced motion sickness using ICA for photoplethysmography. Eng Med Biol Soc 2008 EMBS 2008 30th Ann Intern Conf IEEE. 2008. [DOI] [PubMed]
- 13.Cox P, Madsen C, Ryan KL, Convertino VA, Jovanov E. Investigation of photoplethysmogram morphology for the detection of hypovolemic states. Eng Med Biol Soc 2008 EMBS 2008 30th Ann Intern Conf IEEE. 2008. [DOI] [PubMed]
- 14.Gil E, Mendez M, Vergara JM, Cerutti S, Bianchi AM, Laguna P. Discrimination of sleep-apnea-related decreases in the amplitude fluctuations of PPG signal in children by HRV analysis. Biomed Eng IEEE Transact. 2009;56(4):1005–14. doi: 10.1109/TBME.2008.2009340. [DOI] [PubMed] [Google Scholar]
- 15.Imanaga I, Hara H, Koyanagi S, Tanaka K. Correlation between wave components of the second derivative of plethysmogram and arterial distensibility. Jpn Heart J. 1998;39:775–84. doi: 10.1536/ihj.39.775. [DOI] [PubMed] [Google Scholar]
- 16.Baek HJ, Kim JS, Kim YS, Lee HB, Park KS. Second Derivative of Photoplethysmography for Estimating Vascular Aging. The 6th International Special Topic Conference on Information Technology Applications in Biomedicine; 2007. pp. 70–2. [Google Scholar]
- 17.Kimura Y, Takamatsu K, Fujii A, et al. Kampo therapy for premenstrual syndrome: Efficacy of Kamishoyosan quantified using the second derivative of the fingertip photoplethysmogram. Japan Soc Obstet Gynecol. 2007;33(3):325–32. doi: 10.1111/j.1447-0756.2007.00531.x. [DOI] [PubMed] [Google Scholar]
- 18.Katsuki TY, Yuuzu T, Tanaka H, Okano R. A new index of acceleration plethysmogram and its clinical physiological evaluation. J Physiol Jpn. 1994;56(7):215–22. [PubMed] [Google Scholar]
- 19.Takada HWK, Harrel JS, Iwata H. Acceleration plethysmography to evaluate aging effect in cardiovascular system. Using new criteria of four wave patterns. Med Prog Technol. 1996;21:205–10. [PubMed] [Google Scholar]
- 20.Bortolotto LA, Blacher J, Kondo T, Takazawa K, Safar M. Assessment of vascular aging and atherosclerosis in hypertensive subjects: second derivative of photoplethysmogram versus pulse wave velocity. Am J Hypertension. 2000;13:65–71. doi: 10.1016/s0895-7061(99)00192-2. [DOI] [PubMed] [Google Scholar]
- 21.Ushiroyama T, Kajimoto Y, Sakuma K, Ueki M. Assessment of chilly sensation in Japanese women with Laser Doppler Fluxmetry and Acceleration Plethysmogram with Respect to Peripheral Circulation. Bull Osaka Med Coll. 2005;51(2):76–84. [Google Scholar]
- 22.Nousou N, Urase S, Maniwa Y, Fujimura K, Fukui Y. Classification of Acceleration Plethysmogram Using Self-Organizing Map. Intelligent Signal Processing and Communications, 2006 ISPACS '06 International Symposium. 2006. pp. 681–4.
- 23.Taniguchi K, Nishikawa A, Nakagoe H, et al. Evaluating the surgeon's stress when using surgical assistant robots. Robot and Human interactive Communication, 2007 RO-MAN 2007 The 16th IEEE Intern Symposium. 2007. pp. 888–93.
- 24.Fujimoto Y, Yamaguchi T. Evaluation of Mental Stress by Analyzing Accelerated Plethysmogram Applied Chaos Theory and Examination of Welfare Space Installed User’s Vital Sign. Proc 17th World Cong The Intern Federation Automat Control. 2008.
- 25.Millasseau S, Kelly R, Ritter J, Chowienczyk P. The vascular impact of aging and vasoactive drugs: comparison of two digital volume pulse measurements. Am J Hyperten. 2003;16(6):476–2. doi: 10.1016/s0895-7061(03)00569-7. [DOI] [PubMed] [Google Scholar]
- 26.Rivas-Vilchis J, Hernández-Sánchez F, González-Camarena R, et al. Assessment of the vascular effects of PC6 (Neiguan) using the second derivative of the finger photoplethysmogram in healthy and hypertensive subjects. Am J Chin Med. 2007;35(3):427–36. doi: 10.1142/S0192415X07004941. [DOI] [PubMed] [Google Scholar]


