

Abstract
Objectives
Stratified management for low back pain according to patients' prognosis and matched care pathways has been shown to be an effective treatment approach in primary care. The aim of this within-trial study was to determine the economic implications of providing such an intervention, compared with non-stratified current best practice, within specific risk-defined subgroups (low-risk, medium-risk and high-risk).
Methods
Within a cost–utility framework, the base-case analysis estimated the incremental healthcare cost per additional quality-adjusted life year (QALY), using the EQ-5D to generate QALYs, for each risk-defined subgroup. Uncertainty was explored with cost–utility planes and acceptability curves. Sensitivity analyses were performed to consider alternative costing methodologies, including the assessment of societal loss relating to work absence and the incorporation of generic (ie, non-back pain) healthcare utilisation.
Results
The stratified management approach was a cost-effective treatment strategy compared with current best practice within each risk-defined subgroup, exhibiting dominance (greater benefit and lower costs) for medium-risk patients and acceptable incremental cost to utility ratios for low-risk and high-risk patients. The likelihood that stratified care provides a cost-effective use of resources exceeds 90% at willingness-to-pay thresholds of £4000 (≈ 4500; $6500) per additional QALY for the medium-risk and high-risk groups. Patients receiving stratified care also reported fewer back pain-related days off work in all three subgroups.
Conclusions
Compared with current best practice, stratified primary care management for low back pain provides a highly cost-effective use of resources across all risk-defined subgroups.
Introduction
The health, social and economic burden of low back pain is well established.1–3 In the UK, annual total costs attributable to low back pain have been estimated at £12.3 billion; £1.6 billion for direct healthcare resources, £1.6 billion related to informal care and £9.1 billion through production loss (indirect costs) due to morbidity.1 Despite adopting different methodologies, evidence from North America and Europe has consistently observed that the provision of care by primary care practitioners and physiotherapists contributes 25%–30% of direct healthcare costs and indirect costs represent the majority of overall costs.1 4
Despite a number of high-quality randomised controlled trials in recent years,5–9 fundamental questions about which patients will respond best to specific interventions remain unanswered, although clear support exists for active intervention over ‘no treatment’.10 11 To acknowledge the accepted concept of low back pain patient heterogeneity, a recent study found that a novel stratified primary care management approach based on the use of a prognostic screening tool (to allocate patients into one of three risk-defined groups) combined with matched treatment pathways improves long-term disability compared with current best practice.12 13
Previous economic evaluations have demonstrated the cost-effectiveness of interventions that include manual therapy techniques compared with active comparator groups,14–16 while group-based cognitive behavioural treatments9 and acupuncture care17 have also provided acceptable cost-effectiveness estimates. However, the consistency of small clinical differences between treatment groups and the paucity of cost-effectiveness evidence means that a degree of uncertainty exists regarding the value of low back pain treatments.18 Evidence for the overall cost-effectiveness of a stratified primary care management approach for low back pain has been reported elsewhere.13 This study provides new data from a prespecified subgroup analysis, reporting the first detailed assessment of cost- effectiveness within risk-defined subgroups resulting from a stratified treatment approach.
Methods
Trial design and interventions
Full details of the trial design, rationale, participants and interventions have been reported elsewhere;12 13 online supplementary appendix S1 provides brief details of the screening tool used to stratify patients and the content of the interventions. Adults aged 18 years and over with low back pain of any episode duration consulting in 1 of 10 general practices in North Staffordshire (UK) were invited to receive initial assessment and treatment in a physiotherapy-led back pain referral clinic. In the clinic, an administrator telephoned a remote trials unit that used random computer sequence selection of stratified blocks with a 2:1 ratio to randomly assign participants to receive stratified primary care management (intervention, n=568) or current best practice (in line with standard physiotherapy; control group, n=283). The controlled trial was powered to explore two primary objectives: (1) to investigate the overall effectiveness of stratified primary care back pain management with matched treatment pathways against non-stratified current best practice and (2) to determine whether low-risk patients had non-inferior outcomes, and medium-risk and high-risk patients had superior outcomes when receiving the stratified care intervention. This study reports the economic consequences of stratified care for each risk-defined subgroup within a cost–utility framework.
Economic study design
The base-case economic analysis was performed from a healthcare perspective, incorporating UK National Health Service (NHS) and private back pain-related healthcare resources utilised during the 12-month follow-up period (further details provided below). In line with the clinical evaluation, the provision of estimates for the cost-effectiveness of stratified primary care management within each risk-defined subgroup was a prespecified analysis.12 13 However, differences in the methodological approaches and reporting techniques of the controlled trial and economic evaluation are a reflection of the different research objectives and analytical paradigms of clinical and economic research.19 20
Data: measures and collection
Details of the numbers of study-related physiotherapy sessions attended by each participant were collected through case report forms and an audit of clinical notes for the participating physiotherapy services. All other outcome data included in the analysis were collected via self-report postal questionnaires.12
Health outcomes
The EQ-5D was used to measure preference-based health- related quality of life at baseline, 4-months and 12-months.21 For each EQ-5D response, utility scores were generated using the ‘York A1 tariff’; preference data for this tariff were elicited from a representative sample of the UK adult population, providing index scores within a range of −0.594 (the lowest level on each dimension) to 1.000 (the highest level on each dimension).22 Negative values indicate that some health states are valued worse than death. Using area-under-the-curve analysis, assuming linear interpolation between consecutive time-points, EQ-5D responses were used to generate quality-adjusted life years (QALYs). The QALY represents the benefit of a healthcare intervention in terms of time spent in a series of quality-weighted health states. In this study, the maximum number of QALYs was equal to 1, with QALY scores below 1 reflecting less than perfect health.
Healthcare resource use and unit costs
The 12-month follow-up questionnaire collected resource use data for a range of services: primary healthcare consultations (general practitioners and practice nurses), consultations with other healthcare professionals (eg, hospital consultants, physiotherapists, acupuncturists), hospital-based procedures (diagnostic tests, epidural injections, inpatient episodes), prescribed medication, and patient borne out-of-pocket expenditure on treatments and/or aids. Where appropriate, patients were required to distinguish between UK NHS and private provision. Details of consultations with healthcare practitioners for health reasons other than low back pain were also collected. Unit costs used in the analysis are reported in online supplementary table S1, expressed as UK averages in 2008/09 prices.23–29
Work-related outcomes
To assess the economic consequences of the stratified management intervention beyond healthcare resources, self-reported details of participants' employment status were collected at baseline and 12 months. For those in paid employment, the self-report questionnaires requested further details of typical work activities and periods of back pain-related work absence. Costs were assigned using the human capital approach;30 self-reported days of work absence were multiplied by respondent-specific wage estimates identified from annual earnings data and UK Standard Occupational Classification coding.29 31
Statistical analysis
Analysis was performed according to the intention-to-treat principle, with imputation techniques adopted to address the issue of incomplete data. For the returned 12-month questionnaires, a small number of missing resource use values (<3%) were imputed using mean substitution based on the observed data for the respective resource category. Following this, multiple imputation was used to impute all missing values for the EQ-5D and total cost estimates for non-responders to the 12-month questionnaire.32 Five estimates for each missing value were generated using simulation based on a multivariate normal model. The imputed observation is the arithmetic mean of the five estimated values, with reported SDs and CI adjusted to incorporate the additional ‘between-imputation’ variance.32
Within each risk-defined subgroup, the analytic comparison focused on the joint estimation of incremental costs and incremental QALYs (with increments calculated as the intervention group value minus the control group value).19,20 The primary unit of outcome was the incremental cost per-QALY (incremental cost divided by incremental QALY), a ratio measure that provides an estimate of the cost required to achieve one additional QALY. Costs relating to periods of work absence were analysed separately, without incorporation into the incremental ratio. For the estimation of incremental QALYs, between-group imbalances were accounted for through multiple regression-based adjustment for age, gender, duration of pain at baseline, and baseline scores on the primary outcome measure (Roland–Morris Disability Questionnaire (RMDQ)33) and EQ-5D.34 Given the 12-month follow-up period of the trial no discounting was necessary.
Consideration of uncertainty around the incremental ratio using CI estimation is problematic, particularly with small denominator values. Within economic evaluation, the derivation of cost–utility planes and acceptability curves, through the application of bootstrap techniques, provides a graphical display (plane and curve) and quantification (curve) of the level of uncertainty around ratio point estimates;35 25 000 bootstrapped replications of incremental cost–utility pairs were used in the assessment of uncertainty (5000 for each imputed data set).
To explore variation in disaggregated outcomes (costs, QALYs and EQ-5D scores), CI estimation was performed. This is a secondary consideration in economic evaluation due to the focus on joint estimation of costs and effects rather than arbitrary rules of conventional statistical inference.19 Given the level of skewness typically observed for cost data, CIs were generated using parametric methods and bias-corrected and accelerated bootstrapping.36 Statistical analysis was performed using SPSS for Windows V.17 and STATA V.11.
Sensitivity analysis
Sensitivity analyses were performed to explore variation in methodological approaches: (1) analysis of healthcare resources funded by the NHS only, in line with recommendations from the National Institute for Health and Clinical Excellence in the UK;37 (2) the incorporation of non-back pain-related consultations with healthcare professionals; (3) a complete case analysis, where inclusion required a valid EQ-5D response at each data collection stage and complete healthcare resource use data at 12-month follow-up; and (4) consideration of variation in the unit cost of private healthcare. The final sensitivity analysis involved simultaneously multiplying the unit costs of private healthcare by a price premium ranging from one (private costs equal NHS costs) to three (private costs are three times the unit cost of the NHS equivalent).
Results
The clinical trial identified significant overall reductions in back pain disability (RMDQ) at 4 and 12 months using the stratified management approach compared with current best practice. Briefly, there were significant between-group differences in RMDQ adjusted mean change scores for medium-risk patients at 4 and 12 months, and high-risk patients at 4 months. Low-risk patients had non-inferior outcomes compared with controls at both time-points. Baseline characteristics were similar across treatment groups (within each stratified risk group).13
Observed responses and presentation of data
Cost estimates were derived for 567 (67%) responders at 12 months. For the EQ-5D, complete data were provided by 458 (54%) participants; time-point specific response rates were 99% (baseline), 73% (4 months) and 62% (12 months). The numbers of physiotherapy sessions resulting from the study back pain clinic were available for all participants. Baseline gender and back pain disability (RMDQ) were similar between 12-month responders and those lost to follow-up, although non-responders were significantly younger.12 Following the multiple imputation procedure, all 851 participants were included in the base-case analysis.
For each risk-defined subgroup, disaggregated back pain-related healthcare cost data are reported in table 1 for the 12-month responders; corresponding resource use data are provided in online supplementary table S2. Total cost estimates for ‘intervention’ and ‘control’ groups and the difference between treatment groups are also reported for each risk-group analysis. Quality of life data (EQ-5D and QALY scores) are provided in table 2.
Table 1.
Back pain-related healthcare costs (£) per patient, by treatment and risk group, for patients providing utilisation data at 12 months (n=567). Values are mean (SD) costs unless stated otherwise
| Cost (£) | ||
|---|---|---|
| Healthcare resource | Intervention | Control group |
| Low-risk | n=97 | n=47 |
| Study back pain clinic and physiotherapy | 31.03 (38.2) | 68.62 (66.1) |
| Primary care general practitioner | 13.67 (33.6) | 19.53 (44.2) |
| Primary care nurse | 0.00 (−) | 0.25 (0.16) |
| NHS consultant | 3.84 (21.6) | 9.07 (39.9) |
| Private consultant | 6.80 (49.4) | 3.25 (18.5) |
| NHS diagnostic tests | 7.73 (38.1) | 0.68 (4.7) |
| NHS epidural injections | 0.00 (−) | 0.00 (−) |
| Private diagnostic tests | 1.85 (18.2) | 0.00 (−) |
| Private epidural injections | 2.11 (20.8) | 0.00 (−) |
| NHS (non-study) physiotherapy | 13.86 (61.1) | 9.57 (27.3) |
| Private physiotherapy | 0.39 (3.9) | 3.10 (19.0) |
| NHS ‘other’ healthcare professional | 0.00 (−) | 0.00 (−) |
| Private ‘other’ healthcare professional | 3.29 (22.9) | 5.26 (19.6) |
| Prescribed medication | 2.77 (11.2) | 0.90 (3.0) |
| ‘Over-the-counter’ treatments | 7.88 (26.8) | 8.12 (14.7) |
| Medium-risk | n=175 | n=87 |
| Study back pain clinic and physiotherapy | 111.19 (49.5) | 96.75 (86.3) |
| Primary care general practitioner | 30.44 (60.4) | 43.22 (66.1) |
| Primary care nurse | 0.68 (4.3) | 1.14 (5.8) |
| NHS consultant | 22.57 (72.5) | 26.7 (73.7) |
| Private consultant | 3.35 (24.9) | 5.22 (37.6) |
| NHS diagnostic tests | 13.50 (49.3) | 28.65 (80.4) |
| NHS epidural injections | 2.34 (21.8) | 0.00 (−) |
| Private diagnostic tests | 0.00 (−) | 2.06 (19.2) |
| Private epidural injections | 0.00 (−) | 0.00 (−) |
| NHS (non-study) physiotherapy | 13.16 (50.6) | 34.09 (71.6) |
| Private physiotherapy | 1.36 (9.8) | 9.45 (46.8) |
| NHS ‘other’ healthcare professional | 1.55 (19.6) | 4.60 (30.1) |
| Private ‘other’ healthcare professional | 12.82 (58.4) | 4.29 (31.6) |
| Prescribed medication | 14.33 (69.1) | 23.52 (66.1) |
| ‘Over-the-counter’ treatments | 11.34 (48.9) | 14.25 (35.0) |
| High-risk | n=114 | n=47 |
| Study back pain clinic and physiotherapy | 166.91 (67.6) | 109.56 (88.8) |
| Primary care general practitioner | 55.23 (79.8) | 55.55 (71.8) |
| Primary care nurse | 3.46 (17.0) | 2.52 (8.44) |
| NHS consultant | 47.23 (126.9) | 48.00 (111.1) |
| Private consultant | 5.39 (37.5) | 5.28 (25.3) |
| NHS diagnostic tests | 23.55 (78.0) | 21.77 (57.8) |
| NHS epidural injections | 5.38 (32.9) | 8.71 (41.7) |
| Private diagnostic tests | 1.57 (16.8) | 0.00 (−) |
| Private epidural injections | 0.00 (−) | 4.35 (29.8) |
| NHS (non-study) physiotherapy | 26.40 (63.5) | 54.91 (104.7) |
| Private physiotherapy | 3.88 (28.9) | 4.14 (21.0) |
| NHS ‘other’ healthcare professional | 2.54 (19.7) | 4.83 (33.1) |
| Private ‘other’ healthcare professional | 5.60 (31.4) | 3.68 (25.2) |
| Prescribed medication | 18.84 (95.5) | 10.23 (17.6) |
| ‘Over-the-counter’ treatments | 11.30 (26.6) | 16.52 (31.9) |
| Estimates for the base-case (imputed) analysis | ||
| Total healthcare cost: low-risk group (n=221) | 96.15 (191.6) | 160.44 (279.8) |
| Mean difference (95% CI; p value)* | −64.29 (−132.0 to 3.5; 0.06) | |
| Total healthcare cost: medium-risk group (n=394) | 235.08 (304.0) | 287.8 (338.6) |
| Mean difference (95% CI; p value)* | −52.72 (−119.0 to 13.6; 0.12) | |
| Total healthcare cost: high-risk group (n=236) | 383.88 (456.3) | 357.47 (585.7) |
| Mean difference (95% CI; p value)* | 26.41 (−112.6 to 165.5; 0.71) | |
Difference=targeted intervention – control group. Reported confidence intervals were generated using conventional parametric methods.
NHS, National Health Service.
Table 2.
Descriptive and incremental health outcomes over 12 months for the base-case and complete case analyses. Values are mean (SD) scores unless stated otherwise*
| Health outcomes | Intervention | Control group | Mean difference† (95% CI) |
|---|---|---|---|
| Base-case (imputed) analysis | |||
| Low-risk | n=148 | n=3 | |
| Baseline EQ-5D | 0.725 (0.19) | 0.733 (0.15) | −0.008 (−0.05 to 0.04) |
| 4-month EQ-5D | 0.799 (0.21) | 0.821 (0.18) | −0.022 (−0.07 to 0.03) |
| 12-month EQ-5D | 0.787 (0.20) | 0.773 (0.24) | 0.014 (−0.05 to 0.08) |
| QALYs over 12 months‡ | – | – | −0.001 (−0.04 to 0.03) |
| p=0.94 (2 dp) | |||
| Medium-risk | n=263 | n=131 | |
| Baseline EQ-5D | 0.540 (0.27) | 0.573 (0.27) | −0.033 (−0.12 to 0.06) |
| 4-month EQ-5D | 0.702 (0.28) | 0.674 (0.28) | 0.028 (−0.03 to 0.09) |
| 12-month EQ-5D | 0.687 (0.32) | 0.635 (0.31) | 0.052 (−0.01 to 0.12) |
| QALYs over 12 months‡ | – | – | 0.044 (0.00 to 0.09)§ |
| p=0.04 (2 dp) | |||
| High-risk | n=157 | n=79 | |
| Baseline EQ-5D | 0.325 (0.33) | 0.252 (0.35) | 0.073 (−0.02 to 0.16) |
| 4-month EQ-5D | 0.585 (0.35) | 0.474 (0.38) | 0.111 (0.02 to 0.20) |
| 12-month EQ-5D | 0.541 (0.37) | 0.458 (0.38) | 0.083 (−0.01 to 0.18) |
| QALYs over 12 months‡ | – | – | 0.057 (−0.01 to 0.12) |
| p=0.08 (2 dp) | |||
| Complete-case analysis‡ | |||
| Low-risk subgroup (n=115 in total) | – | – | −0.007 (−0.04 to 0.03) |
| p=0.70 (2 dp) | |||
| Medium-risk subgroup (n=220 in total) | – | – | 0.022 (−0.02 to 0.07) |
| p=0.35 (2 dp) | |||
| High-risk subgroup (n=123 in total) | – | – | 0.077 (−0.00 to 0.16)¶ |
| p=0.06 (2 dp) |
QALYs, quality-adjusted life years, dp, decimal places.
Difference=targeted intervention – control group. Reported CIs were generated using conventional parametric methods.
Incremental QALY estimates following multiple regression-based adjustment for age, gender, duration of pain at baseline, and baseline scores on the RMDQ and EQ-5D. For the complete case analysis, only the incremental QALY estimate is provided.
The true value of ‘0.00’ is positive; the figure reported is rounded to 2 dp.
The true value of ‘0.00’ is negative; the figure reported is rounded to 2 dp.
Estimation of cost–utility
Point estimates of incremental costs and incremental QALYs demonstrate the stratified management approach to be cost-effective in all three risk groups. Based on conventional willingness to pay thresholds for additional QALYs (approximately £20 000 per QALY),38 the incremental cost to utility ratio of £463 (£26.41/0.057 QALYs) in the high-risk group demonstrates that the additional health benefits are worth the additional cost. For the medium-risk group, a dominant position was observed for the stratified management intervention, that is, greater mean health benefit (0.044 additional QALYs) achieved at a lower mean healthcare cost (-£52.72); a position of dominance negates the need to calculate an incremental cost-utility ratio. Finally, for the low-risk group, the intervention was associated with a lower mean healthcare cost (-£64.29) and a lower mean health benefit (−0.001 QALYs). The incremental cost to utility ratio of £48707 (-£64.29/-0.001 QALYs (QALY estimate to three decimal places)) indicates that the cost savings of the low-risk intervention are worth the negligible decrement in health or, alternatively, the incremental cost required to achieve the small health benefit associated with the control group is too expensive.
Figures 1A–C presents cost–utility planes for each risk-group analysis. The location of the ‘swarm’ of bootstrapped cost–utility pairs identifies the nature of the uncertainty in the incremental cost and QALY estimates; cost savings but considerable uncertainty regarding health benefit within the low-risk group (cost–utility pairs are straddling the southern quadrants, figure 1A), cost savings and increased effectiveness within the medium-risk group (the majority (93%) of cost–utility pairs are located within the south-east quadrant, figure 1B), and increased costs and benefits for high-risk patients (the majority (67%) of cost–utility pairs are located within the north-east quadrant, figure 1C). The cost–utility acceptability curve is presented in figure 2, with all three risk-group analyses presented on the same figure. The acceptability curve quantifies the joint uncertainty in incremental costs and effects; to illustrate, if a decision maker is willing to pay £20 000 (≈€23 000; $32 000) for an additional QALY,38 the stratified management intervention is associated with probabilities exceeding 0.99 and 0.95 of providing better value for money compared with current best practice for the medium-risk and high-risk groups, respectively. For the low-risk group, the plateau around a probability of 0.50 reflects the negligible difference in QALYs; the stratified management intervention is identified as the cost-effective treatment option at low willingness to pay levels due to the estimated cost savings.
Figure 1.
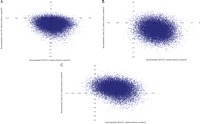
(A) Cost–utility plane comparing the stratified management approach (‘intervention’) to current best practice (‘control’) for the low-risk subgroup. (B) Cost–utility plane comparing the stratified management approach (‘intervention’) to current best practice (‘control’) for the medium-risk subgroup. (C) Cost–utility plane comparing the stratified management approach (‘intervention’) to current best practice (‘control’) for the high-risk subgroup. QALY, quality-adjusted life year.
Figure 2.
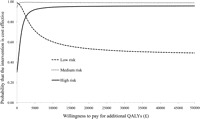
Cost–utility acceptability curves for the three risk group comparisons of stratified primary care management (‘intervention’) compared to current best practice. QALYs, quality-adjusted life years.
Work-related outcomes
Results regarding paid employment, work status and back pain-related work absence are reported in table 3. Stratified primary care was associated with fewer self-reported days off work within each risk-defined subgroup and societal cost savings were observed in the low-risk and medium-risk groups.
Table 3.
Description of work-related outcomes for participants in paid employment (work status, absence and indirect cost estimates), by treatment and risk group. Values are numbers (percentages) unless stated otherwise*
| Intervention | Control group | |
|---|---|---|
| Low-risk: working in paid employment at baseline | 112 of 148 | 50 of 73 |
| Low-risk: working in paid employment at 12 months | 65 of 97 | 29 of 47 |
| Doing usual job | 64 (98) | 27 (96) |
| Working fewer hours | 0 (0) | 0 (0) |
| Doing lighter duties | 0 (0) | 0 (0) |
| On paid/unpaid sick leave | 1 (2) | 1 (4) |
| Reported time off work due to low back pain | 8 (12) | 5 (17) |
| Mean (SD) number of days absence | 0.37 (1.2) | 3.00 (11.9) |
| Mean (SD) cost (£) of back pain-related work absence | 32 (109.5) | 240 (1045.3) |
| Medium-risk: working in paid employment at baseline | 158 of 263 | 83 of 131 |
| Medium-risk: working in paid employment at 12 months | 81 of 175 | 48 of 87 |
| Doing usual job | 72 (89) | 40 (83) |
| Working fewer hours | 3 (4) | 3 (6) |
| Doing lighter duties | 3 (4) | 1 (2) |
| On paid/unpaid sick leave | 3 (4) | 4 (8) |
| Reported time off work due to low back pain | 22 (27) | 20 (42) |
| Mean (SD) number of days absence | 4.13 (15.9) | 18.44 (47.2) |
| Mean (SD) cost (£) of back pain-related work absence | 402 (1682.6) | 1759 (4651.3) |
| High-risk: working in paid employment at baseline | 80 of 157 | 41 of 79 |
| High-risk: working in paid employment at 12 months | 54 of 114 | 21 of 47 |
| Doing usual job | 46 (88) | 20 (95) |
| Working fewer hours | 3 (6) | 0 (0) |
| Doing lighter duties | 1 (2) | 0 (0) |
| On paid/unpaid sick leave | 2 (4) | 1 (5) |
| Reported time off work due to low back pain | 16 (30) | 8 (38) |
| Mean (SD) number of days absence | 9.85 (35.4) | 10.57 (18.2) |
| Mean (SD) cost (£) of back pain-related work absence | 990 (3419.5) | 850 (1519.1) |
Percentages relate to the number of employed participants, specific to the number of valid 12-month questionnaire responses within each risk group. Categories are not mutually exclusive. The estimation of indirect costs focused on the subsample of respondents in paid employment at 12 months (298/567).
Sensitivity analysis
For each risk-defined subgroup, the same policy implications of the base-case analysis were replicated in all sensitivity analyses that explored variation in the adopted costing methodology, that is, a dominant position for the medium-risk group and acceptable incremental ratios for the low-risk and high-risk groups. Within the complete-case analysis, the stratified management intervention was associated with lower costs and greater health benefit compared with current best practice in the medium-risk and high-risk groups. Cost estimates for the sensitivity analyses are reported in online supplementary table S3; corresponding incremental QALY data are reported in table 2.
Discussion
Primary care management of low back pain based on the use of a prognostic screening tool combined with matched treatment pathways is a cost-effective strategy compared with current best practice across all three risk-defined subgroups. Further support for the stratified management approach was provided through the identification of societal cost savings due to reductions in back pain-related work absence (in the low-risk and medium-risk groups) and the robustness of results when exploring variation in methodological approaches. These results provide the first report of risk group-specific cost-effectiveness findings for such an approach in the primary care management of low back pain.
Our results are applicable to a particular group of patients and healthcare professionals and caution should be exercised when drawing comparisons with other literature. The health benefits (incremental QALYs) attributable to the stratified intervention observed in the medium-risk (0.044) and high-risk (0.057) groups are larger than those previously reported in low back pain economic evaluations.14–17 39 One UK-based study of group cognitive behavioural treatment compared with a single advisory consultation observed an incremental QALY score of 0.099,9 although a contributory factor in the magnitude of the incremental estimate reported by Lamb and colleagues was an atypical decrement in quality of life within the control group over 12 months.
Strengths, limitations and unanswered questions
Economic evaluations should provide decision-makers with evidence regarding the joint estimation of mean costs and effects and the appropriate handling of uncertainty.19 20 The strengths of our analysis lie in the adopted approaches, comprehensive assessment of multiple research questions and the disaggregated presentation of results. The positive results for the stratified intervention across all three risk groups, the robustness of study findings in the sensitivity analyses and the sizeable cost savings associated with fewer days off work suggest that alternative settings (eg, location) are unlikely to question the study findings. In addition, medium-risk and high-risk patients receiving current best practice sought additional healthcare over the 12-month follow-up, beyond the study treatment sessions (eg, non-study physiotherapy), compared with those randomised to stratified care, which provided no discernible health benefits. Currently, the clinical and/or cost-effectiveness of a stratified management approach in different clinical scenarios, such as one led by general practitioners, is unknown.
The resource use and work-related data collection methods may be regarded as a limitation. The collection of such data requires a balance between sufficient coverage of relevant questions and preventing unnecessary burden to patients and researchers. A comprehensive range of resources were costed in the study but there were considered omissions, for example, travel costs associated with attending study clinic sessions were not included because the magnitude of the difference between groups was expected to be minimal. Although criticisms of self-report resource use and work-related data are well established,40 41 the method provides an efficient approach to data collection in the absence of routine data sources and has been used extensively in trial-based evaluations.9 16 17 In addition, data for the key driver of total cost estimates (ie, the study clinic sessions) were fully observed following an audit of physiotherapy service databases.
Missing data raise questions about the validity of study findings. Response rates for the primary cost (67% at 12 months) and QALY (54% over 12 months) outcomes were low. Multiple imputation techniques were used to address potential biases regarding incomplete data. Results of the base-case (imputed) analysis and the complete-case analysis were comparable with regard to policy implications, although, inevitably, point estimates for incremental costs and incremental QALYs differed across the analyses. The additional between-imputation uncertainty associated with multiple imputation is captured when applying bootstrapping techniques to generate cost–utility planes and acceptability curves due to the use of all 25 000 replications (5000 from each imputed data set).
The feasibility and implementation of a stratified management approach with matched treatment pathways is a necessary consideration. Training physiotherapists to use the prognostic screening tool and deliver the systematic targeted treatments incur costs due to the time commitments of trainers, trainees and mentors. Capacity constraints are also relevant, particularly with regard to the numbers of physiotherapists with the training and expertise to deliver the high-risk treatment package. However, expected cost savings attributable to the health service and society (through reduced healthcare consumption and fewer periods of work absence) are likely to provide considerable scope to accommodate such costs. In addition, evidence from observational data suggests that the proportion of low-risk patients (the risk group associated with the largest mean cost savings, see table 1) is greater in routine primary care than in a controlled trial environment.42 Further research is ongoing to determine whether a similar stratified approach is operable and sustainable within everyday primary care with general practitioners and physiotherapists.43
Concluding comments
Within each risk-defined subgroup of low back pain patients in primary care, a management approach combining prognostic screening and treatment targeting provides substantial economic benefits compared with current best practice. The magnitude of observed differences in health benefits and back pain-related costs suggests that the results are generalisable to other settings, although caution is advised when considering the external validity of any within-trial findings. Research regarding the provision of targeted treatments for back pain is at an early stage and challenges exist with regard to the feasibility of implementation and effective delivery of this new management system.
Acknowledgments
We would like to thank all the participants, general practices and NHS physiotherapy services who participated in the randomised controlled trial (STarT Back Trial ISRCTN37113406). We also wish to thank NHS Stoke and North Staffordshire who hosted the conduct of the study, and the North Staffordshire Primary Care Research Consortium and the primary care delivery arm of West Midlands North CLRN for their service support funding. In addition, we thank colleagues at the Arthritis Research UK Primary Care Centre (Professor Peter Croft, Professor Krysia Dziedzic, Professor Nadine Foster and Dr Sue Jowett) and Professor Jo Coast (Health Economics Facility, University of Birmingham (UK)) for their valuable comments on the manuscript.
Footnotes
Contributors: DGTW was the lead economist on the project, responsible for the design and analysis of the study and the original drafting of the report. SB provided additional health economic support. ML was the study statistician. JCH led the development of the Keele STarT Back Screening Tool and matched treatment pathways. EMH was the chief investigator and grant holder of the trial. All authors contributed to the interpretation of results and drafting of the report and have approved the final version.
Funding: Arthritis Research UK.
Correction notice: This article has been corrected since it was published Online First.
Competing interests: None.
Ethics approval: North Staffordshire Local Research Ethics Committee.
Provenance and peer review: Not commissioned; externally peer reviewed.
Data sharing statement: Data sharing possibilities are currently being discussed within the research team.
References
- 1.Maniadakis N, Gray A. The economic burden of back pain in the UK. Pain 2000;84:95–103 [DOI] [PubMed] [Google Scholar]
- 2.Buchbinder R, Pransky G, Hayden J. Recent advances in the evaluation and management of nonspecific low back pain and related disorders. Best Pract Res Clin Rheumatol 2010;24:147–53 [DOI] [PubMed] [Google Scholar]
- 3.Costa-Black KM, Loisel P, Anema JR, et al. Back pain and work. Best Pract Res Clin Rheumatol 2010;24:227–40 [DOI] [PubMed] [Google Scholar]
- 4.Dagenais S, Caro J, Haldeman S. A systematic review of low back pain cost of illness studies in the United States and internationally. Spine J 2008;8:8–20 [DOI] [PubMed] [Google Scholar]
- 5.UK BEAM Trial Team United Kingdom back pain exercise and manipulation (UK BEAM) randomised trial: effectiveness of physical treatments for back pain in primary care. BMJ 2004;329:1377. [DOI] [PMC free article] [PubMed] [Google Scholar]
- 6.Hay EM, Mullis R, Lewis M, et al. Comparison of physical treatments versus a brief pain-management programme for back pain in primary care: a randomised clinical trial in physiotherapy practice. Lancet 2005;365:2024–30 [DOI] [PubMed] [Google Scholar]
- 7.Jellema P, van der Windt DA, van der Horst HE, et al. Should treatment of (sub)acute low back pain be aimed at psychosocial prognostic factors? Cluster randomised clinical trial in general practice. BMJ 2005;331:84. [DOI] [PMC free article] [PubMed] [Google Scholar]
- 8.Cherkin DC, Sherman KJ, Avins AL, et al. A randomized trial comparing acupuncture, simulated acupuncture, and usual care for chronic low back pain. Arch Intern Med 2009;169:858–66 [DOI] [PMC free article] [PubMed] [Google Scholar]
- 9.Lamb SE, Hansen Z, Lall R, et al. Group cognitive behavioural treatment for low-back pain in primary care: a randomised controlled trial and cost-effectiveness analysis. Lancet 2010;375:916–23 [DOI] [PubMed] [Google Scholar]
- 10.Bronfort G, Haas M, Evans RL, et al. Efficacy of spinal manipulation and mobilization for low back pain and neck pain: a systematic review and best evidence synthesis. Spine J 2004;4:335–56 [DOI] [PubMed] [Google Scholar]
- 11.Chou R, Huffman LH. Nonpharmacologic therapies for acute and chronic low back pain: a review of the evidence for an American Pain Society/American College of Physicians clinical practice guideline. Ann Intern Med 2007;147:492–504 [DOI] [PubMed] [Google Scholar]
- 12.Hay EM, Dunn KM, Hill JC, et al. A randomised clinical trial of subgrouping and targeted treatment for low back pain compared with best current care. The STarT Back Trial Study Protocol. BMC Musculoskelet Disord 2008;9:58. [DOI] [PMC free article] [PubMed] [Google Scholar]
- 13.Hill JDGT, Whitehurst Lewis M, et al. Comparison of stratified primary care management for low back pain with current best practice (STarT Back): a randomised controlled trial. Lancet 2011;378:1560–71 [DOI] [PMC free article] [PubMed] [Google Scholar]
- 14.UK BEAM Trial Team United Kingdom back pain exercise and manipulation (UK BEAM) randomised trial: cost effectiveness of physical treatments for back pain in primary care. BMJ 2004;329:1381. [DOI] [PMC free article] [PubMed] [Google Scholar]
- 15.Whitehurst DG, Lewis M, Yao GL, et al. A brief pain management program compared with physical therapy for low back pain: results from an economic analysis alongside a randomized clinical trial. Arthritis Rheum 2007;57:466–73 [DOI] [PubMed] [Google Scholar]
- 16.Rivero-Arias O, Gray A, Frost H, et al. Cost-utility analysis of physiotherapy treatment compared with physiotherapy advice in low back pain. Spine 2006;31:1381–7 [DOI] [PubMed] [Google Scholar]
- 17.Ratcliffe J, Thomas KJ, MacPherson H, et al. A randomised controlled trial of acupuncture care for persistent low back pain: cost effectiveness analysis. BMJ 2006;333:626. [DOI] [PMC free article] [PubMed] [Google Scholar]
- 18.Savigny P, Kuntze S, Watson P, et al. Low back pain: early management of persistent non-specific low back pain. Full guideline. London: National Collaborating Centre for Primary Care and Royal College of General Practitioners, 2009 [PubMed] [Google Scholar]
- 19.Claxton K. The irrelevance of inference: a decision-making approach to the stochastic evaluation of health care technologies. J Health Econ 1999;18:341–64 [DOI] [PubMed] [Google Scholar]
- 20.Briggs AH, O'Brien BJ. The death of cost-minimization analysis? Health Econ 2001;10:179–84 [DOI] [PubMed] [Google Scholar]
- 21.Brooks R. EuroQol: the current state of play. Health Policy 1996;37:53–72 [DOI] [PubMed] [Google Scholar]
- 22.Dolan P, Gudex C, Kind P, et al. A social tariff for EuroQol: results from a UK general population survey. York: Centre for Health Economics (Discussion Paper No 138), 1995 [Google Scholar]
- 23.Curtis L. Unit Costs of Health and Social Care 2009. Canterbury: Personal Social Services Research Unit, University of Kent, 2009
- 24.NHS Executive National Schedule of Reference Costs 2008. London: Department of Health, 2009 [Google Scholar]
- 25.Castelnuovo E, Cross P, Mt-Isa S, et al. Cost-effectiveness of advising the use of topical or oral ibuprofen for knee pain; the TOIB study (ISRCTN: 79353052). Rheumatology (Oxford) 2008;47:1077–81 [DOI] [PubMed] [Google Scholar]
- 26.Wright M, Grieve R, Roberts J, et al. Health benefits of antiviral therapy for mild chronic hepatitis C: randomised controlled trial and economic evaluation. Health Technol Assess 2006;10:1–113 [DOI] [PubMed] [Google Scholar]
- 27.NHS Executive National Schedule of Reference Costs, 2004. London: Department of Health, 2005 [Google Scholar]
- 28.British Medical Association, Royal Pharmaceutical Society of Great Britain British National Formulary. 55th ed London: BMJ Books, 2008 [Google Scholar]
- 29.Annual survey of hours and earnings (ASHE). London: Office for National Statistics, 2008. http://www.statistics.gov.uk/StatBase/Product.asp?vlnk=15187 (accessed 14 April 2010).
- 30.Sculpher M. The role of productivity costs. In: Drummond MF, Maguire A, eds. Economic evaluation in health care: merging theory and practice. New York: Oxford University Press, 2001:94–112 [Google Scholar]
- 31.Office for National Statistics Standard occupational classification 2000: Vol 2. The coding index. London: The Stationery Office, 2000 [Google Scholar]
- 32.Rubin DB. Multiple Imputation for Nonresponse in Surveys. New York: Wiley, 1987 [Google Scholar]
- 33.Roland M, Morris R. A study of the natural history of back pain. Part I: development of a reliable and sensitive measure of disability in low-back pain. Spine 1983;8:141–4 [DOI] [PubMed] [Google Scholar]
- 34.Manca A, Hawkins N, Sculpher MJ. Estimating mean QALYs in trial-based cost-effectiveness analysis: the importance of controlling for baseline utility. Health Econ 2005;14:487–96 [DOI] [PubMed] [Google Scholar]
- 35.Fenwick E, Claxton K, Sculpher M. Representing uncertainty: the role of cost-effectiveness acceptability curves. Health Econ 2001;10:779–87 [DOI] [PubMed] [Google Scholar]
- 36.Thompson SG, Barber JA. How should cost data in pragmatic randomised trials be analysed? BMJ 2000;320:1197–200 [DOI] [PMC free article] [PubMed] [Google Scholar]
- 37.National Institute for Health and Clinical Excellence Guide to the Methods of Technology Appraisal. London: National Institute for Health and Clinical Excellence; 2008 [PubMed] [Google Scholar]
- 38.Goldman D, Lakdawalla D, Philipson TJ, et al. Valuing health technologies at NICE: recommendations for improved incorporation of treatment value in HTA. Health Econ 2010;19:1109–16 [DOI] [PubMed] [Google Scholar]
- 39.Hollinghurst S, Sharp D, Ballard K, et al. Randomised controlled trial of Alexander technique lessons, exercise, and massage (ATEAM) for chronic and recurrent back pain: economic evaluation. BMJ 2008;337:a2656. [DOI] [PMC free article] [PubMed] [Google Scholar]
- 40.Petrou S, Murray L, Cooper P, et al. The accuracy of self-reported healthcare resource utilization in health economic studies. Int J Technol Assess Health Care 2002;18:705–10 [DOI] [PubMed] [Google Scholar]
- 41.Grøvle L, Haugen AJ, Keller A, et al. Poor agreement found between self-report and a public registry on duration of sickness absence. J Clin Epidemiol 2012;65:212–8 [DOI] [PubMed] [Google Scholar]
- 42.Hill JC, Dunn KM, Lewis M, et al. A primary care back pain screening tool: identifying patient subgroups for initial treatment. Arthritis Rheum 2008;59:632–41 [DOI] [PubMed] [Google Scholar]
- 43.Foster NE, Mullis R, Young J, et al. IMPaCT Back study protocol. Implementation of subgrouping for targeted treatment systems for low back pain patients in primary care: a prospective population-based sequential comparison. BMC Musculoskelet Disord 2010;11:186. [DOI] [PMC free article] [PubMed] [Google Scholar]