

Abstract
Objective
Misalignment of the Stratus optical coherence tomograph scan circle placed by the operator around the optic nerve head (ONH) during each retinal nerve fiber layer (RNFL) examination can affect the instrument reproducibility and its theoretical ability to detect true structural changes in the RNFL thickness over time. We evaluated the effect of scan circle placement on RNFL measurements.
Design
Observational clinical study.
Methods
Sixteen eyes of 8 normal participants were examined using the Stratus optical coherence tomograph Fast RNFL thickness acquisition protocol (software version 4.0.7; Carl Zeiss Meditec, Dublin, CA). Four consecutive images were taken by the same operator with the circular scan centered on the optic nerve head. Four images each with the scan displaced superiorly, inferiorly, temporally, and nasally were also acquired. Differences in average and sectoral RNFL thicknesses were determined. For the centered scans, the coefficients of variation (CV) and the intraclass correlation coefficient for the average RNFL thickness measured were calculated.
Results
When the average RNFL thickness of the centered scans was compared with the average RNFL thickness of the displaced scans individually using analysis of variance with post-hoc analysis, no difference was found between the average RNFL thickness of the nasally (105.2 μm), superiorly (106.2 μm), or inferiorly (104.1 μm) displaced scans and the centered scans (106.4 μm). However, a significant difference (analysis of variance with Dunnett's test: F = 8.82, P<0.0001) was found between temporally displaced scans (115.8 μm) and centered scans. Significant differences in sectoral RNFL thickness measurements were found between centered and each displaced scan. The coefficient of variation for average RNFL thickness was 1.75% and intraclass correlation coefficient was 0.95.
Conclusions
In normal eyes, average RNFL thickness measurements are robust and similar with significant superior, inferior, and nasal scan displacement, but average RNFL thickness is greater when scans are displaced temporally. Parapapillary scan misalignment produces significant changes in RNFL assessment characterized by an increase in measured RNFL thickness in the quadrant in which the scan is closer to the disc, and a significant decrease in RNFL thickness in the quadrant in which the scan is displaced further from the optic disc.
Keywords: imaging, stratus optical coherence tomography, retinal nerve fiber layer thickness, reproducibility
The Stratus optical coherence tomograph (OCT) provides high resolution cross-sectional images of the retina and the optic nerve head (ONH) to assist clinicians in assessing glaucomatous structural damage.1 Numerous studies using previous and current versions of the OCT have demonstrated its ability to detect retinal nerve fiber layer (RNFL) thickness damage in glaucomatous eyes2–9 in agreement with red free RNFL photographs and visual fields.10–14
Several studies have reported good reproducibility of RNFL measurements using the Stratus OCT (software version 4.0.7; Carl Zeiss Meditec, Dublin, CA) in normal and glaucomatous eyes,15–17 and the measurements in the nasal quadrant are the most variable.15 The possible source of this variability has not been systematically studied, with limited documentation of scan alignment variability as one of the possible variance components affecting the inter-visit reproducibility.16
A limitation of the OCT for detecting RNFL change over time is its reliance on an operator to consistently center the scan circle during each follow-up examination. Although the landmark feature (placing a landmark on a branched vessel to be recorded by the instrument for further visits) can be used to improve the operator's ability to consistently center the scan circle around the optic disc, the video image documenting the scan circle placement is recorded after the OCT scan is completed. Moreover, automated registration of OCT scans is not available. Therefore, changes in the placement of the scan circle may influence RNFL thickness measurements, and the accurate detection of RNFL thinning, particularly in the 4 quadrants (superior, inferior, temporal, and nasal) and clock hour sectors.
For instance, it is known that as ganglion cell fibers converge from all around the eye onto the optic disc, the NFL becomes rapidly thicker near the disc.18 It is possible that poorly centered scans obtained over time could result in apparent localized RNFL thinning in regions that are acquired further away from the disc.
The goal of this study was to evaluate the effect of circle misalignment around the ONH on RNFL thickness measurements using the Stratus OCT. In particular, we investigated whether average and sectoral RNFL thickness measurements are significantly affected by incorrect circle alignment around the ONH at the time of the imaging.
METHODS
Sixteen eyes of 8 normal participants (5 women, mean age 38.5 ± 9.7 years) were evaluated. All participants in this observational clinical study were evaluated at the Hamilton Glaucoma Center, University of California, San Diego (UCSD).
Informed consent was obtained from each participant and the UCSD Human Subjects Committee approved all methodology.
All methods adhered to the Declaration of Helsinki for research involving human participants and the Health Insurance Portability and Accountability Act (HIPAA).
All participants underwent a complete ophthalmic examination including review of medical history, slit-lamp biomicroscopy, intraocular pressure (IOP) measurement, dilated stereoscopic fundus examination using a 78-D lens, stereoscopic optic disc photography, and standard automated perimetry using the 24-2 Swedish Interactive Threshold Algorithm (Humphrey visual field analyzer, Carl Zeiss Meditec) as part of the Diagnostic Innovations in Glaucoma Study (DIGS), a prospective longitudinal study designed to evaluate optic nerve structure and visual function in glaucoma. All eyes had best-corrected visual acuity of 20/40 or better, sphere within ± 5.0 diopters and cylinder within ± 3.0 diopters, open angle at gonioscopy with IOPs of 22 mmHg or less, no history of increased IOP and a normal visual field result. A normal visual field was defined as a pattern standard deviation within the 95% normal confidence limits and Glaucoma Hemifield Test results within normal limits. All eyes had a healthy appearance of the optic disc and RNFL (no diffuse or focal rim thinning, glaucomatous cupping, RNFL defects, or myelinated NFL), as evaluated by optic disc photographs. Both eyes of one participant showed presence of a small crescent of parapapillary atrophy in the temporal sector.
Instrumentation
The Stratus OCT is a noninvasive diagnostic imaging device that obtains cross-sectional images of ocular microstructures.1–17 For this study, the Fast RNFL thickness acquisition protocol using the Stratus OCT (software version 4.0.7; Carl Zeiss Meditec, Dublin CA) was used without pupil dilation. Participants with pupil diameter less than 3 mm in one or both eyes or whose OCT images were not of adequate quality (see below) were not included in the study.16,19
For the Fast RNFL, a total of 3 scans are acquired consecutively using a circle with a standardized diameter of 3.4 mm. An automated computer algorithm delineates the anterior and posterior margins of the NFL. The NFL thickness is measured by the Stratus OCT by assessing a total of 768 data points between the lines defining the NFL. Scans with signal strength less than 7 were not included. In addition, criteria for determining scan quality as reported in previous studies were followed15: the fundus image must be clear enough for the optic disc and the scan circle to be seen, color saturation must be even and dense throughout the entire scan and red color visible in the retinal pigment epithelium, and RNFL must be visible with no missing or blank areas within the scan pattern. Measurements were performed on the same day. Internal fixation was used for all scans.
Four consecutive measurements were obtained by the same experienced operator (G.V.) with the circular scan centrally placed around the ONH. A second experienced operator (technician) assessed each scan for quality and verified that the optic disc was adequately centered or focused within the circular scan. Both operators are UCSD Imaging Data Evaluation and Analysis Center certified for taking OCT images. Four measurements each with the circular scan displaced superiorly, inferiorly, temporally, and nasally were also acquired. These scans were purposely displaced from the previous centered scan so that the scan circle approached the optic disc margin when looking at the fundus image during the image acquisition process (Fig. 1).
FIGURE 1.

Schematic representation of the Fast RNFL circle scans taken around the optic nerve head in OD. The same technique has been applied in OS in the corresponding sectors.
The operator ensured that the scan circle approached the ONH without touching its margin to approximate the same amount of displacement shown in Figure 1 in all eyes. RNFL thickness measurements on average, by quadrant (superior, inferior, nasal, and temporal) and by clock hour (with the 9 o'clock hour conventionally chosen to be temporal) were recorded for analysis.
In a subset of 2 eyes of 2 individuals, the extent of scan circle displacement from the centered scan position was estimated by using the Stratus OCT coordinate system that is provided during image acquisition process. The position of the fixation point, landmark and circle scan visible on the acquisition screen representing the fundus image of the eye are given in x/y coordinates. The x axis represents shifts along the horizontal line (temporal-nasal) and the y axis represents shifts along the vertical line (superior-inferior). For each approximately 10 μm movement of the circle scan along the x-y axis, new x-y coordinates are generated and provided on the screen corresponding to x and/or y shifts of 0.01 pixels. After acquiring a properly centered scan, the x-y coordinates were recorded. The scan circle was then progressively shifted nasally by 0.10 pixel units on the x axis to acquire a series of images with each scan circle separated by about 100 μm along the horizontal axis. The same procedure was applied to the temporal side and along the vertical axis for the superior and inferior sectors. The average RNFL thickness parameter measured at each shift of 0.10 pixel units was plotted along the horizontal and the vertical axis (Figs. 2A, B).
FIGURE 2.

A, Average RNFL thickness of each 10 pixel horizontal shift from center (x = 0) for 2 eyes (average). Negative values are temporal shifts and positive values are nasal shifts. Average RNFL thickness increases with temporal shifts and decreases with nasal shifts. B, Average RNFL thickness of each 10 pixel vertical shift from center (y = 0) for 2 eyes (average). Negative values are superior shifts and positive values are inferior shifts. Average RNFL remains relatively unchanged for shifts along the vertical axis.
In addition, to determine the influence of disc size on OCT RNFL thickness measurements, optic disc area was obtained for each eye by the use of confocal scanning laser ophthalmoscopy (Heidelberg Retina Tomograph II; Heidelberg Engineering, GmBH, Dossenheim, Germany). Detailed description of the instrument can be found elsewhere.20 Three 15-degree field-of-view scans, centered on the optic disc and judged to be of acceptable quality by a trained technician were obtained for each tested eye. A mean topography image of these 3 scans was automatically created by the instrument software (version 1.4.1.5). A trained technician outlined the optic disc margin on the mean image while viewing simultaneous stereoscopic photographs of the optic disc. Only well-focused, evenly illuminated, and centered scans with an SD less than 50 μm were used.
Statistical Analysis
The hypothesis that no significant variations in the average RNFL thickness would occur between centered and displaced scans because variations in sectoral RNFL would be compensated by corresponding changes in the opposite sector was tested. After checking for homogeneity of variance using the Levene's test, differences in average RNFL thickness were assessed using paired t test for comparing the average RNFL thickness in centered scans versus the average of the superior, inferior, nasal, and temporal displaced scans combined. Subsequently, differences in average RNFL thickness and each sector-based RNFL parameters were evaluated in one-way analysis of variance (ANOVA) with Dunnett's test for post-hoc analysis of pairwise comparisons. For the Dunnett's test, the mean of the centered scans was used as the control mean.
The intratest variability for the Fast RNFL thickness protocol was also assessed by estimating the coefficient of variation (CV) and the intraclass correlation coefficient (ICC) for the scans centered around the ONH. The statistical analysis was performed using JMP version 6.1 software (SAS Institute, Cary, North Carolina, USA). A P value less than 0.05 was considered statistically significant.
RESULTS
Table 1 shows the mean RNFL thickness [95% confidence interval (CI)] for the centered and displaced scans. No significant difference in the average RNFL thickness was found between centered scans (106.4 μm) and the average of the displaced scans combined (107.8 μm) using paired t test (P = 0.13). When the average RNFL thickness of the centered scans was compared with the average RNFL thickness of the displaced scans individually using ANOVA with post-hoc analysis, no difference was found between the average RNFL thickness of the nasally (105.2 μm), superiorly (106.2 μm), or inferiorly (104.1 μm) displaced scans and the centered scans. However, a significant difference (ANOVA with Dunnett's test: F = 8.82, P<0.0001) was found between temporally displaced scans (115.8 μm) and centered scans (106.4 μm).
Table 1.
Average RNFL Thickness Measurements for Centered and Displaced Scans
| Centered Scans (RNFL in μm) | Displaced Scans (RNFL in μm) | P |
|---|---|---|
| 106.4 (104.9–107.9) | Combined: 107.8 (105.8–109.9) | 0.13* |
| Superior: 106.2 (102.7–109.7) | 0.91** | |
| Inferior: 104.1 (100.9–107.4) | 0.20** | |
| Nasal: 105.2 (101.8–108.7) | 0.51** | |
| Temporal: 115.8 (111.5–120.1) | <0.0001** |
All data are given as the mean with 95% CI in parentheses.
Paired t-test against centered scans.
Dunnet's test for post-hoc analysis.
The increase in average RNFL thickness with temporal displacement was also confirmed in a subset of 2 eyes (Fig. 2A), where progressive temporal displacements along the x axis resulted in consistent increases in average RNFL thickness. In contrast, no change in RNFL thickness was observed when the scan was displaced along the y axis (vertical) (Fig. 2B).
The CV and ICC of the centered scans for assessing the intratest variability of the average RNFL thickness parameter were 1.75% and 0.95 (lower 95% CI = 0.92), respectively, indicating that the measurements were reproducible.
Table 2 shows the mean (95% CI) RNFL thickness in microns for the superior, inferior, nasal, and temporal sectors for the centered and displaced scans. In general, significant differences in some sector RNFL measurements were found with each type of scan displacement with the nasally displaced scan showing statistically significant differences in all sectors. Predictably, superior and inferior RNFL thickness values changed most when the scan was displaced along the superior and inferior axis, whereas temporal and nasal RNFL thickness values changed most when the scan was displaced along the horizontal axis (Figs. 3, 4). As expected, when the scan circle moved closer to the disc margin, the RNFL thickness increased. For example, the superior RNFL thickness increased from 133.7 μm when centered to 152.9 μm when displaced inferiorly.
Table 2.
Sectors RNFL Thickness Measurements for Centered and Displaced Scans
| Centered Scans | Displaced Superior | P* | Displaced Inferior | P* | Displaced Nasal | P* | Displaced Temporal | P* | |
|---|---|---|---|---|---|---|---|---|---|
| Superior sector | 133.7 (131.0–136.3) | 106.3 (94.4–118.1) | <0.0001 | 152.9 (137.8–168.1) | <0.0001 | 123.4 (118.4–128.4) | <0.05 | 132.7 (126.3–139.1) | 0.93 |
| Temporal sector | 75.6 (73.0–78.2) | 78.8 (72.1–85.4) | 0.78 | 80.8 (75.4–86.1) | 0.35 | 122.8 (113.5–132.2) | <0.0001 | 49.2 (46.1–52.3) | <0.0001 |
| Inferior sector | 134.8 (131.6–138.0) | 156.5 (141.0–172.0) | <0.0001 | 108.2 (96.5–119.9) | <0.0001 | 118.3 (111.3–125.3) | <0.05 | 142.9 (135.1–150.6) | 0.31 |
| Nasal sector | 81.5 (78–84.1) | 83.4 (76.6–90.3) | 0.96 | 74.6 (68.6–80.7) | 0.17 | 56.3 (51.6–60.9) | <0.0001 | 138.6 (127.7–149.6) | <0.0001 |
All data are given in microns as the mean with 95% CI in parentheses.
Dunnet's test with centered scans used as control mean.
FIGURE 3.
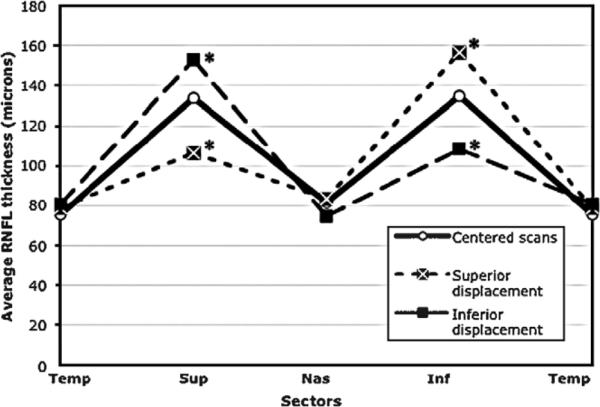
Double hump profile pattern for centered scans and scans displaced superiorly and inferiorly. *Sectors significantly changed compared with centered scans.
FIGURE 4.
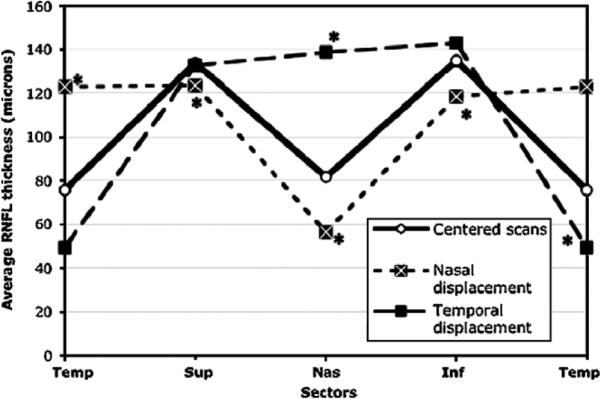
Double hump profile pattern for centered scans and scans displaced nasally and temporally. *Sectors significantly changed compared with centered scans.
To better evaluate the change in average RNFL thickness with temporal displacement, the superior and inferior sectors of the temporally and nasally displaced scans were compared with centered scans using ANOVA and Dunnett's test. For the superior sector, although no significant difference was found for the temporally displaced scan (P = 0.93), the nasally displaced RNFL thickness was significantly reduced (123.4 μm) compared with centered scans (133.7 μm, F = 6.13, P<0.05). Similar results were found for the nasally displaced RNFL with regard to the inferior sector (118.3 μm) showing thinner RNFL than the centered inferior sector scan (134.8 μm, F = 14.8, P<0.05). Conversely, the temporally displaced scan showed an average increase in inferior thickness of 6.1% compared with centered scans (142.9 and 134.8 μm, respectively).
The hypothesis was tested that the RNFL thickness increases in the sector closer to the disc and decreases in the opposite one so that the mean RNFL thickness of the 2 sectors may not change. The nasal and temporal sectors were examined on the horizontal axis by comparing the mean RNFL from the two sectors (nasal+temporal/2) in the centered scans and in the temporally and nasally displaced ones. After applying ANOVA and Dunnett's test, results showed a significant increase (F = 14.95, P<0.0001) in the mean for the displaced scans with the temporally displaced one showing the greater increase in thickness (+19.5% vs. +13.9%). In contrast, when the same analysis was carried out on the vertical axis by comparing the mean RNFL from the superior and inferior sectors (superior+inferior/2) in the centered scans and in the superiorly and inferiorly displaced ones, no statistically significant differences were found (134.2 vs. 131.4 and 130.6 μm respectively, F = 1.87, P = 0.16).
The average optic disc size measured using the Heidelberg Retina Tomograph was 2.15 ± 0.54 mm2. Differences in the measurements between centered and displayed scans remained significant (P<0.0001) after controlling for ONH size in multivariate analyses (data not shown).
A separate analysis was also conducted after excluding the 2 eyes with parapapillary atrophy; similar results to the ones described above were obtained for average and sectoral RNFL thickness in centered and displaced scans. Specifically, in the 2 eyes with parapapillary atrophy, a similar trend to the other eyes was observed with the average RNFL thickness increasing from 95.74 μm in OD and 92.75 μm in OS for the centered scans to 104.19 μm in OD and 101.87 μm in OS for the temporally displaced scans.
Figure 5 illustrates hypothetical diagnostic errors that could result from improper scan alignment. On the basis of these suggestions, when a sectoral RNFL thickness decrease is detected over time, the average RNFL thickness should be checked along with the other sectors measurements to determine the likelihood that such a change is real. If the average RNFL thickness is increased, a temporal shift of the scan at the follow-up visit compared with baseline might have occurred. In the presence of a coexisting decrease in the average RNFL thickness, a true change in the sectoral RNFL thickness may be likely if repeatable, although a false change may also be indicated if the baseline scan was displaced temporally. In contrast, when the average RNFL thickness is unchanged at follow-up and increased thickness is detected in the opposite sector, a true sectoral change is very unlikely as shifts along the vertical axis could be exclusively responsible for this finding.
FIGURE 5.
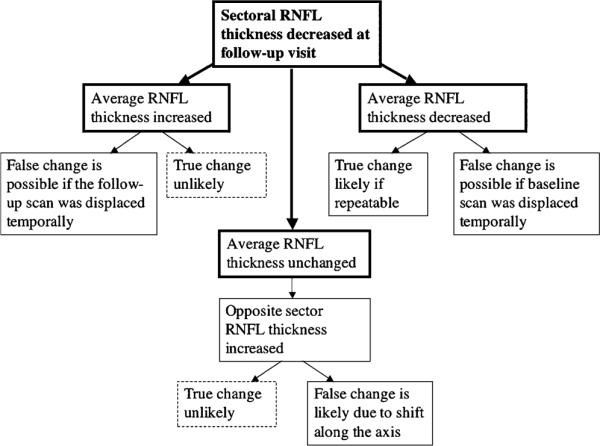
Flowchart of the hypothetical spectrum of events that could imply false RNFL estimates owing to improper scan alignment. Careful overall assessment of sectoral and average OCT RNFL parameters can help identify scan alignment issues. Note: results are based on a limited sample of healthy eyes.
Figure 6A provides an example of a sample RNFL scan with scan circle displacement occurring along the vertical axis and superimposed RNFL double hump profile patterns resulting from centered and displaced scans. Apparent sectoral thinning is visible in the displaced scans although the opposite sectoral RNFL thickness is markedly increased. Similarly, for the same eye, Figure 6B shows the double hump profile patterns from scans displaced along the horizontal axis. The average RNFL thickness is increased in the temporally displaced scan.
FIGURE 6.


A, Sample RNFL scan with displacement occurring along the vertical axis. The superimposed RNFL double hump profile patterns show apparent sectoral thinning in the displaced scans (bottom 2 scans) compared with the centered scan (top scan) whereas the opposite sectoral RNFL thickness is increased. The average RNFL thickness remains relatively unchanged. B, Sample RNFL scans with displacement occurring along the horizontal axis. The average RNFL thickness is increased in the temporally displaced scan (bottom scan), but did not increase in the nasally displaced scan (middle scan) compared with the centered scan (top scan).
DISCUSSION
These results in normal, healthy eyes, indicate that average RNFL thickness measurements using Stratus OCT are relatively robust, and that average RNFL thickness values are similar with the superior, inferior, and nasal scan displacement. However, when the scan circle for the Fast RNFL thickness was displaced temporally along the horizontal line, average RNFL thickness increased significantly compared with properly centered scans. Moreover, statistically significant differences among the RNFL thickness sectors were found when the scan circle was displaced regardless of direction. This suggests that observed sectoral changes attributed to disease progression over time could be due, in part, to scan displacement, particularly when the average RNFL thickness remains unchanged. For this study, operators carefully performed the acquisition and quality control of the scans to ensure that no eye movements occurred at the time of imaging. In a clinical setting, it may be difficult to determine which direction the scan displacement has occurred or if multiple shifts have occurred in different directions over time, as the video image of the scan circle is not recorded during the actual OCT scan acquisition but immediately after. Moreover, as physicians generally do not perform the scans themselves, caution should be exercised when interpreting RNFL thinning in specific sectors when there is an increase in RNFL in the opposite sector.
Figure 5 suggests that overall analysis of sectors and average RNFL thickness be performed together before evidence of sectoral RNFL thinning is confirmed. However, these results are based upon on a limited data set of healthy eyes. Further studies with more extensive analyses including glaucomatous eyes are warranted. It is likely that requiring repeatable change in multiple scans can increase the likelihood that RNFL change has occurred, and it is not due to the effects of scan misalignment.
These results also confirm that the RNFL thickness pattern behaves differently along the horizontal and vertical axis. Temporal or nasal shifts along the horizontal line seem to produce an increased thickness in the overall nasal and temporal sectors compared with centered scans as demonstrated by the mean of the 2 sectors together (nasal+temporal/2). However, when the scan is displaced nasally, the RNFL thickness in the superior and inferior sectors decreases, resulting in similar average RNFL thickness to that of the centered scans. In contrast, when the scan is displaced temporally, the RNFL thickness is unchanged superiorly and increased inferiorly, temporally, and nasally compared with centered scans resulting in increased global average RNFL thickness, (although the increase in the inferior RNFL was not statistically significant). These results can be attributed, at least in part, to the difference in the topographic organization of the RNFL within each sector (the scan circle displaced temporally may be intercepting the relatively thick superior and inferior arcuate axon bundles and the papillomacular bundle on the temporal horizontal meridian).
The finding of an increased average RNFL thickness in the temporally displaced scans compared with centered scan was confirmed in the subset of 2 eyes used for multiple scans (Figs. 2A, B). This analysis showed that scan shifts of up to 300 μm along the x and the y axis may lie within the test-retest variability for the average RNFL thickness measurements (indicated by CV and ICC for the intratest variability of the centered scans) as reported by other reproducibility studies.15–17 However, these results must be interpreted cautiously because of the possible eye movements not accounted for during image acquisition process and errors owing to a magnification effect of the fundus image.
In this study, only healthy eyes were examined. However, misalignment of the circle scan is very likely to produce similar effects in glaucomatous eyes. This effect can occur over time as such eyes are followed long-itudinally for detecting progression by comparing results of multiple scans taken at different visits. Even in the presence of various glaucomatous RNFL patterns, the conclusions of this study are likely still applicable as long as a baseline scan is available for initial comparison. This study evaluated displacement only along the x and y axes, and did not investigate circle scan displacement for the full 360 degrees around the ONH.
The current study suggests that significant increases in average RNFL thickness can occur when the scan circle is improperly aligned temporally. This effect should be considered for Stratus OCT use in clinical care and future clinical longitudinal studies aimed to detect RNFL thinning over time in glaucomatous eyes. Currently, little evidence is present on the ability of the OCT to detect glaucomatous progression.21,22 On the basis of the results of this study, a false determination of average RNFL thinning will occur only if the baseline scan was obtained at a more temporal location than the follow-up scans. Improper alignment along the vertical axis should result in little change in average RFNL thickness. Nevertheless, it should be reminded that this study was done on relatively young, healthy participants who on average have more reproducible RNFL measurements.15
In conclusion, in normal eyes, average RNFL thickness measurements are similar with significant superior, inferior, and nasal scan displacement; however, temporal displacement produces increased average RNFL thickness. Parapapillary scan misalignment also produces significant changes in sectoral RNFL thickness. In particular, RNFL thickness increases in sectors closer to the disc and decreases in sectors further away from the disc. Clinicians should be aware of this effect when interpreting Stratus OCT RNFL thickness measurements to monitor glaucomatous progression.
Acknowledgments
Supported in part by NEI EY11008.
Footnotes
Disclosure/support: Gianmarco Vizzeri, none; Christopher Bowd, none; Felipe A. Medeiros, Carl Zeiss (F,R), Heidelberg Engineering (R); Linda M. Zangwill, Heidelberg Engineering (F), Carl Zeiss (F); RNW, Heidelberg Engineering (F,R), Carl Zeiss (F,R).
REFERENCES
- 1.Huang D, Swanson EA, Lin CP, et al. Optical coherence tomography. Science. 1991;254:1178–1181. doi: 10.1126/science.1957169. [DOI] [PMC free article] [PubMed] [Google Scholar]
- 2.Schuman JS, Hee MR, Puliafito CA, et al. Quantification of nerve fiber layer thickness in normal and glaucomatous eyes using optical coherence tomography. Arch Ophthalmol. 1995;113:586–596. doi: 10.1001/archopht.1995.01100050054031. [DOI] [PubMed] [Google Scholar]
- 3.Bagga H, Greenfield DS. Quantitative assessment of structural damage in eyes with localized visual field abnormalities. Am J Ophthalmol. 2004;137:797–805. doi: 10.1016/j.ajo.2003.11.060. [DOI] [PubMed] [Google Scholar]
- 4.Budenz DL, Michael A, Chang RT, et al. Sensitivity and specificity of the StratusOCT for perimetric glaucoma. Ophthalmology. 2005;112:3–9. doi: 10.1016/j.ophtha.2004.06.039. [DOI] [PubMed] [Google Scholar]
- 5.Medeiros FA, Zangwill LM, Bowd C, et al. Evaluation of retinal nerve fiber layer, optic nerve head, and macular thickness measurements for glaucoma detection using optical coherence tomography. Am J Ophthalmol. 2005;139:44–55. doi: 10.1016/j.ajo.2004.08.069. [DOI] [PubMed] [Google Scholar]
- 6.Brusini P, Salvetat ML, Zeppieri M, et al. Comparison between GDx VCC scanning laser polarimetry and Stratus OCT optical coherence tomography in the diagnosis of chronic glaucoma. Acta Ophthalmol Scand. 2006;84:650–655. doi: 10.1111/j.1600-0420.2006.00747.x. [DOI] [PubMed] [Google Scholar]
- 7.Sihota R, Sony P, Gupta V, et al. Diagnostic capability of optical coherence tomography in evaluating the degree of glaucomatous retinal nerve fiber damage. Invest Ophthalmol Vis Sci. 2006;47:2006–2010. doi: 10.1167/iovs.05-1102. [DOI] [PubMed] [Google Scholar]
- 8.Cheng HY, Huang ML. Discrimination between normal and glaucomatous eyes using Stratus optical coherence tomography in Taiwan Chinese subjects. Graefes Arch Clin Exp Ophthalmol. 2005;243:894–902. doi: 10.1007/s00417-005-1140-y. [DOI] [PubMed] [Google Scholar]
- 9.Medeiros FA, Zangwill LM, Bowd C, et al. Comparison of the GDx VCC scanning laser polarimeter, HRT II confocal scanning laser ophthalmoscope, and stratus OCT optical coherence tomograph for the detection of glaucoma. Arch Ophthalmol. 2004;122:827–837. doi: 10.1001/archopht.122.6.827. [DOI] [PubMed] [Google Scholar]
- 10.Jeoung JW, Park KH, Kim TW, et al. Diagnostic ability of optical coherence tomography with a normative database to detect localized retinal nerve fiber layer defects. Ophthalmology. 2005;112:2157–2163. doi: 10.1016/j.ophtha.2005.07.012. [DOI] [PubMed] [Google Scholar]
- 11.Bowd C, Zangwill LM, Medeiros FA, et al. Structure-function relationships using confocal scanning laser ophthalmoscopy, optical coherence tomography, and scanning laser polarimetry. Invest Ophthalmol Vis Sci. 2006;47:2889–2895. doi: 10.1167/iovs.05-1489. [DOI] [PubMed] [Google Scholar]
- 12.Hoffmann EM, Medeiros FA, Sample PA, et al. Relationship between patterns of visual field loss and retinal nerve fiber layer thickness measurements. Am J Ophthalmol. 2006;141:463–471. doi: 10.1016/j.ajo.2005.10.017. [DOI] [PubMed] [Google Scholar]
- 13.Racette L, Boden C, Kleinhandler SL, et al. Differences in visual function and optic nerve structure between healthy eyes of blacks and whites. Arch Ophthalmol. 2005;123:1547–1553. doi: 10.1001/archopht.123.11.1547. [DOI] [PubMed] [Google Scholar]
- 14.Shah NN, Bowd C, Medeiros FA, et al. Combining structural and functional testing for detection of glaucoma. Ophthalmology. 2006;113:1593–1602. doi: 10.1016/j.ophtha.2006.06.004. [DOI] [PubMed] [Google Scholar]
- 15.Budenz DL, Chang RT, Huang X, et al. Reproducibility of retinal nerve fiber thickness measurements using the Stratus OCT in normal and glaucomatous eyes. Invest Ophthalmol Vis Sci. 2005;46:2440–2443. doi: 10.1167/iovs.04-1174. [DOI] [PubMed] [Google Scholar]
- 16.Paunesco LA, Schuman JS, Price LL, et al. Reproducibility of nerve fiber layer thickness, macular thickness, and optic nerve head measurements using StratusOCT. Invest Ophthalmol Vis Sci. 2004;45:1716–1724. doi: 10.1167/iovs.03-0514. [DOI] [PMC free article] [PubMed] [Google Scholar]
- 17.Carpineto P, Ciancaglini M, Aharrh-Gnama A, et al. Custom measurement of retinal nerve fiber layer thickness using STRATUS OCT in normal eyes. Eur J Ophthalmol. 2005;15:360–366. doi: 10.1177/112067210501500308. [DOI] [PubMed] [Google Scholar]
- 18.Garcia-Valenzuela E, Mori M, Edward DP, et al. Thickness of the peripapillary retina in healthy subjects with different degrees of ametropia. Ophthalmology. 2000;107:1321–1327. doi: 10.1016/s0161-6420(00)00166-4. [DOI] [PubMed] [Google Scholar]
- 19.Savini G, Zanini M, Barboni P. Influence of pupil size and cataract on retinal nerve fiber layer thickness measurements by Stratus OCT. J Glaucoma. 2006;15:336–340. doi: 10.1097/01.ijg.0000212244.64584.c2. [DOI] [PubMed] [Google Scholar]
- 20.Zangwill LM, Medeiros FA, Bowd C, et al. Optic nerve imaging: recent advances. In: Grehn F, Stamper R, editors. Glaucoma. Springer; Verlag, Berlin: 2004. pp. 63–91. [Google Scholar]
- 21.Zangwill LM, Bowd C. Retinal nerve fiber layer analysis in the diagnosis of glaucoma. Curr Opin Ophthalmol. 2006;17:120–131. doi: 10.1097/01.icu.0000193079.55240.18. [DOI] [PubMed] [Google Scholar]
- 22.Bowd C. Optical coherence tomography for clinical detection and monitoring of glaucoma? Br J Ophthalmol. 2007;91:853–854. doi: 10.1136/bjo.2006.113100. [DOI] [PMC free article] [PubMed] [Google Scholar]