Abstract
We present geometry based design strategies for DNA nanostructures. The strategies have been implemented with GIDEON – a Graphical Integrated Development Environment for OligoNucleotides. GIDEON has a highly flexible graphical user interface that facilitates the development of simple yet precise models, and the evaluation of strains therein. Models are built on a simple model of undistorted B-DNA double-helical domains. Simple point and click manipulations of the model allow the minimization of strain in the phosphate-backbone linkages between these domains and the identification of any steric clashes that might occur as a result. Detailed analysis of 3D triangles yields clear predictions of the strains associated with triangles of different sizes. We have carried out experiments that confirm that 3D triangles form well only when their geometrical strain is less than 4% deviation from the estimated relaxed structure. Thus geometry-based techniques alone, without energetic considerations, can be used to explain general trends in DNA structure formation. We have used GIDEON to build detailed models of double crossover and triple crossover molecules, evaluating the non-planarity associated with base tilt and junction mis-alignments. Computer modeling using a graphical user interface overcomes the limited precision of physical models for larger systems, and the limited interaction rate associated with earlier, command-line driven software.
Keywords: GIDEON, geometrical molecular modeling, graphical user interface, DNA, DNA models, DNA tensegrity triangle, DNA double crossover, DNA triple crossover
INTRODUCTION
DNA based self-assembly has emerged as one of the premier techniques for the construction of complex nano-scale structures.1 The double helix itself is a fairly rigid structure, having a persistence length of about 500Å.2 Further, sticky-end cohesion can join duplexes in a sequence specific manner.1 After cohesion, the local product structure is essentially the same structure as a regular DNA duplex.3
Structural DNA Nanotechnology (SDN) emerged when methods were developed for constructing immobile, branched junctions – mostly immobile Holliday junctions,4 3-arm junctions,5 and bulged 3-arm junctions.6 It was hoped that these junctions could serve as motifs to assemble into larger organized networks. When it was observed that the junctions were quite flexible,5,7–8 however, novel strategies had to be developed to build well ordered arrays.
The general approach to constructing rigid motifs was to combine several individual junctions into a better-structured motif.8,9,10 As each junction was added to a structure, new geometric constraints were introduced which reduced the flexibility of the system, in some cases below the flexibility of the underlying DNA duplexes.11 At that point, geometrical modeling emerged as a primary concern in the design of SDN motifs. In 1985, a FORTRAN program was written to facilitate modeling self-assembled DNA branched structures.12 The orientation of this program was the use of virtual atoms, representing a polynucleotide by connected single backbone atoms, with struts connecting to the helix axis; this is the level of detail needed to model large nucleic acid constructs. This software was command line driven, with only line-drawn graphics available. The program never came into common usage, and when the computer platform was retired, the software was never ported to a modern system. Nucleic acid modeling programs, NAMOT13 and NAMOT2,14 were developed by Tung and Carter in the middle 1990's, but these programs have an all-atom orientation, containing more visual information than is easily handled by the molecular architect working on typical SDN scales. In 1988, a simple physical model method was developed from jacks and straws, with the aim of establishing and clarifying the topology of assembled structures.15 Both modeling methods were based on the same, highly simplified representation: The nucleotides were all perfectly uniform: The nucleosides were represented by radial struts going from the helix axis to the helix; the phosphate backbone of each nucleotide was represented by a helical segment that extended to the next nucleotide. Finally, along the helix axis, there was a strut separating each nucleotide pair from the ones stacked above and below it.
This simplified modeling approach proved highly useful. It was vital in the design of Double Crossover (DX) molecules, and facilitated the design of a wide variety of other motifs and nanomechanical devices.9,16–22 As larger and more complex SDN constructs are developed, however, the need for alternate methods of modeling has become apparent. Large physical models become distorted, and even unstable under their own weight, and they are not easily reduced below a size scale dictated by the jacks used to join the straws together. The distortions are particularly pronounced for the newer non-planar motifs that are being developed. Further, the construction of physical models becomes quite tedious, particularly if multiple variations on a large motif are needed for comparison.
To solve these problems, we have developed GIDEON, A Graphical Integrated Development Environment for OligoNucleotides. GIDEON provides a user-friendly Graphical User Interface (GUI) that allows straightforward construction and viewing of complex SDN models with ideal precision, free from gravitational distortion. GIDEON also has provision for precise numerical inputs that allow it to take advantage of any geometrical structural calculations or data, obtained prior to drawing the molecules. GIDEON’s outputs include simple picture files, stereoscopic images, movies, nucleotide coordinates, strand lists and base complementarity files. These latter make it an ideal front end for sequence generators, X-ray scattering calculations and other post-processing. We have used GIDEON to construct detailed models of a number of SDN motifs. We present here detailed analysis of DX and Triple Crossover (TX) molecules, illustrating the effects of base tilts. We also present a complete analysis of the geometry of 3D tensegrity triangles, developed by Mao and his colleagues,23 along with experimental evidence demonstrating the accuracy of the resulting structural predictions.
APPROACH
Analogous to the nature of SDN molecules being networks of nucleic acid strands, GIDEON uses linked arrays of data units to encapsulate specifications of a structure’s connectivity. The data units include nucleosides — sugar-base valence groups — and phosphates. Nucleoside sugars are rendered simply as a sphere with a protruding cylindrical segment, portraying the base (similar to the 1985 program12), and are interconnected by phosphates represented as segments. Each sphere is an icon of its nucleoside’s coordinates and assigned base, and segments – representing phosphodiester linkages – are created and deleted between spheres to define the connectivity of the nucleosides.
In addition to their visual comprehensibility, the virtual models produced with GIDEON have the advantage of a comprehensive internal data structure, defined as a hierarchy of logical data units. The hierarchy starts with nucleotides at the lowest rank. In addition to its positional coordinates, a nucleotide encapsulates other internal data, such as a reference to its Watson-Crick mate nucleotide, the assignment of its associated base (A, C, G, T) if desired, and the connectivity within its resident strand. A nucleotide, rendered as a sphere to represent its sugar, holds the logical assignment of the base. Strands and duplexes, defined while the user constructs the model, hold the next rank in the data hierarchy. A strand (data unit) maintains an array of linked nucleotides, and may be addressed as a single object to change its visibility and to organize the connectivity. Each phosphodiester linkage – rendered as a cylindrical segment – specifies the connectivity of the strands. Additional segments and spheres are distributed in a periodic fashion through the interior of a duplex to represent its stacked bases and helix axis. A duplex data unit encapsulates the stack of bases associated with the axial vertices and base segments, and may also be addressed as a single object for reconfiguration and analysis of a portion of a structure.
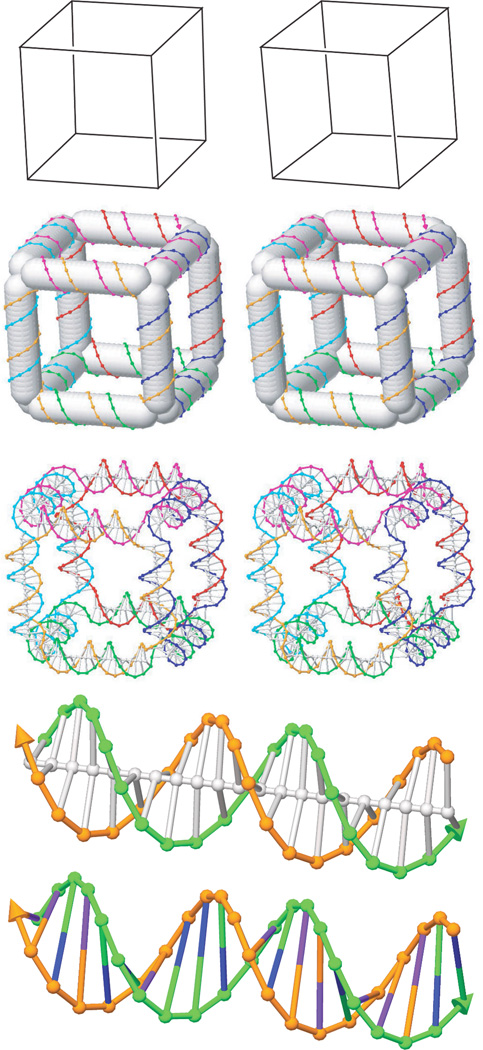
Figure 1 illustrates an SDN cube.24 The top row shows the abstract geometrical structure.12 The second row shows a stereoscopic GIDEON drawing of the cube with each duplex domain filled in with a cylinder to emphasize the overall geometric structure. The third row shows a stereoscopic drawing including the internal struts of the duplexes. The fourth row shows an enlarged view of one of the duplexes that makes up the cube, and the bottom row shows an alternate depiction of that same duplex without its central axis marked, with different bases having different colors, and the base pair represented as a straight line. The versatility of the graphical output modes eases both the design and the presentation of the structures.
Figure 1. A sample SDN structure: the cube.
The top three rows show stereoscopic images of a cube. 24 The top row is the abstract geometric shape. The second row shows the reinterpretation of the structure as a network of stiff rod-like edges of DNA duplexes.12 The third row shows the helical axes and base stacks. Row 4 shows an enlarged view of the near bottom duplex of the cube. Row 5 shows the same duplex without the helical axis, with the bases assigned different colors and shown as a single line spanning the helix.
When building SDN computer models without preliminary coordinate calculations, it is often difficult to align all the components perfectly. GIDEON has been equipped with a rudimentary relaxation algorithm that can help fit the elements of a construct together in a smooth and low-strain configuration. This relaxation process also can be used to get qualitative estimates of the strain expected for a given design.
Once the relaxation has begun, the structure will gradually rearrange itself to minimize mechanical strain according to user specifications. Each segment has a target length, set implicitly during construction, which defines its relaxed state. A tensile (or compressive) strain arises due to a difference – also termed an “error” – in a segment’s current length relative to its target length. During an iteration of the relaxation algorithm, two vectors calculated as a function of each segment’s orientation and length translate the segment endpoints. The vectors shorten or lengthen each segment to reduce its error.
A similar approach is taken to minimizing planar and torsional angular strains. A planar angle is defined by two segments with a common endpoint, and a torsion angle is defined by a linear chain of three segments joined end-to-end. Each segment and angle follows its own Proportional-Integral-Differential (PID) response function used to calculate its relaxation vectors; oscillations of the structure are damped during relaxation.25 Three coefficients set the response sensitivity of an angle or segment to proportional, integral or differential error terms, but no optimal set of coefficients has been derived. The default coefficients were established empirically, based on the relaxation of many different structures, but the user is given the option to adjust the coefficients as necessary during relaxation.
A relaxed structure may assume an unexpected conformation or reveal major internal strains that need to be resolved. GIDEON enables a simple and reliable approach to revising the structure to influence its relaxed conformation. Repositioning duplexes, adjusting the number of nucleotides between junctions, or changing the connectivity of the strands, along with subsequent relaxations, may be repeated until the desired conformation is obtained.
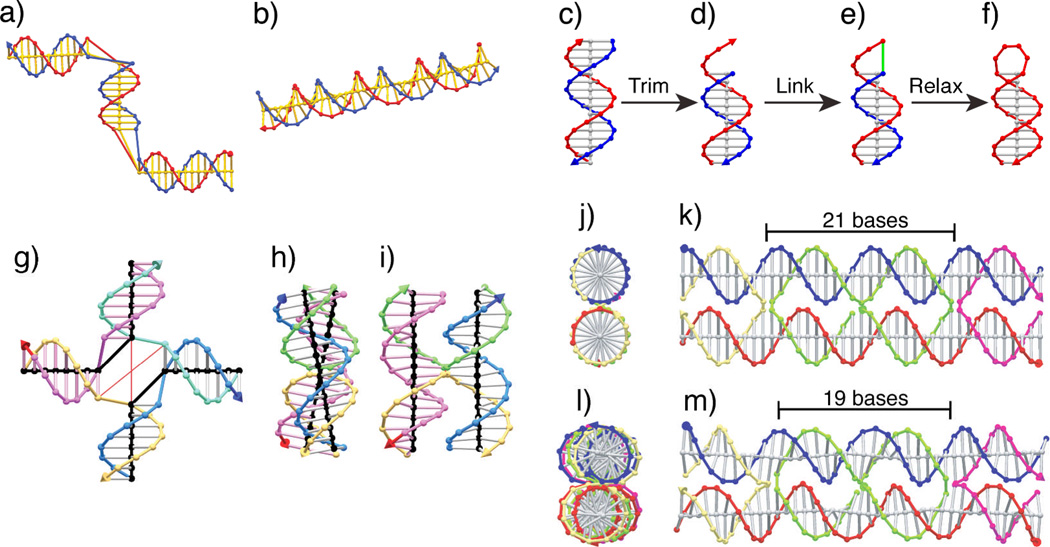
Figure 2 shows assorted uses of the relaxation capability. Panel a shows a duplex distorted by being bent twice, and b shows that duplex after relaxing overnight. Panels c through f show how a smooth hairpin loop can be constructed from a duplex by first removing one of the strands and the base stack, then linking the two strands together (f), and finally relaxing the loop for a few seconds to a smooth conformation. Panel g shows an unrelaxed 4-arm junction. The user indicates which arm is supposed to stack on which other arm by connecting the central axes (black). Even with this input, the system will not relax to the twisted anti-parallel conformation10 that such junctions are known to prefer, without additional user input. In this case, two pairs of bases have been connected via tethers, shown as thin, red lines that have an assigned target length. Panels h and i show the result of an overnight relaxation. The pink strand runs downward along one duplex domain, with its 3’ end indicated by the bright red cone at the bottom. Similarly, the bright blue cone at the top of the blue strand shows that it is running upward. Thus the structure is anti-parallel, in this case with an inter-helix angle of about 21°, substantially less than the typical value around 60°;10 however, the relaxation result can be adjusted by changing the target lengths and spring constants of the tethers. Panels j-m show the side and front views of two DX molecules that have undergone the relaxation process. The upper molecule, with 21 nucleotide pairs between junctions, is unstrained and the two duplex domains can be seen to remain virtually undistorted in their B-DNA structure. The lower DX molecule (panels l and m), has only 19 bases between crossovers, and the relaxer reveals that the system is substantially strained; this is visible from the distortions in the duplexes generated in this conformation. This result does not guarantee that the 19 base DX won’t form, but the 21 base structure is much more promising and in this case, it is known to form well.9
Figure 2. Automatic relaxer examples.
Kink relaxation (a–b). The relaxation processor of GIDEON promotes the local rigidity of DNA. A 39 bp duplex was distorted sharply (bent 90° at two different points along the helix axis) was relaxed and resulted with a bend of less than 1° in the helix axis between neighboring base pairs. Hairpin relaxation (c–f). The loop capping a hairpin motif may be constructed from a duplex with one strand trimmed (d) and connected to its complementary strand (connection shown as green segment in e), followed by relaxation of the contorted structure into a uniform loop (f). The loop itself appears simple, but it is quite cumbersome to construct manually. Immobile Holliday Junction with Tethers (g–i).2 (g) An immobile Holliday junction drawn with the 4 arms unstacked. In a buffer containing divalent cations – such as Mg+2 – two pairs are of arms are known to stack in an anti-parallel fashion with an angle of about 63° between domains. The user specifies which pairs of arms stack by connecting the base stack axes (black cylinders) manually. The user can create tethers – non-material entities rendered as thin red cylinders – to restrict the distance between two objects. The model includes tethers specified by the user to force the unassociated vertices – opposite one another across the junction – close together, which will bring the phosphates spanning the junction into close proximity. (h–i) The restrictions imposed by the tethers brings the structure into an antiparallel configuration as can be seen by the downward orientation of the red cone at the 3’ end of the salmon-colored strand and the upward orientation of the dark blue cone at the 3’ end of the light blue strand. The angle between domains is about 21° – lower than the target value, but still in qualitative agreement with the observed structure.10
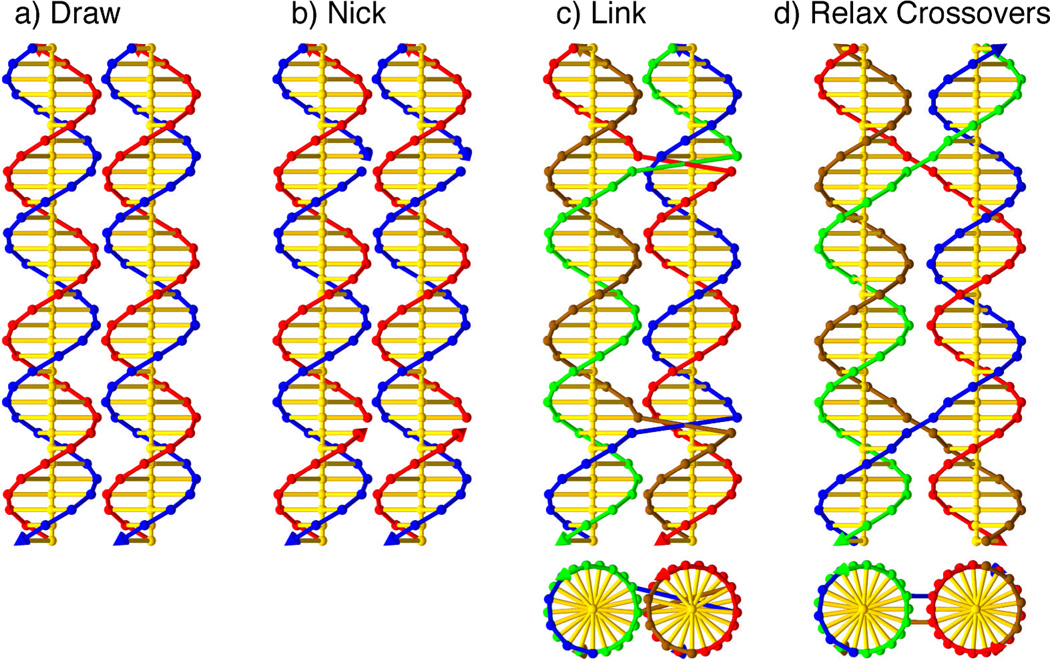
Figure 3 shows the steps involved in modeling a DX molecule with parallel domains, an odd number of half-turns between crossovers, where the extra odd half turn is a major (wide) groove separation (DPOW). 9 First, two duplexes are drawn next to each other, separated by an arbitrary distance (a). Second, nicks are placed in the two duplexes where crossovers between domains are designed to be (b). Third, the connections between the strands are inserted (c). Each of the compound strands that were multi-colored have been set to a single color, so each strand can be distinguished easily. Finally (d), the duplex domains are rotated and shifted apart so that all the phosphate linkages between the two domains (crossover links) are at their normal lengths, taken in this model to be 6.8 Å, the characteristic distance of phosphate linkages in the double helix. The final step is where geometrical information goes into the model. In this example, all the crossover links could reached their target lengths easily. In more difficult cases, there needs to be some strain in the system, and the duplexes need to be adjusted to a state that balances the torques on the various base stacks.
Figure 3. Construction and Manual Relaxation of a DPOW Double Crossover Molecule.
(a) Two double helices are drawn next to each other. (b) Nicks are placed on the strands where the two domains are to be joined. (c) Crossover links are inserted, and the backbones are re-colored to reflect the new strand identities. At the bottom, the end view of the structure is shown. (d) The duplex domains are moved and rotated so that the backbone segments joining the two domains are the same length as they would be if they joined two nucleosides in the same base stack ~6.8Å.This approach can be used to identify low-strain SDN structures. The resulting structures have perfectly undisturbed B-DNA duplex domains, and nominally unstrained connections. This is necessary but not sufficient to guarantee clean formation of the target structure; indeed, the DPOW has been found not to form cleanly, probably as a result of electrostatic repulsion.9 See Figures 4, 7 and 8 for examples of such structures.
Figure 4 shows drawings of two tensegrity triangles.23 On the left (a–d), is a left-handed triangle, one where the domains move away from the viewer as one proceeds counter-clockwise around the triangle. A right-handed triangle is shown on the right (e–h). In panel c, the left-handed triangle is viewed down one edge, and one can see the two yellow struts forming an angle between the junctions with the two other domains. The triangle can only form if the correct angle is made by the twist of the nucleotides along the edge of the triangle. In panel d, it is evident that approximately 1.3 turns are made by the 14 nucleotides along the edge. In contrast, in panels g and h, about 1.7 turns are made by 17 nucleotides. Since each nucleotide of solution B-DNA has an average 34.3° twist,26,27 a substantial deviation from the target angle can be generated by making each edge slightly longer or shorter. In addition, as the length of the edge changes, the target angle shifts. Calculating the desired angles between junctions and predicting what structures will form is helpful for building this structure.
Figure 4. Left and Right-handed Tensegrity Triangles.
The left column shows a left-handed tensegrity triangle with 14 nucleotides between junctions on each side. The right column shows a right-handed tensegrity triangle with 17 nucleotides between junctions. In the top row it is clear that the helical domains in the left- (right-) handed triangles come toward the viewer has one progresses clockwise (counter-clockwise) about the triangle. In the lower 3 rows, the helical axes are marked in blue, and the junctions are indicated by yellow struts that run from one axis to the other directly through the linking crossover. The 14 nucleotides of the left-handed triangle subtend about 1.3 turns, where the 17 nucleotides of the right-handed triangle subtend about 1.6 turns, as can be seen in the bottom row. The immobile Holliday junctions at each corner are more relaxed with the ~60° antiparallel configuration of the right-handed triangles than the ~–60° antiparallel configuration of the left-handed triangles, though both types have been shown to form.
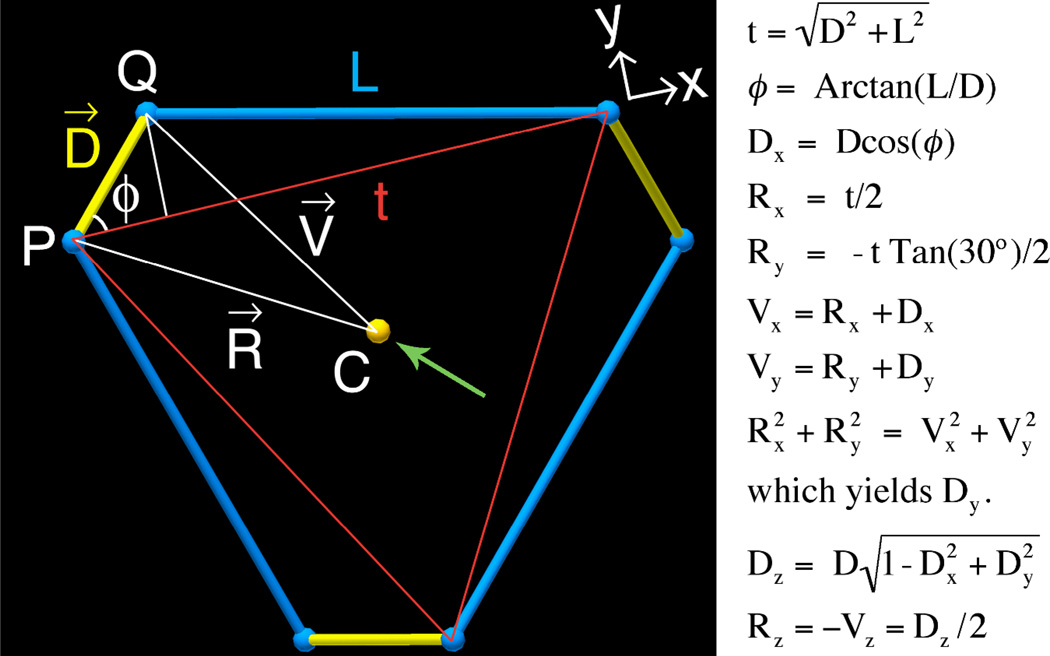
An analysis is illustrated in Figure 5 for 3-fold symmetric tensegrity triangles23. The structure has been abstracted to three blue helix axes of length L and three yellow struts that represent the junction spacings; the struts are each of length D, approximately equal to the diameter of a double helix. Each of these six segments is perpendicular to its two neighbors in 3-space. L and D are assumed to be known, which yields the magnitude of the angle, ϕ, and the length, t, of the red triangle edge. Let the x-axis run parallel to edge t, and the z-axis parallel to the 3-fold axis of the structure. Let point C, the centroid of the structure in three dimensions, serve as the origin of the coordinate system. Due to the 3-fold symmetry of the structure about C, if we can solve for the coordinates of points P and Q, we will have determined the geometry of the entire hexalateral and thereby solved the problem. Define the vectors R running from C to P, V running from C to Q, and D = V – R. The x-components of D, R, and V and the y-components of R, and V are trivial to calculate as functions of |D|, Dy, t, and ϕ all of which are known except Dy. The green arrow indicates one of the dyad axes that runs from the midpoint of QP through C. Because of this symmetry, the magnitudes of the projections of R and V onto the XY plane are equal, which allows one to solve for Dy, which in turn yields all the z-coordinates. See Figure 5 for details. We have produced a Microsoft Excel™ spreadsheet that takes the number of bases desired on each edge of a triangle as user input and outputs the percentage of over/under turning necessary to form the triangle, as well as the coordinates to input into GIDEON to draw the structure with optimal symmetry. For a copy of this spreadsheet contact the authors.
Figure 5. Derivation of Tensegrity Triangle Geometry.
The blue struts are the axes of the double helical domains forming a tensegrity triangle. The yellow struts represent the lines through the junctions as in Figure 4 above. Each pair of blue and yellow struts forms a right triangle with hypotenuse shown in red with length t. For a given duplex length, L, and a given duplex diameter, |D|, the geometrical constraints on the system require a particular angle between pairs of yellow struts (see Figure 4, panels d and h). To calculate that angle, we use point C, the centroid of the hexalateral, as the origin, and calculate the coordinates of points P and Q as specified by the equations at right. The entire system is then specified by the 3-fold symmetry about point C. Here, R runs from C to P, V runs from C to Q, and D = V – R. Note that this derivation depends critically upon the structure’s 2-fold rotational symmetry, whose axis is indicated by the green arrow, and the 3-fold rotational symmetry normal to the view plane. The 2-fold axis passes through C and the midpoint of D. Both of the symmetry axes run through point C.
If we suppose that the closest approach between the axes of joined duplex domains in a tensegrity triangle is 23 Å, we can find the edge lengths that generate triangles of minimal strain. The strain is measured in terms of percentage of extra twist needed in each nucleotide to have the junctions be sited optimally along each domain. This treatment leads to the following predictions for a left handed triangle: for an edge of 13 nucleotides, the strain is minimized with −5.7% strain; for 14 nucleotides, 1.3% strain; and for 15 nucleotides, 7.4% strain. For a right-handed triangle we find: for 16 nucleotides, minimal strain is 9.6%; for 17 nucleotides, 2.8% strain; for 18 nucleotides, −3.3% strain.
To challenge these predictions, we have built tensegrity triangles from DNA with every edge length from 13 to 18 nucleotides. The strands were synthesized by conventional phosphoramidite procedures28 and were purified by denaturing polyacrylamide gel electrophoresis. Stoichiometric mixtures of the strands (estimated by OD260) for each triangle were prepared separately in a solution containing 40 mM Tris-HCl, pH 8.0, 20 mM acetic acid, 2 mM EDTA, and 12.5 mM magnesium acetate. This is the standard buffer used in structural DNA nanotechnology.29 The EDTA is included to chelate possible trace metallic contaminants of the magnesium that could damage the DNA. Each mixture was cooled from 90 °C to room temperature in a 1-L water bath over the course of 48 h.
RESULTS
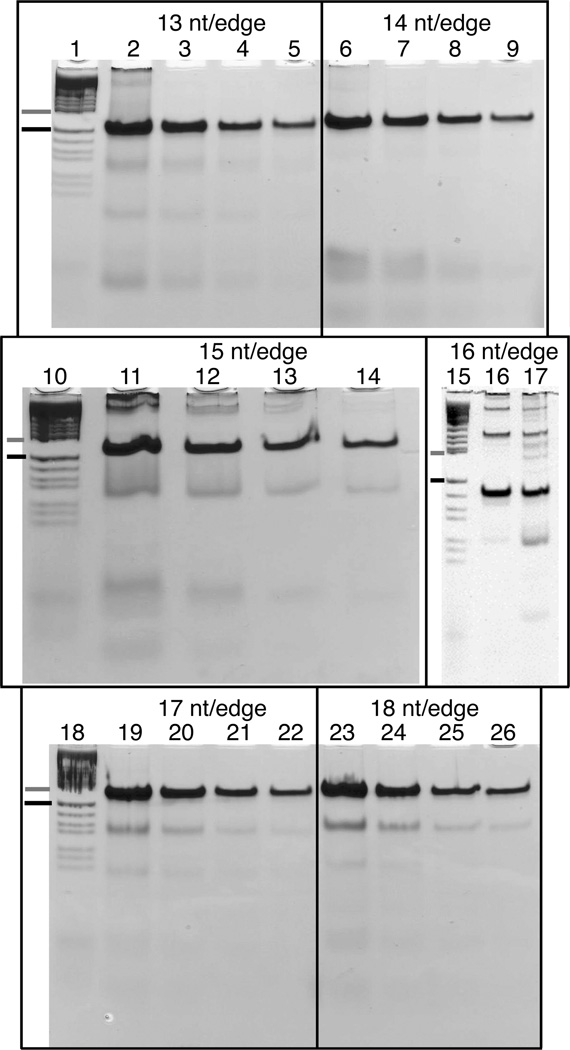
Figure 6 shows non-denaturing polyacrylamide gels run on a variety of tensegrity triangles. The left lane of each gel is a pBR322 HaeIII digest, with a gray dash marking the 184 base pair band, and a black dash marking the 124 base pair band. The gels shown in lanes 15–17 contain 8% polyacrylamide,, while all other gels contain 10% polyacrylamide. A range of strand concentrations is shown. A well-behaved DNA motif is characterized by a single band migrating in the vicinity of its molecular weight.30 For each triangle, the lower bands indicate small stoichiometry errors, but the upper bands suggest more serious problems. They indicate the formation of multimers, which occur primarily when the monomer is too strained to fold in a closed complex.9 We can see that the triangle with 13 nucleotides/edge has a significant upper band at a 12 µM strand concentration (lane 2), while the 14 nucleotide/edge triangle has only a faint upward streak at this concentration (lane 6). The 15 nucleotide/edge triangle has clear upper bands at 3 µM (lane 13) , and slight upper bands even at 1.5 µM (lane 14). The 16 nucleotide/edge triangle has heavy upper bands at 4 µM (lane 17), which remain even after the monomer lane was cut out and the triangle reannealed to ensure perfect stoichiometry (lane 16). The 17 and 18 nucleotide/edge triangles have no visible upper bands even at 12 µM. Thus the tendency to form multimers tracks well with the strains of the systems calculated above, and similar calculations have successfully guided the construction of other tensegrity triangles in this laboratory (PEC, Tong Wang, JK, Baoquan Ding, Lisa B. Israel, Xiaoping Zhang, Jianping Zheng, WBS, Jens J. Birktoft, Ruojie Sha and NCS, in preparation). Note that the model used here assumed an interhelix spacing of 23 Å. The data are not consistent with any interhelix spacing greater than 31 Å.
Figure 6. Tensegrity Triangle Gels.
Tensegrity triangles were constructed with edge lengths 13 through 18 nucleotides. Room temperature non-denaturing polyacrylamide gels show the triangles annealed at different concentrations. For each gel, the first lane contains markers consisting of a pBR322 HaeIII digest, with a gray dash marking the 184 base pair band, and a black dash marking the 124 base pair band. The three larger gels contain 10% polyacrylamide, and the tensegrity triangle concentrations are 12µM, 6µM, 3µM, and 1.5µM in order left to right. The small gel contains 8% polyacrylamide. Lane 17 was run at a strand concentration of 4µM. Lane 16 shows material that was taken from an earlier gel run where the monomer target band was cut out, eluted, and reannealed to a concentration of 4µM. The tendency of the systems to form multimers is proportional to the strain calculated in the text. The least multimer-prone structures are tensegrity triangles with 14 nucleotide pairs on an edge (left-handed), and 17 or 18 nucleotide pairs on an edge (right-handed).
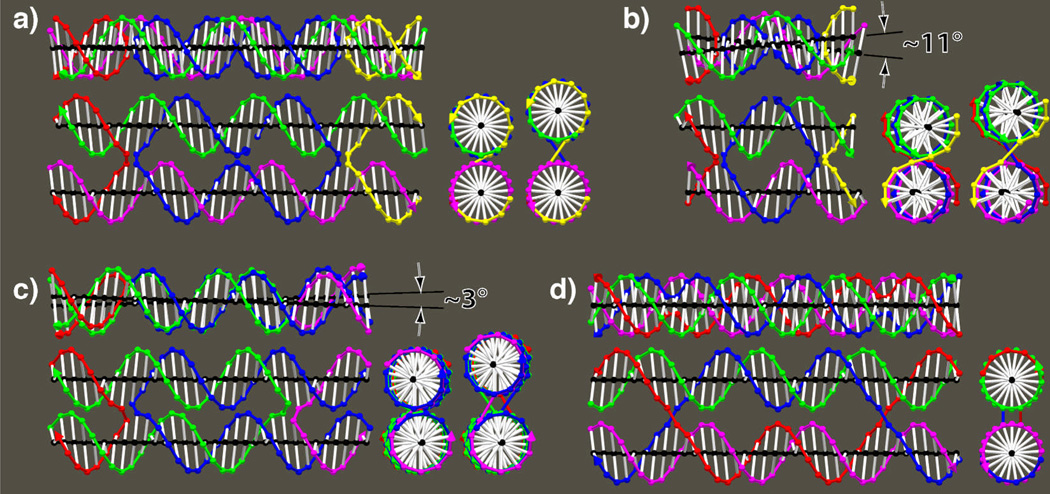
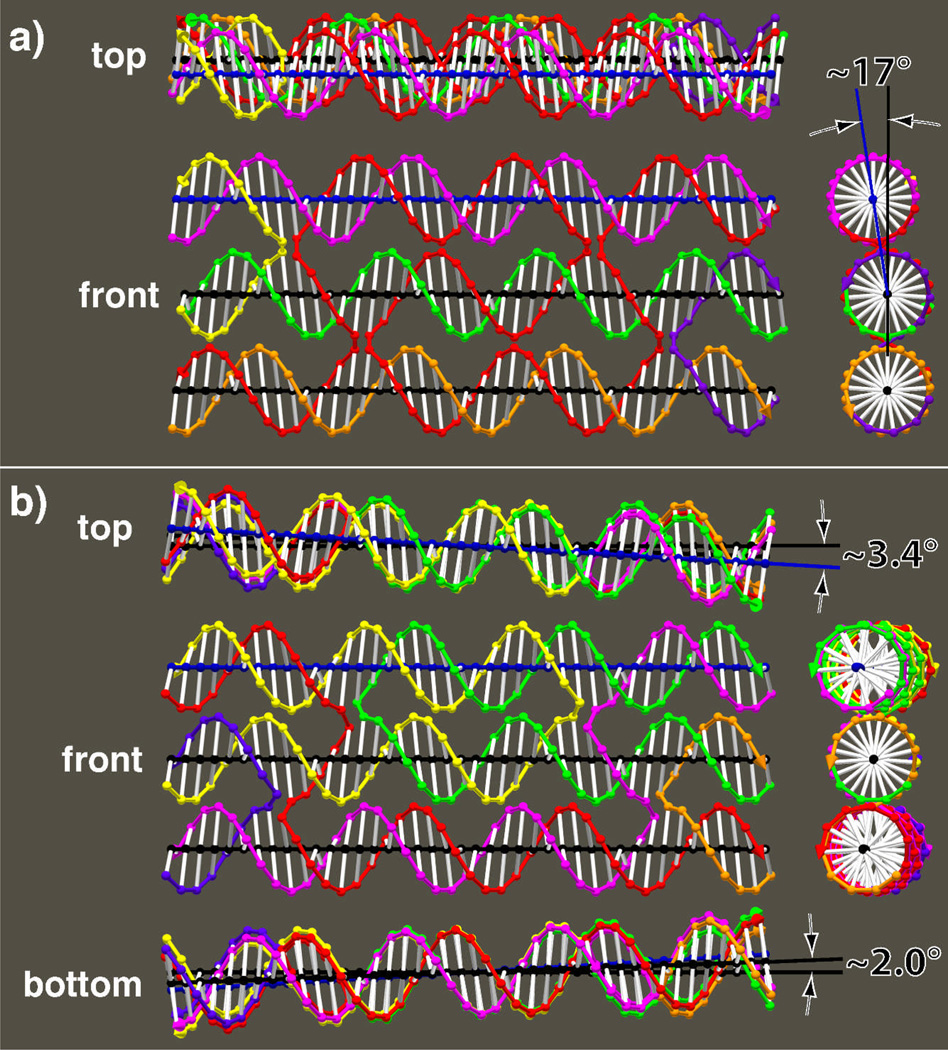
GIDEON allows similar modeling strategies to be applied easily to other SDN motifs. For instance, various DX and TX molecules are, perhaps, the most commonly used SDN motifs.9,16 They are generally taken to be flat, but precise modeling with GIDEON reveals, in many cases, deviations from planarity. Figures 7 and 8 show precision SDN models including the 6° tilt of bases known to occur in B-DNA.31 Figures 7 a and b are two DX molecules with antiparallel domains and an even number of half-turns between crossovers (DAE). Panel a shows a DAE molecule with exactly 2 helical turns (21 nucleotide pairs in each helix) between crossovers. It is relaxed with the two domains perfectly aligned. Panel b shows a DAE molecule with 10 nucleotide pairs between crossovers. This is slightly shy of one complete 10.5 nucleotide turn. This 0.5 nucleotide undertwist causes the two duplex axes to rotate about 10° relative to each other. Figure 7 c shows a model of a DX molecule with antiparallel domains, and an odd number of half-turns between crossovers (DAO). In this case, there are 16 nucleotide pairs between crossovers, which is a quarter of a nucleotide more than 1.5 turns. This overtwisting, combined with the asymmetry of the major and minor grooves results in the two domains being about 3° away from parallel. Further, the base tilts cause an unexpected skewing of the crossover strands: the green and purple crossovers to tilt up to the right, and the blue and red crossovers to tilt up to the left. Figure 7 d shows a DX molecule with parallel helices, and an even number of half turns between domains (DPE). For this case, the helical domains are parallel. Note also that for this structure, the crossover links cross each other in the front view but are parallel in the right end view. This is typical of parallel crossovers, but is the reverse of what occurs for antiparallel crossovers. Figure 8a, shows a TX molecule with an even number of half turns between junctions.31 In this case, all the helix axes are parallel, but the upper and lower domains form an angle of 163° about the middle domain. Figure 8 b shows a TX with odd numbers of half turns between domains.15 In this case, both the upper and lower domains are seen to rotate in the same direction relative to the middle domain – about 3°, with the upper domain turning a bit more than the lower one. Note that the non-planarity shown in Figure 8a naturally lends itself to the formation of tubes when multiple tiles are assembled into arrays.
Figure 7. Base Tilt Models of DX molecules.
Careful models were made, following the method shown in Figure 3. In this case, the 6° tilt of the bases in B-DNA was included in the model.31 Front, top and right views of each structure are shown. In a-c, an additional view from the right is shown with the distance between domains increased by 5Å to show the crossover strands. (a) A DAE molecule9 with 21 nucleotides between junctions showing ideal alignment of the domains.9 Note that the yellow and right blue crossovers perfectly occlude the left blue and red crossovers in the view on the far right. (b) A DAE molecule with 10 nucleotides between junctions and ~10° misalignment of the domains.9 (c) A DAO9 structure with 16 nucleotides between crossovers, showing ~3° misalignment of the domains.9 The green-purple crossover is displaced from the red-blue crossover in the far right view. This arrangement is characteristic of antiparallel DX molecules with odd numbers of half turns between junctions, and is a result of the different sizes of the major and minor grooves. (d) A DPE molecule9 showing parallel domains with 21 nucleotides between crossovers. The DPE is the only one of these structures known not to form cleanly.9
Figure 8. Base Tilt Models of TX molecules.
TX molecules were modeled using the same strategies as in Figure 7. (a) A TX molecule with an even number of half turns between junctions.32 The domains are parallel, but the upper domain is ~17° out of the plane defined by bottom two. (b) A TX molecule with an odd number of half turns between junctions.17 The top domain is turned about 3.4° relative to the middle domain, and the bottom domain is turned about 2.0° relative to the middle domain, with top and bottom domains turned in the same direction.
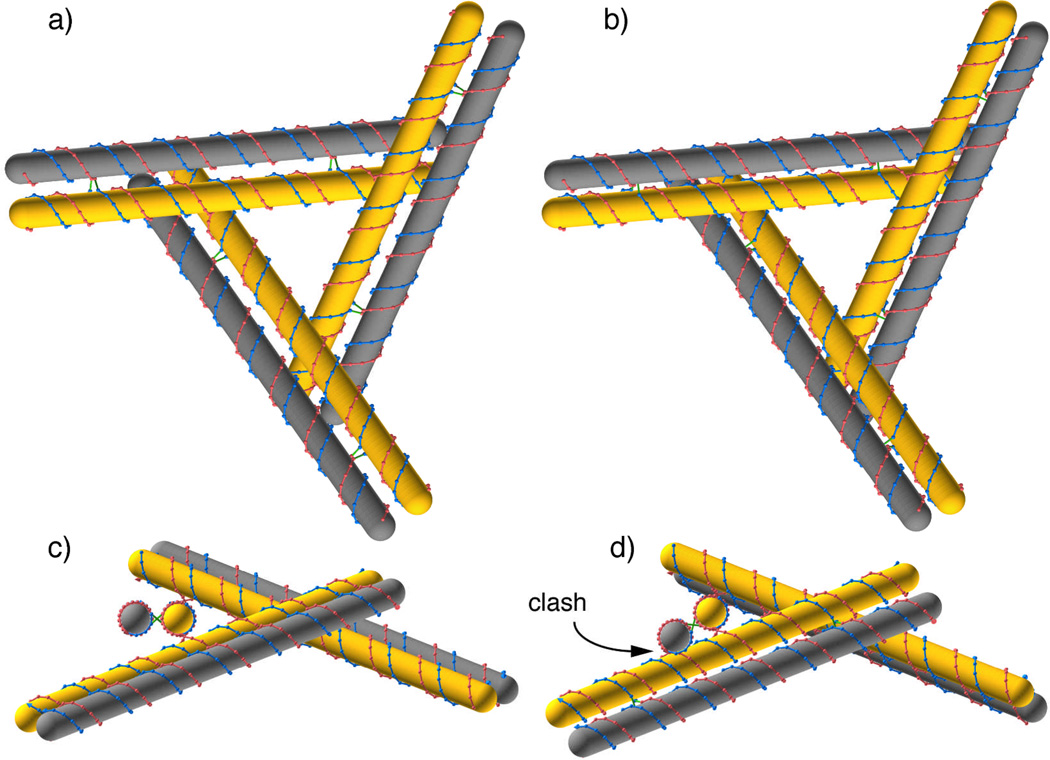
Sometimes, an SDN structure may have entirely undistorted double-helices, and all its crossovers links relaxed and yet it may still be geometrically forbidden because of steric clashes between parts of the molecule that appear far apart from the standpoint of primary or secondary structure. Consider the tensegrity triangles shown in Figure 9. The single domain triangles, shown with yellow base stacks, have been reinforced by adding one double helix along each edge, a DAE structure in each case. It would seem from Panels a and b that the two structures are more or less equally promising, even though the triangle crossover points differ in location between the two structures by one base. The structures are too large for conventional physical models to distinguish clearly between them. Precise modeling with GIDEON, however, reveals that while the structure in a and c is promising, the structure in b and d has a steric clash. When viewed along a duplex axis in d, the model shows an overlap between the outer, gray domain and the inner domain on the next edge of the triangle.
Figure 9. Steric Clashes in Tensegrity Triangles with DX Reinforcements.
A tensegrity triangle, shown with yellow domains in all panels is reinforced by adding a second, gray duplex domain to each leg of the triangle. The distance between domains has been increased to show the crossover links. The gray-yellow domain pairs form DAE structures with 42 bases between junctions. The only difference between the structure in the left panels and those in the right panels is that the crossover points defining the triangles have been moved over by one nucleotide pair. The difference is hardly visible in the top row, and can not be resolved in common physical models, but the structure on the right has a steric clash between the gray outer domains and the neighboring yellow domains that can be seen in (d) where the gray domain running toward the viewer overlaps the yellow domain running downward to the left.
DISCUSSION
The Utility of the Program
We have described a system to build and display virtual molecular models whose components are single strands, double helices, and single nucleotides. This system allows the user to develop simple yet precise models of SDN units, and evaluate the strains in various designs. These geometry-based techniques have been shown sufficient to explain broad trends in SDN formation without resorting to complex energetic calculations. In particular, we have shown that tensegrity triangles tend to form well when the geometrical strain is less than 4%, and tend to form multimers when the geometrical strain is higher. Further, as larger and more complex structures are made, GIDEON will be of increasing utility as the only effective means of checking for steric clashes in extended systems.
Not to be ignored is the importance of being able to display modeled systems that have been used in experiments. The representations that have been used to date (see, e.g., ref 9) are useful for many purposes, but they elide many features that a reader may wish to consider when reading a paper. Examples include exact helicity and placement of grooves. The program reported here provides this information implicitly, and also allows further simplifications when they would make the presentation clearer.
Validity of the Approach
There are limitations to the purely geometrical modeling methods used by GIDEON: The atoms in the crossover links have complex interactions with each other and with the solution. The strain in the system is likely to be accommodated by writhing of the duplex domains to some extent.33 Indeed, DPOW molecules have been found not to form cleanly, presumably due to some combination of charge repulsion of the duplex backbones and possible kinetic traps that lead to multimer formation.9 While a low-strain GIDEON model is not sufficient to guarantee formation of a structure, it appears to be generally necessary: failure to produce a relatively undistorted molecule or one without steric clashes, bodes poorly for the experimental success of a motif. Furthermore, the energetic and dynamic modeling approaches necessary to analyze a more detailed model are often computationally inaccessible, or else may require many months to get a solution for just a few structures.
Nevertheless,, GIDEON models are fairly straightforward to build, with the most complicated ones rarely taking more than a few hours for the experienced user. This time can be reduced as libraries of SDN structures are assembled, to be used as future building blocks. As we showed for the case of tensegrity triangles, geometric arguments are sufficient to explain qualitatively which structures form multimers more easily than others.
Computational Features and Potential Expansions
GIDEON’s GUI is implemented using the Metrowerks PowerPlant framework.34 Although it is currently specific to the Apple Macintosh running the Mac OS X operating system, the program’s conceptual architecture is fully adaptable to other operating systems and environments. Targeting other popular platforms (e.g., Windows, Linux and others) should be feasible, so that files would be fully exchangeable between all platforms. Likewise, a scriptable version of GIDEON would allow sophisticated models and animations to be created without the need for movie files.
GIDEON is currently presented as a modeling and structure design tool, yet through its highly flexible internal architecture, it has the potential to become a comprehensive development system. Many other aspects of nucleic acid nanotechnology, such as structure relaxation based on attraction and repulsion interactions of virtual structure components, sequence selection and energy estimation, could be modeled by more advanced features in future versions.
TABLE 1.
Strands for PAGE Evaluation of Tensegrity Triangle Stability. Lengths in Nucleotides Follow the 3' Ends.
| Strands 2, 5 and 7 are common to the triangles with edges length 13, 14, 15, 17 and 18 nucleotides: | |
| STRAND 2: | 5'-CCGCCAAGTGGCTGTCTG-3' 18 |
| STRAND 5: | 5'-TGGCTTCGTGGTACAGTC-3' 18 |
| STRAND 7: | 5'-TCGTAGCGTGGCACTGCC-3' 18 |
| Edge length 13: | |
| STRAND 1: | 5'-CAGACAGCCTGCTCTCGATTGGACGAAGCCA-3' 31 |
| STRAND 3: | 5'-CGAGAGCACCGTCTATTATCAC |
| CTGAACTCACCACCAAT-3' 39 | |
| STRAND 4: | 5'-GACTGTACCTGGTGAGTTCAGGACGCTACGA-3' 31 |
| STRAND 6: | 5'-GGCAGTGCCTGATAATAGACGGACTTGGCGG-3' 31 |
| Edge length 14: | |
| STRAND 1: | 5'-CAGACAGCCTGCTCTCGCATTGGACGAAGCCA-3' 32 |
| STRAND 3: | 5'-CGAGAGCACCGTCATAGCAT |
| CACCTGTCACTCACCACCAATG-3' 40 | |
| STRAND 4: | 5'-GACTGTACCTGGTGAGTGACAGGACGCTACGA-3' 32 |
| STRAND 6: | 5'-GGCAGTGCCTGATGCTATGACGGACTTGGCGG-3' 32 |
| Edge length 15: | |
| STRAND 1: | 5'-CAGACAGCCTGCTCTCGCATCTGGACGAAGCCA-3' 33 |
| STRAND 3: | 5'-CGAGAGCACCGTCAAGCTTATCA |
| CCTGAACACTCACCACCAGATG-3' 45 | |
| STRAND 4: | 5'-GACTGTACCTGGTGAGTGTTCAGGACGCTACGA-3' 33 |
| STRAND 6: | 5'-GGCAGTGCCTGATAAGCTTGACGGACTTGGCGG-3' 33 |
| Edge length 16: | |
| STRAND 1: | 5'-CAGACAGCCTGCTCTCGCATCGTGGACGAAGC-3' 32 |
| STRAND 2: | 5'-GACTGTACCTGGTGAGTGGTTCAGGACGCTAC-3' 32 |
| STRAND 3: | 5'-GGCAGTGCCTGATAATAGTTGACGGACTTGGC-3' 32 |
| STRAND 4: | 5'-CCGCCAAGTGGCTGTC-3' 16 |
| STRAND 5: | 5'-TGGCTTCGTGGTACAG-3' 16 |
| STRAND 6: | 5'-TCGTAGCGTGGCACTG-3' 16 |
| STRAND 7: | 5'-CGAGAGCACCGTCAACTATTATCA |
| CCTGAACCACTCACCACCACGATG-3' 48 | |
| Edge length 17: | |
| STRAND 1: | 5'-CAGACAGCCTGCTCTCGG |
| ATCGACGGACGAAGCCA-3' 35 | |
| STRAND 3: | 5'-CGAGAGCACCGTCAACCTATTATCAC |
| CTGAACGTACTCACCACCGTCGATC-3' 51 | |
| STRAND 4: | 5'-GACTGTACCTGGTGAGTA |
| CGTTCAGGACGCTACGA-3' 35 | |
| STRAND 6: | 5'-GGCAGTGCCTGATAATAG |
| GTTGACGGACTTGGCGG-3' 35 | |
| Edge length 18: | |
| STRAND 1: | 5'-CAGACAGCCTGCTCTCGG |
| TATCGACGGACGAAGCCA-3' 36 | |
| STRAND 3: | 5'-CGAGAGCACCGTCAACCAGATTATCAC |
| CTGAACTCTACTCACCACCGTCGATAC-3' 54 | |
| STRAND 4: | 5'-GACTGTACCTGGTGAGTA |
| GAGTTCAGGACGCTACGA-3' 36 | |
| STRAND 6: | 5'-GGCAGTGCCTGATAATCT |
| GGTTGACGGACTTGGCGG-3' 36 | |
ACKNOWLEDGEMENTS
This research has been supported by grants GM-29554 from NIGMS, N00014-98-1-0093 from ONR, grants DMI-0210844, EIA-0086015, CCF-0432009, CCF-0523290 and CTS-0103002 from the NSF, 48681-EL from ARO and NTI-001 from Nanoscience Technologies, Inc to N.C.S.
REFERENCES
- 1.Seeman NC. Nanotechnology and the double helix. Sci. Am. 2004;290:64–75. doi: 10.1038/scientificamerican0604-64. [DOI] [PubMed] [Google Scholar]
- 2.Hagerman PJ. Flexibility of DNA. Annu. Rev. Biophys. Biophys. Chem. 1988;17:265–286. doi: 10.1146/annurev.bb.17.060188.001405. [DOI] [PubMed] [Google Scholar]
- 3.Qiu H, Dewan JC, Seeman NC. A DNA Decamer with a Sticky End: The Crystal Structure of d-CGACGATCGT. J. Mol. Biol. 1997;267:881–898. doi: 10.1006/jmbi.1997.0918. [DOI] [PubMed] [Google Scholar]
- 4.Kallenbach NR, Ma R-I, Seeman NC. An Immobile Nucleic Acid Junction Constructed from Oligonucleotides. . Nature. 1983;305:829–831. [Google Scholar]
- 5.Ma R-I, Kallenbach NR, Sheardy RD, Petrillo ML, Seeman NC. Three-arm nucleic acid junctions are flexible. Nucleic Acids Res. 1986;14:9745–9753. doi: 10.1093/nar/14.24.9745. [DOI] [PMC free article] [PubMed] [Google Scholar]
- 6.Liu B, Leontis NB, Seeman NC. Bulged 3-arm DNA Branched Junctions as Components for Nanoconstruction. Nanobiol. 1994;3:177–188. [Google Scholar]
- 7.Petrillo ML, Newton CJ, Cunningham RP, Ma R-I, Kallenbach NR, Seeman NC. The ligation and flexibility of four-arm DNA junctions. Biopolymers. 1988;27:1337–1352. doi: 10.1002/bip.360270902. [DOI] [PubMed] [Google Scholar]
- 8.Qi J, Li X, Yang X, Seeman NC. Ligation of triangles built from bulged 3-arm DNA branched junctions. J. Am. Chem. Soc. 1996;118:6121–6130. [Google Scholar]
- 9.Fu T-J, Seeman NC. DNA double-crossover molecules. Biochemistry. 1993;32:3211–3220. doi: 10.1021/bi00064a003. [DOI] [PubMed] [Google Scholar]
- 10.Mao C, Sun W, Seeman NC. Designed two-dimensional DNA Holliday junction arrays visualized by atomic force microscopy. J. Am. Chem. Soc. 1999;121:5437–5443. [Google Scholar]
- 11.Sa-Ardyen P, Vologodskii AV, Seeman NC. The flexibility of DNA double crossover molecules. Biophys. J. 2003;84:3829–3837. doi: 10.1016/S0006-3495(03)75110-8. [DOI] [PMC free article] [PubMed] [Google Scholar]
- 12.Seeman NC. Interactive design and manipulation of macro-molecular architecture utilizing nucleic acid junctions. J. Mol. Graphics. 1985;3:34–39. [Google Scholar]
- 13.Tung C-S, Carter ES., II Nucleic Acid Modeling Tool (NAMOT) -- An Interactive Graphic Tool for Modeling Nucleic-Acid Structures. Comput. Apps. Biosciences. 1994;10:427–433. doi: 10.1093/bioinformatics/10.4.427. [DOI] [PubMed] [Google Scholar]
- 14.Carter ES, II, Tung C-S. NAMOT2 -- A redesigned nucleic acid modeling tool: construction of non-canonical DNA structures. Comput. Apps. Biosciences. 1996;12:25–30. doi: 10.1093/bioinformatics/12.1.25. [DOI] [PubMed] [Google Scholar]
- 15.Seeman NC. Physical models for exploring DNA topology. J. Biomol. Struct. and Dyns. 1988;5:997–1004. doi: 10.1080/07391102.1988.10506445. [DOI] [PubMed] [Google Scholar]
- 16.LaBean TH, Yan H, Kopatsch J, Liu F, Winfree E, Reif JH, Seeman NC. The construction, analysis, ligation and self-assembly of DNA triple crossover complexes. J. Am. Chem. Soc. 2000;122:1848–1860. [Google Scholar]
- 17.Shen Z, Yan H, Wang T, Seeman NC. Paranemic crossover DNA: a generalized Holliday structure with applications in nanotechnology. J. Am. Chem. Soc. 2004;126:1666–1674. doi: 10.1021/ja038381e. [DOI] [PMC free article] [PubMed] [Google Scholar]
- 18.Mathieu F, Liao S, Mao C, Kopatsch J, Wang T, Seeman NC. Six-helix bundles designed from DNA. Nano Lett. 2005;5:661–665. doi: 10.1021/nl050084f. [DOI] [PMC free article] [PubMed] [Google Scholar]
- 19.Mao C, Sun W, Shen Z, Seeman NC. A DNA nanomechanical device based on the B-Z transition. Nature. 1999;397:144–146. doi: 10.1038/16437. [DOI] [PubMed] [Google Scholar]
- 20.Yan H, Zhang X, Shen Z, Seeman NC. A robust DNA mechanical device controlled by hybridization topology. Nature. 2002;415:62–65. doi: 10.1038/415062a. [DOI] [PubMed] [Google Scholar]
- 21.Sherman WB, Seeman NC. A precisely controlled DNA biped walking device. Nano Lett. 2004;4:1203–1207. [Google Scholar]
- 22.Liao S, Seeman NC. Translation of DNA signals into polymer assembly instructions. Science. 2004;306:2072–2074. doi: 10.1126/science.1104299. [DOI] [PMC free article] [PubMed] [Google Scholar]
- 23.Liu D, Wang M, Deng Z, Walulu R, Mao C. Tensegrity: construction of rigid DNA triangles with flexible four-arm DNA junctions. J. Am. Chem. Soc. 2004;126:2324–2325. doi: 10.1021/ja031754r. [DOI] [PubMed] [Google Scholar]
- 24.Chen J, Seeman NC. Synthesis from DNA of a molecule with the connectivity of a cube. Nature. 1991;350:631–633. doi: 10.1038/350631a0. [DOI] [PubMed] [Google Scholar]
- 25.Sontag ED. Mathematical Control Theory: Deterministic Finite Dimension Systems. Second Edition. Springer-Verlag; 1998. pp. 19–20. [Google Scholar]
- 26.Wang J. Helical repeat of DNA in solution. Proc. Nat. Acad. Sci. U. S. A. 1979;76:200–203. doi: 10.1073/pnas.76.1.200. [DOI] [PMC free article] [PubMed] [Google Scholar]
- 27.Rhodes D, Klug A. Helical periodicity of DNA determined by enzyme digestion. Nature. 1980;286:573–578. doi: 10.1038/286573a0. [DOI] [PubMed] [Google Scholar]
- 28.Caruthers MH. Gene synthesis machines – DNA chemistry and its uses. Science. 1985;240:281–285. doi: 10.1126/science.3863253. [DOI] [PubMed] [Google Scholar]
- 29.Seeman NC. Current Protocols in Nucleic Acid Chemistry, Unit 12.1. New York: John Wiley & Sons; 2002. Key Experimental Approaches in DNA Nanotechnology. [DOI] [PubMed] [Google Scholar]
- 30.Seeman NC. Current Protocols in Nucleic Acid Chemistry, Unit 12.1. New York: John Wiley & Sons; 2002. Key Experimental Approaches in DNA Nanotechnology. [DOI] [PubMed] [Google Scholar]
- 31.Arnott S, Hukins DWL. Refinement of the structure of B-DNA and implications for the analysis of X-ray diffraction data from fibers of biopolymers. J. Mol. Biol. 1973;81:93–105. doi: 10.1016/0022-2836(73)90182-4. [DOI] [PubMed] [Google Scholar]
- 32.LaBean TH, Winfree E, Reif JH. Experimental progress in computation by self-assembly of DNA tilings. In: Winfree E, Gifford DK, editors. DIMACS Series in Discrete Mathematics and Theoretical Computer Science. Vol. 54. Rhode Island: American Mathematical Society; 2000. pp. 123–140. [Google Scholar]
- 33.Maiti PK, Pascal TA, Vaidehi N, Goddard WA. The stability of Seeman JX DNA topoisomers of paranemic crossover (PX) molecules as a function of crossover number. Nucleic Acids Res. 2004;32:6047–6056. doi: 10.1093/nar/gkh931. [DOI] [PMC free article] [PubMed] [Google Scholar]
- 34.Metrowerks Corp., 7700 West Parmer Lane, Austin, Texas 78729 USA. http://www.metrowerks.com. [Google Scholar]


