Abstract
Objective: Define, extract and evaluate potential performance indicators from computer-generated data collected during simulated clinical female pelvic examinations.
Design: Qualitative and quantitative study analyzing computer generated simulator data and written clinical assessments collected from medical students who performed physical examinations on three clinically different pelvic simulators.
Setting: Introduction to patient care course at a major United States medical school.
Participants: Seventy-three pre-clinical medical students performed 219 simulated pelvic examinations and generated 219 written clinical assessments.
Measurements: Cronbach’s alpha for the newly defined performance indicators, Pearson’s correlation of performance indicators with scored written clinical assessments of simulator findings.
Results: Four novel performance indicators were defined: time to perform a complete examination, number of critical areas touched during the exam, the maximum pressure used, and the frequency at which these areas were touched. The reliability coefficients (alpha) were time = 0.7240, critical areas = 0.6329, maximum pressure = 0.7701, and frequency = 0.5011. Of the four indicators, three correlated positively and significantly with the written clinical assessment scores: critical areas, p < 0.01; frequency, p < 0.05; and maximum pressure, p < 0.05.
Conclusion: This study demonstrates a novel method of analyzing raw numerical data generated from a newly developed patient simulator; deriving performance indicators from computer generated simulator data; and assessing validity of those indicators by comparing them with written assessment scores. Results show the new assessment measures provide an objective, reliable, and valid method of assessing students’ physical examination techniques on the pelvic exam simulator.
Objective assessment of clinical and technical skills is now possible with simulation and virtual reality technologies.1,2Virtual reality simulators such as the Minimally Invasive Surgery Trainer-Virtual Reality (MIST-VR), the Mentice Shoulder Arthroscopy Simulator, and the Endoscopic Sinus Surgery (ESS) Simulator have been developed to provide trainees with practice performing surgical procedures and immediate feedback on their performance.3–6The simulator scoring systems or “internal metrics” capture user performance data and convert this information into scores, using variables such as “time” to complete the task, number of “collisions”, and “path length” to intended target. The emerging field of simulator development raises challenging research questions about the psychometric properties of simulators, including how much and what kind of data to collect as well as how to record and report the scores so they provide useful feedback for students and trainees. Performance data generated from these novel teaching and assessment tools have the potential to revolutionize skills assessments by providing more objective and reliable assessment measures than those most commonly used in medical training today.
Development of the E-Pelvis, a novel physical examination simulator, has afforded the opportunity to define and validate assessment measures that have never been used before in evaluating clinicians’ technical skills. The purpose of this research project was to demonstrate concurrent validity of the simulator by comparing computer generated data collected during simulated pelvic exams with students’ written assessments of the clinical findings on three simulators.
Background
Clinical examination of the female pelvis entails visual inspection and palpation of the external genitalia; speculum-assisted evaluation of the cervix and vaginal vault; bimanual palpation of the cervix, fundus and adnexa; and rectovaginal examination to facilitate further evaluation of the pelvic organs.7–9Although most of the steps involved in performing a pelvic examination can be directly visualized and evaluated, objective evaluation of bimanual pelvic examination skills has inherently been difficult. While examining a patient, once a student or resident places his or her examining fingers into the patient’s vaginal vault, the instructor cannot see what the student is doing, nor can the instructor intervene to place the student’s hands in the correct position or anatomical location.
Current teaching in clinics, the operating room and patient wards, provide inadequate learning environments for students performing the exam for the first time.10,11Verbal feedback about performance is often difficult for a number of reasons including, awkward or complex clinical settings and inadequate time.12As a result, special attempts to teach and assess pelvic exam skills have been developed, analyzed and incorporated into medical student training.13–15Despite these attempts, it is possible for a student to graduate from medical school having never learned proper pelvic examination technique.
In the 1970s, the Gynecology Teaching Associates (GTAs) were introduced into the medical curriculum.16,17GTAs offer students a hands-on learning experience in a more suitable learning environment and provide students with feedback that is impossible for an observing clinician to provide. The teaching associates have been trained to recognize proper technical skills and are fully aware when their cervix, fundus, and ovaries are being examined. Limitations to the use of GTAs for learning and assessing female pelvic examination skills include cost, availability for multiple examinations, and demonstration of pathologic findings. As a result, not all medical schools use GTAs for training their students.18
With the emergence of the GTAs and the pelvic mannequins in the 1970s, researchers began evaluating the effectiveness of the two modalities as teaching tools.19,20While both the Holzman and Shain studies showed that students trained with GTAs had significantly better interpersonal skills, there were no significant differences in cognitive abilities or psychomotor skills. Studies evaluating the mannequins as teaching tools have shown some benefit over reading alone.14,21,24Although there have been numerous studies evaluating the teaching effectiveness of the GTAs and mannequins, studies focusing on assessment of proper exam skills are limited.
Objective assessment, including individualized and timely feedback, is imperative in learning proper clinical and technical skills. The novel assessments currently being developed and used in simulation technology may enhance the ability to objectively evaluate technical skills. A major problem with current assessments of physical examination skills is the largely summative and subjective nature of these evaluations. In addition, specific, individualized feedback is limited. As a result, there is an ongoing, critical need for research in developing assessment methods that will enable standardized teaching and assessments of clinical physical examination skills. With a lack of focused, corrective feedback, student learning may be haphazard, prolonged and involve unnecessary patient discomfort and dissatisfaction.
We have developed a method of instrumenting teaching-mannequins such that physical examination performance can be captured and measured during simulated clinical examinations.23While the raw data collected during these simulated examinations generate an objective measure of performance, the data require further analysis to provide meaningful feedback. This paper outlines the steps taken in the development and validation of four newly defined assessment measures.
Research Question
The purpose of this research study was to develop and validate a new method of assessing medical students’ female pelvic examination skills through direct electronic recording of their palpations during simulated clinical examinations of the E-Pelvis simulator. The research questions that guided this study were as follows: (1) What variables might be extracted from raw, computer generated simulator data? (2) How reliable are the variables? (3) To what extent are students’ scores on written clinical assessments of the simulator correlated with variables derived from the electronic recordings captured during simulated female pelvic exams?
Methods
Setting and Participants
This research project was performed over an eight-week period in conjunction with a mandatory physical examination course for second-year medical students, Preparation for Clinical Medicine. The focus of the course was to learn essential skills necessary in conducting complete clinical physical examinations. During the day, general sessions focused on physical examination skills of various regions of the human body, including head and neck and thorax and abdomen. During the evening, there were three special sessions focused specifically on male genitourinary, female breast and female pelvic examinations.
The student participants were in their preclinical year at Stanford University School of Medicine. All students enrolled in the course, fifty females and thirty-seven males, agreed to participate in the study. Data from the first two study sessions were not included in this analysis as these students only had access to two of the three simulators. An additional student was excluded as an outlier. The final data set included seventy-three students, forty-three females and thirty males. Sixty-three of the students had no previous experience with conducting clinical pelvic examinations. Of the ten students who had previous experience, six of those students had only done between one to two pelvic exams prior to this course. Three of the students had performed between three and five exams and one student had performed more than 10 exams prior to this course. This student was a medical aid before coming to medical school.
Materials
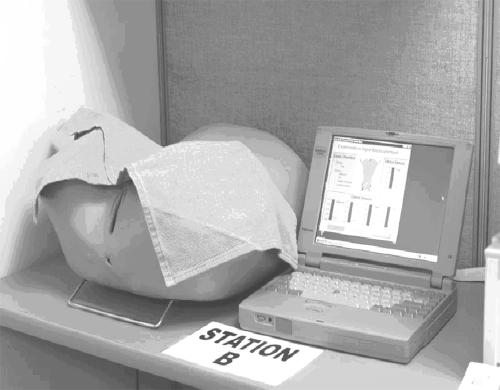
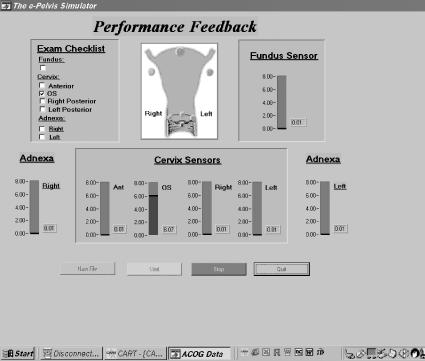
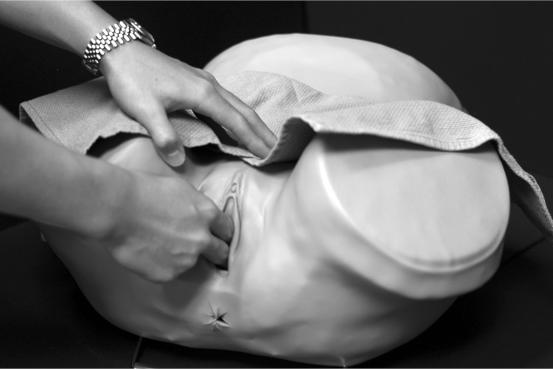
The pelvic examination simulator, E-Pelvis, consists of a partial mannequin, umbilicus to mid-thigh, instrumented internally with electronic sensors that are interfaced with a data acquisition card (Figure 1▶). The sensors and data acquisition hardware allow immediate visual feedback on performance via a graphic interface displayed on a computer monitor. Figure 2▶shows a sample interface. In this example, the user is touching the cervical os. Consequently, the corresponding register bar rises to a level of six, the indicator button in the cartoon diagram turns blue and a check mark appears in the ‘Exam Checklist’ window. During a simulated pelvic exam, this interface enables students and instructors to see where the examiner is touching and with how much pressure.
Figure 1 .
The complete system.
Figure 2 .
The active interface.
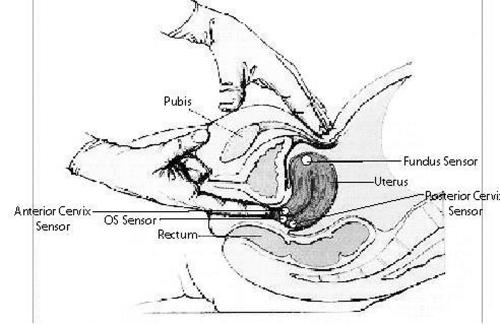
In alliance with clinical exam guidelines outlined in physical exam textbooks,7,8sensors were placed inside the simulator on the cervix, uterine fundus, and adnexa. Figure 3▶shows a diagram of sensor placements. Four small sensors were placed on the cervix (mid-anterior, os, left and right posterior), and one large sensor was placed on the uterine fundus. Because the adnexa is a complex space and not a solid organ like the cervix and fundus, it was difficult to use individual sensors to ensure capture of user navigation in this space. Therefore, we placed a sensor within a 4-cm mass in the right adnexa of one of the simulators.
Figure 3 .
Sensor locations.
In addition to providing the user with visual feedback during the bimanual pelvic examination, the simulator may be used to collect performance data. While students are performing simulated clinical examinations, data are collected at a frequency of 30 hertz and stored in individual data files for off-line analysis. A complete sequence of events may be captured as the software samples sensor readings thirty times a second (30 hertz) whether the sensor is being touched or not. When the simulator is being used as a teaching tool, students are encouraged to use the visual feedback interface to aid in their performance. However, in the assessment mode, the computer screen is turned away from the users, and they are not allowed to use the graphic interface for feedback.
Procedure
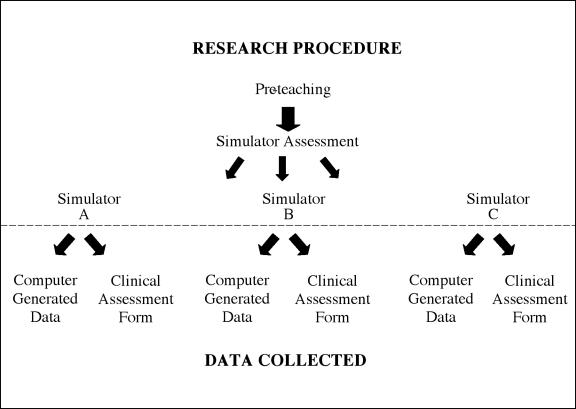
Data were collected during twelve teaching sessions with six to eight students each. All of the students watched an eleven-minute video demonstrating the essential steps of a complete clinical pelvic examination, including inspection, speculum examination, bimanual examination and rectovaginal examination. Patient draping, positioning, cultures and choice of specula were also reviewed. Upon completion of the video, all students participated in assessment sessions using three clinically different E-Pelvis simulators. The variations in clinical exam findings for the simulators were as follows: simulator A, an anteverted uterus and a right adnexal mass; simulator B, a retroverted uterus and no adnexal mass; and simulator C, an anteflexed uterus and no adnexal mass. Immediately after examining one of the simulators, each student completed an assessment form indicating the clinical findings of the cervix, fundus and adnexa for that simulator. This process continued until all of the students had examined all three simulators. Figure 4▶shows a diagram of the research procedures and data collection.
Figure 4 .
Research procedures and data collection.
Dependent Variables
The dependent variables were generated from two sources; the students’ written clinical assessment forms and the electronic performance data collected during the students’ simulated pelvic examinations on the E-Pelvis. Before the quantitative analyses could be done, the dependent variables had to be defined, and extracted from the individual data files.
The Written Assessment Variable
Immediately after examining each simulator, students were asked to make written comments about the clinical findings of the cervix, fundus and adnexa, specifically size, shape, consistency, and anatomic position. Data from these forms were coded using a two-part grading system. During the first part, the students’ written statements were assessed as correct or incorrect and coded accordingly. During the second part, those items that were coded as being correct were assessed for quality based on three criteria: (1) consistent and proper use of terminology, (2) identification of proper anatomical location, and (3) noting important factors characterizing the structure being evaluated. If the student stated there was a mass in the adnexa and properly noted the location, size, and consistency, a score of (2) was given. In contrast, if the student stated that there was “no mass” in the adnexa when in fact there was, this was considered to be incorrect and score of (0) was given. However, if the student stated that there was a mass in the adnexa but did not describe it properly, a score of (1) was given. Finally, if a student correctly reported on the cervix, fundus and adnexa on one of the simulators, an accuracy score of (6) was given for that simulator. On completion of the written assessment analyses, each student was assigned a total accuracy score, the sum accuracy on all three simulators. The maximum score possible was 18.
The Simulator Variables
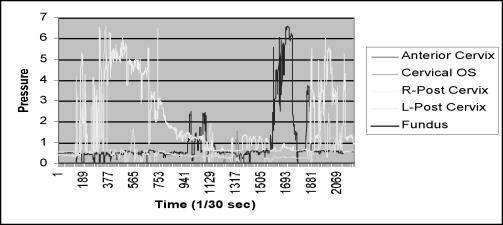
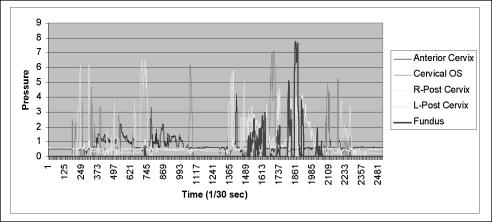
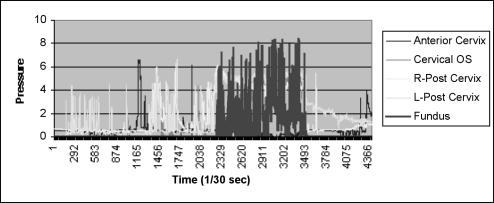
Because the simulator data represent information that has never been collected before, an important part of data analysis consisted of developing rules and guidelines to assist in defining possible indicators of performance and deriving this information from the raw electronic performance data. Qualitative analyses of line graphs generated from the raw performance data gave insights into data characteristics that might represent performance. The following figures depict variations noted in graphical representations of the electronic performance data and illustrate the qualitative processing necessary in deciding which characteristics might represent performance. Figures 5, 6, and 7▶▶▶show wide variations in exam characteristics among three different students examining the same simulator. Each of the colors on the graphs represent a different anatomical location within the simulator. Figure 5▶shows that this student did not touch the uterine fundus during his examination. Figures 6 and 7▶▶show that these two students touched the uterine fundus but had variations in the characteristics of the fundus examination. The student in Figure 6▶examined the fundus with less frequency and less pressure than the student in Figure 7▶who touched the fundus several times, at higher pressures and over a longer period of time. After evaluating several hundred line graphs and noting the vast differences in examination characteristics, four variables were defined: (1) length of time required to perform a complete exam; (2) number of critical areas, or sensors touched during the exam; (3) maximum pressure used while examining these areas; and (4) number of times, or frequency each area was palpated.
Figure 5 .
Line graph of clinical exam showing that the fundus sensor was not touched.
Figure 6 .
Line graph of clinical exam showing that the fundus sensor was touched at varying pressures. The maximum reading is 7.85 pressure units.
Figure 7 .
Line graph of clinical exam showing that the fundus sensor was touched several times at pressures greater than 6 pressure units and the maximum pressure was 8.39 pressure units.
Time Variable.
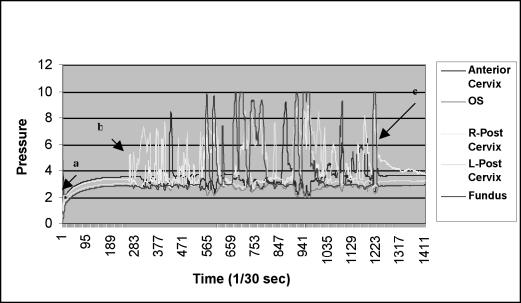
The time variable was equivalent to the length of time necessary for a student to perform a complete examination. Exam completion time was defined as the time at which the last sensor was touched minus the time at which the first sensor was touched (Figure 8▶). The exam was considered to have started when the pressure on any sensor reached one full pressure-unit above baseline. Time variables were created for each student for each of the three simulated clinical examinations performed. A total time variable was created by calculating the average time that it took a student to perform a complete examination.
Figure 8 .
The amount of pressure applied to each of five sensors per unit time: (a) time at which the simulator was turned on; (b) time the first sensor (right posterior cervix) was touched; and (c) time at which the last sensor(s) (fundus and right posterior cervix)were touched.
Critical Areas Variable.
The critical areas variable represents the number of sensors touched during the simulated clinical examinations. All three simulators had four sensors on cervix: anterior, right posterior, left posterior, and the cervical os. The three simulators also had one sensor on the apex of the fundus. One simulator had an additional sensor in the right adnexa. This sensor was embedded in a right adnexal mass. There were a total of sixteen sensors on all three simulators combined. Qualitative analyses of several hundred graphs revealed that noise levels above 2 pressure units were nonexistent. From this evaluation, critical area variables were created for each sensor on all of the simulators using the following rules: (1) If a sensor had been purposefully touched during the exam, the maximum pressure for that sensor would be greater than two pressure-units above baseline sensor reading. For example, on simulator A, if the mean baseline reading for the os sensor was zero, all students who had a maximum os sensor reading on Simulator A, two pressure-units above zero, received a score of one. (2) Those who had a maximum sensor reading less than two pressure units above zero received a score of zero. By adding all of the scores each student received on the sixteen sensors, a critical area score was generated. Zero was the lowest score possible and sixteen was the highest score possible.
Maximum Pressure Variable.
The maximum pressure variable represents the highest pressure reading recorded for a sensor during the simulated examination. For example, if the highest pressure readings recorded were: anterior cervical sensor, 7 pressure units; left posterior sensor, 10 pressure units; right posterior sensor, 4 pressure units; and there were no readings above baseline for the os and fundus sensor, the score for this exam would be 21. A total maximum pressure score was created for each student by combining the maximum pressures applied to each sensor while examining the three simulators.
Frequency Variable.
The frequency variable represents the number of times a sensor was touched. The procedures for creating this variable involved counting the number of times a given sensor was touched within 0.05 pressure units of the maximum pressure. For instance, if the maximum pressure applied to the fundus sensor on simulator B was 8 pressure units, all of the readings for that sensor within a pressure-unit range of 7.95 to 8.0 were counted and used to represent the frequency variable. A frequency score was developed by adding the calculated frequencies for each of the sixteen sensors on the three simulators.
Results
Analysis of Written Clinical Assessments
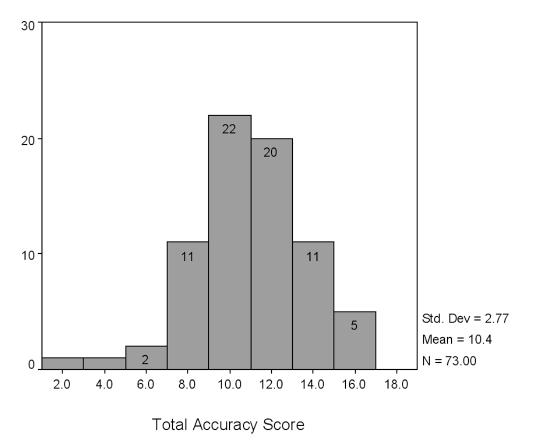
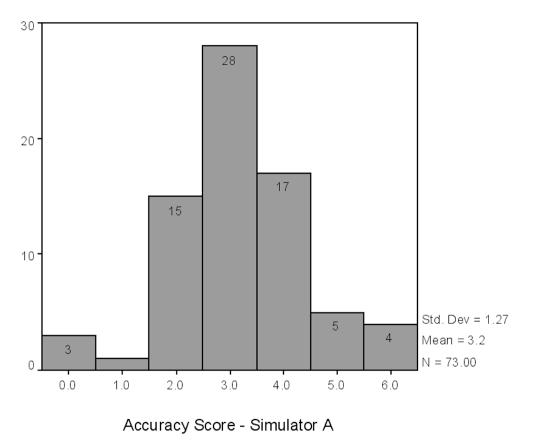
The mean accuracy score for all of the students completing the assessment forms was 10.4 out of 18 possible points (Figure 9▶). The highest score achieved was sixteen. Two students achieved a score of 16 and three students achieved a score of 15. The mean scores for simulators A, B, and C were 3.2, 3.5 and 3.7 respectively. The maximum possible score per simulator was 6 (Figures 10A▶–C).
Figure 9 .
Histogram of Total Accuracy Score
Figure 10 .
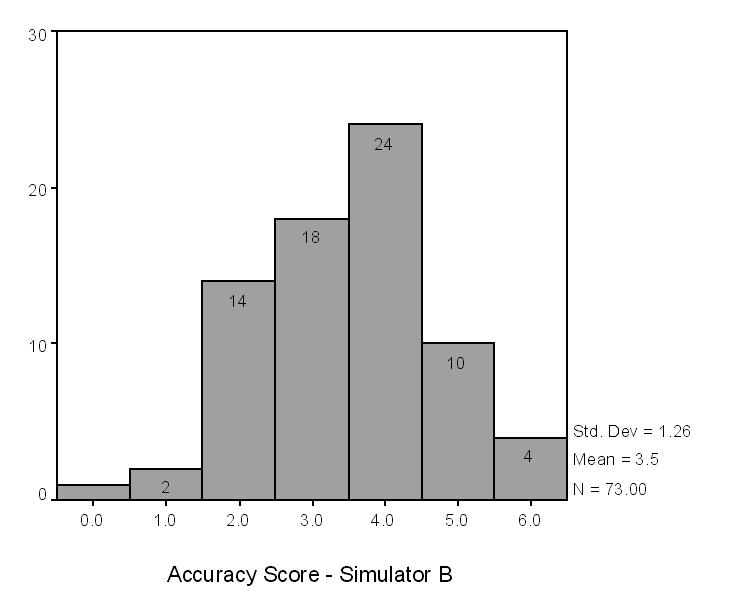
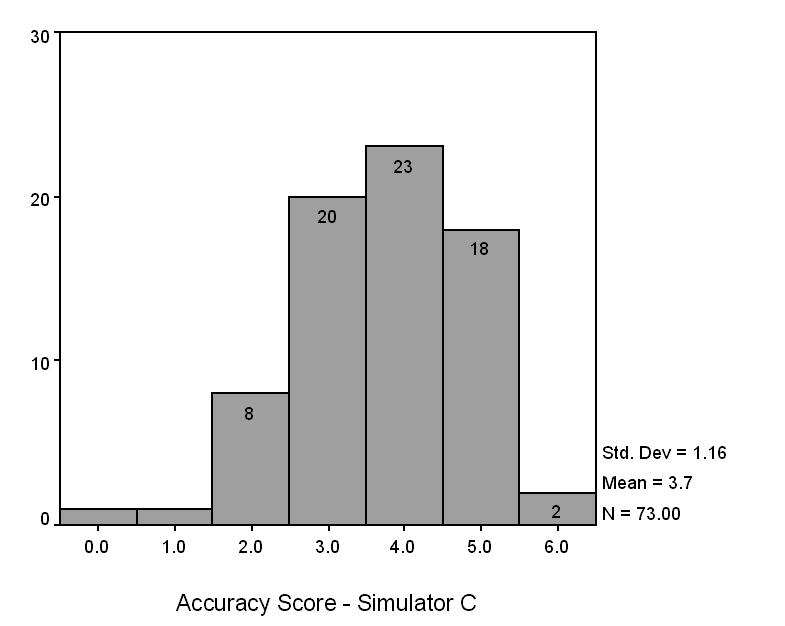
Accuracy scores for simulators A, B, and C.
Analysis of Simulator Variables
The three simulators represent a sample of three clinical presentations from a universe of possibilities. The reliability coefficients (Cronbach’s alpha) for the simulator variables were as follows: time = 0.7240, critical areas = 0.6329, maximum pressure = 0.7701, and frequency = 0.5011. The reliability coefficient for student accuracy was equal to 0.6007. The major limitation in achieving reliability scores of .8 or better was the number of simulators used in the study. Applying the Spearman-Brown prophecy formula to the lowest reliability coefficient (frequency = 0.5011), twelve different simulators would have been required to meet the 0.8 criteria.
Correlations
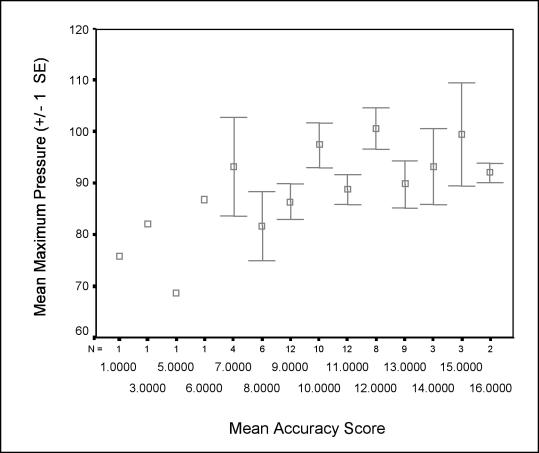
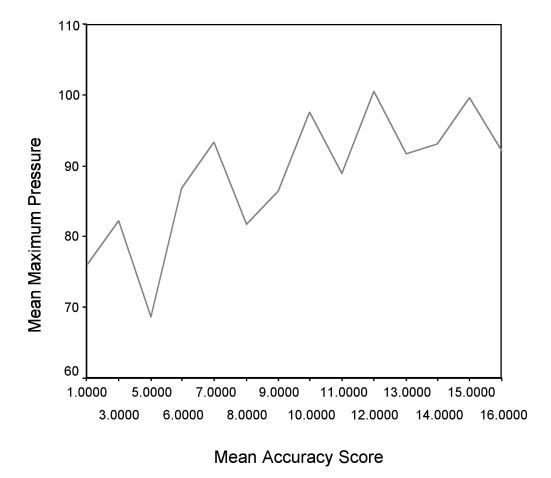
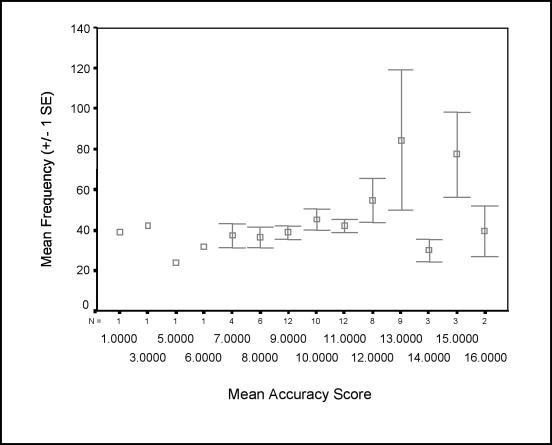
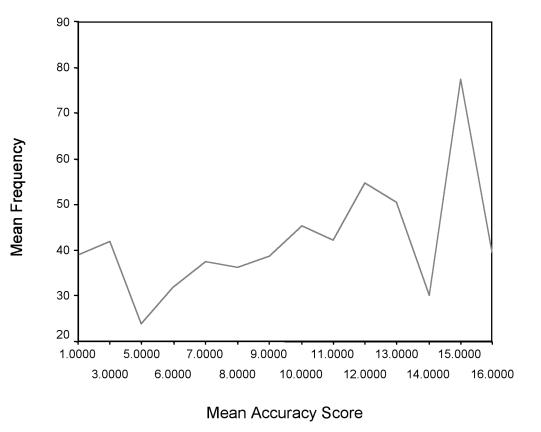
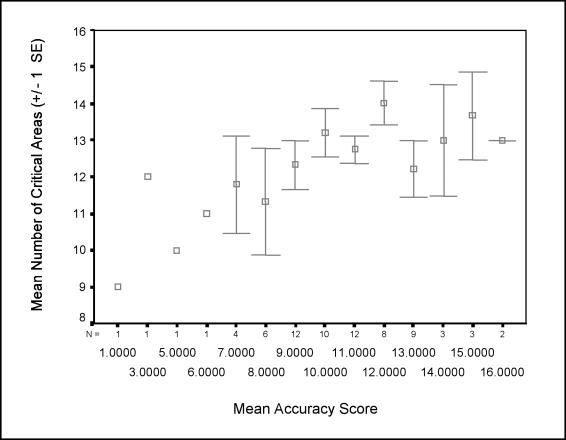
Correlation analyses between accuracy of the student’s written clinical assessments and the four simulator variables showed significant, positive correlations for three of four comparisons. Significant correlations for the simulator variables with the accuracy variable were: critical areas, r = 0.311, p = 0.007; maximum pressure, r = 0.279, p = 0.017, and frequency, r = 0.267, p = 0.022. The time variable did not correlate significantly with the accuracy variable (Table 1▶).
Table 1 .
Summary of Correlations for the Accuracy Variable and the Simulator Variables
| Accuracy | Time | Critical Areas | Maximum Pressure | Frequency | |
|---|---|---|---|---|---|
| Accuracy | |||||
| Pearson correlation | 1.000 | 0.050 | 0.311** | 0.279* | 0.267* |
| Sig. (2-tailed) | 0.673 | 0.007 | 0.017 | 0.022 | |
| N | 73 | 73 | 73 | 73 | 73 |
| Time | |||||
| Pearson correlation | 0.050 | 1.000 | 0.312** | 0.326** | 0.284* |
| Sig. (2-tailed) | 0.673 | 0.007 | 0.005 | 0.015 | |
| N | 73 | 73 | 73 | 73 | 73 |
| Critical areas | |||||
| Pearson correlation | 0.311** | 0.312** | 1.000 | 0.897** | 0.509** |
| Sig (2-tailed) | 0.007 | 0.007 | 0.000 | 0.000 | |
| N | 73 | 73 | 73 | 73 | 73 |
| Maximum pressure | |||||
| Pearson correlation | 0.279* | 0.326** | 0.897** | 1.000 | 0.545** |
| Sig. (2-tailed) | 0.017 | 0.005 | 0.000 | 0.000 | |
| N | 73 | 73 | 73 | 73 | 73 |
| Frequency | |||||
| Pearson correlation | 0.267* | 0.284* | 0.509** | 0.545** | 1.000 |
| Sig (2-tailed | 0.022 | 0.015 | 0.000 | 0.000 | |
| N | 73 | 73 | 73 | 73 | 73 |
*Correlation is significant at the 0.05 level (2-tailed).
**Correlation is significant at the 0.01 level (2-tailed).
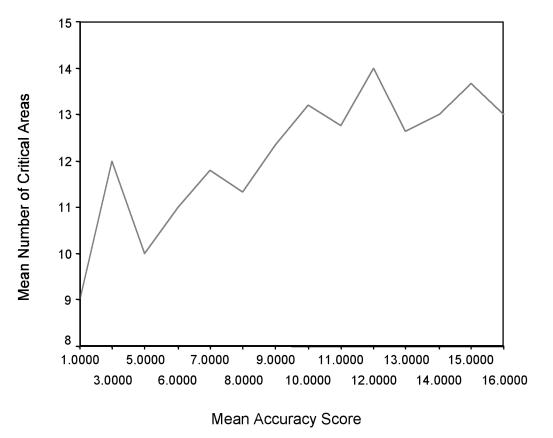
Figures 11, 12, and 13▶▶▶demonstrate the significant, positive correlations between the simulator variables and accuracy.
Figure 11 .
A, Standard error plot of mean accuracy score by mean maximum pressures. B, Line graph of mean accuracy score by mean maximum pressures.
Figure 12 .
A, Standard error plot of mean accuracy score by mean frequency. B, Line graph of mean accuracy score by mean frequency.
Figure 13 .
A, Standard error plot of mean accuracy score by mean critical areas. B, Mean accuracy score by mean critical areas.
Discussion
Interpretation of Results
This study focused on the development and initial validation of an innovative approach to assessing medical students’ female pelvic examination skills, using a pelvic simulator. To demonstrate the concurrent validity of the simulator, we compared student performance on written clinical assessments with computer generated performance data. Exam performance on the simulator was determined using four newly defined performance indicators: time to perform a complete exam, the number of critical areas touched during the exam, the maximum pressure used, and the frequency at which these areas were touched. Results showed that three of the four indicators were significantly and positively correlated with performance on the written clinical assessments. Students who touched more critical areas, with greater frequency and maximum pressures also had higher scores on their written clinical assessments. It is reasonable to expect that the fourth indicator—time to perform the complete exam—would not be correlated with accuracy, as some novice examiners may require more time to conduct a thorough examination compared to their more efficient colleagues.
Objective Assessment of Technical Skills
Our results support the use of simulators for objective assessment of technical skills. The three most important characteristics of any assessment instrument, or test, are objectivity, reliability and validity.24Until recently, these have been difficult to achieve in assessing the technical clinical skills of medicine.25Development of surgical and procedural patient simulators such as the E-Pelvis now make it possible to assess students’ clinical skills with greater objectivity and reliability.1,26,27Test reliability is “the degree to which a test consistently measures whatever it measures.”24The results of this study suggest the E-Pelvis simulator does indeed measure students’ physical examination skills more reliably than traditional observation dependent measures by recording the students’ actual palpations during the exam.
Validity remains the most challenging issue-how well does the simulator measure what it intends to measure? In medical education it is generally accepted that performance measures are more appropriate for assessing clinical and procedural skills than written exams or knowledge tests.25However, identification of clinical findings requires both technical skill in palpating the tissue and cognitive skill in recognizing normal and abnormal anatomy. In essence, a pelvic exam simulator may be a more valid measure of clinical and technical skills than examining live, simulated patients, in that simulated patients are not able to demonstrate a range of clinical abnormalities or pathologies.
Advantages for Students
Use of patient simulators such as the E-Pelvis offer students some distinct advantages over live, simulated patients, in that the simulator affords students unlimited opportunities for practice and self assessment of their pelvic examination skills—a rare opportunity in most medical schools today. Moreover, well-designed scoring systems will provide corrective feedback to help students learn from their mistakes. Simulators thus enable emphasis on frequent formative assessment of clinical skills in contrast to the high stakes summative and subjective assessments used in medical training today.
Limitations
Although the E-Pelvis appears to be a useful teaching and assessment tool, it does not obviate the necessity for hands-on experience with real patients. Because mannequin based simulators are made with plastics and other materials, the ability to accurately simulate anatomy and pathology is limited. Despite these limitations, in our experience, students who have practiced on a simulator are more knowledgeable, confident, and skilled during their first patient experience.28This enables them to fine-tune their skills with every exam instead of making basic mistakes during the encounter thus preventing undue distress and harm to the patient.
Development of Simulation Metrics
This research is directly relevant to developers of virtual reality surgical simulators who are concerned with designing the most appropriate scoring systems for their simulators. Some researchers have focused on recording the hand and arm movements the surgeon makes in reference to an instrument,29whereas others focus on the “operative outcome” or end result, such as the quality of an anastomosis.30The research reported here suggests it is equally or more important to capture data representing how the user interacts directly with the tissues- either by direct contact (hand to tissue) or by instrument contact with the tissues (instrument to tissue).By placing sensors on the tissues being manipulated, the data that are captured are more specific to the procedure being performed than to the physical attributes of the user or how a user interacts with an instrument. Performance data generated from the actual manipulation of organs and tissues enable users to focus on the individual steps of a procedure. For example, in addition to receiving feedback on the quality of an anatomosis, the user will be able to receive specific feedback on the characteristics and quality of suture placement during the anastomosis. The additional feedback affords users the opportunity for corrective feedback during the execution of a task, which is more valuable for learning and remediation than receiving feedback upon task completion.
New Methods of Analyzing Raw Numerical Data Generated from a Simulator
Perhaps the most significant contribution of this study is the approach taken in defining the novel performance indicators from large amounts of computer generated simulator data. Qualitative analysis of the line graphs enabled us to identify important exam characteristics that might represent differences in performance. Identification of these characteristics was required to identify the most relevant variables that would serve as appropriate indicators of performance. Others replicating this study may have chosen different variables as the most relevant performance indicators for this clinical skill. For example, some may have included the sequence of palpations and manipulations as an important indicator of examination skill. In addition, the variables could be operationally defined in many different ways. Our approach represents a first step by which future methods may be compared.
Future Work
The four performance variables we have defined in this paper are just a beginning. Future work will focus on analyzing the simulator data to discover other variables that may be used for assessment purposes, thus enhancing the validity and reliability of the E-Pelvis simulator as an assessment tool. Automated methods of data analysis using pattern recognition and signal processing programs will facilitate development of new variables and strengthen the data analysis process by making it more efficient and standardized. Although we have also demonstrated, in previous work, that the skills learned on the E-Pelvis are appropriate and transferable to real-life patient examinations, more work needs to be done in this area.28
Conclusion
Although simulation has been used in medical education for many years for both training and assessment purposes, it is now a rapidly expanding rapidly area, as computer technology makes it possible to more accurately simulate many procedures. As developers continue their work on next-generation virtual reality simulators, medical educators must continue to define and develop next-generation assessment measures.
Acknowledgments
The authors thank the following persons for their invaluable con-tributions to this work: Parvati Dev, PhD, Sakti Srivastava, MD, Chantal Rawn, BS, Beth Scarloss, PhD, Teresa Cotner, PhD, Richard Shavelson, PhD, Decker Walker, PhD, Merry Kuo, MS, Thomas M. Krummel, MD, and William Leroy Heinrichs, MD, PhD.
References
- 1.Satava RM. Accomplishments and challenges of surgical simulation. Surg Endosc. 2001; 15(3): 232–41 [DOI] [PubMed] [Google Scholar]
- 2.Kapur PA Steadman RH. Patient simulator competency testing: ready for takeoff? Anesth Analg. 1998; 86(6): 1157–9. [DOI] [PubMed] [Google Scholar]
- 3.Gallagher AG, Richie K, McClure N, McGuigan J. Objective psychomotor skills assessment of experienced, junior, and novice laparoscopists with virtual reality. World J Surg 2001; 25(11):1478–83. [DOI] [PubMed] [Google Scholar]
- 4.Smith S, Wan A, Taffinder N, et al. Early experience and validation work with Procedicus VA—the Prosolvia virtual reality shoulder arthroscopy trainer. Stud Health Technol Inform. 1999; 62:337–43. [PubMed] [Google Scholar]
- 5.Larsson A. An open and flexible framework for computer aided surgical training. Stud Health Technol Inform. 2001; 81:263–5. [PubMed] [Google Scholar]
- 6.Edmond CV Jr, Wiet GJ, Bolger B. Virtual environments. surgical simulation in otolaryngology. Otolaryngol Clin North Am. 1998 Apr; 31(2):369–81. [DOI] [PubMed]
- 7.Bates B. Bates’ Guide to Physical Examination and History Taking, 7th ed. Philadelphia, Lippincott, 1999.
- 8.Siedel, Ball, Dains, Benedict. Mosby’s Guide to Physical Examination. St. Louis, Mosby, 1987, pp 407–445.
- 9.Danforth DN, Scott JR. Obstetrics and Gynecology, 5th ed. Philadelphia, JB Lippincott, 1986: 2–22
- 10.Abraham S. Vaginal and speculum examination in medical curricula. Aust N Z J Obstet Gynaecol 1995; 35(1): 56–60. [DOI] [PubMed] [Google Scholar]
- 11.Buchwald J. The first pelvic examination: helping students cope with their emotional reactions. Med Educ, 1979; 54(9): 725–8. [PubMed] [Google Scholar]
- 12.Billings JA, Stoeckle JD. Pelvic examination instruction and the doctor-patient relationship. Med Educ 1977; 52(10): 834–9. [DOI] [PubMed] [Google Scholar]
- 13.Sanfilippo JS, Masterson BJ. Teaching medical students gynecologic history and physical examination. J Ky Med Assoc 1984; 82(2): 80–1. [PubMed] [Google Scholar]
- 14.Schindler AE. Pelvis examination model “Gynny” for instruction of students. Medizinische Welt 1976; 27(49): 2404–5. [PubMed] [Google Scholar]
- 15.McFaul PB, Taylor DJ, Howie PW. The assessment of clinical competence in obstetrics and gynaecology in two medical schools by an objective structured clinical examination. Br J Obstet Gynecol 1993; 100(9):842–6. [DOI] [PubMed] [Google Scholar]
- 16.Wallis LA. A quiet revolution. J Am Med Womens Assoc. 1984; 39(2): 34–5. [PubMed] [Google Scholar]
- 17.Beckmann CR, Sharf BF, Barzansky BM, Spellacy WN. Student response to gynecologic teaching associates. Am J Obstet. Gynecol. 1986; 155(2): 301–6. [DOI] [PubMed] [Google Scholar]
- 18.Kretzschmar RM. Why not in every school? J Am Med Womens Assoc 1984; 39(2): 43–5. [PubMed] [Google Scholar]
- 19.Holzman GB, Singleton D, Holmes TF, Maatsch JL. Initial pelvic examination instruction: the effectiveness of three contemporary approaches. Am J Obstet Gynecol. 1977; 129(2): 124–9. [DOI] [PubMed] [Google Scholar]
- 20.Shain RN, Crouch SH, Weinberg PC. Evaluation of the gynecology teaching associate versus pelvic model approach to teaching pelvic examination. Med Educ 1982; 57: 646–8. [DOI] [PubMed] [Google Scholar]
- 21.Macintosh MC, Chard T. Pelvic manikins as learning aides. Med Educ 1997; 31(3): 194–6. [DOI] [PubMed] [Google Scholar]
- 22.Rakestraw PG, Vontver LA, Irby DM. Utilization of an anthropomorphic model in pelvic examination instruction. Med Educ 1985; 60(4):343–5. [DOI] [PubMed] [Google Scholar]
- 23.Pugh CM, Heinrichs WL, Dev P, et al. Use of a mechanical simulator to assess pelvic examination skills. JAMA 2001; 286(9):1021–3. [DOI] [PubMed] [Google Scholar]
- 24.Gay LR. Educational Evaluation and Measurement: Competencies for Analysis and Application, 2nd ed. Columbus, OH, Charles E. Merrill, 1985.
- 25.Neufeld VR, Norman GR (ed.). Assessing Clinical Competence. New York, Springer, 1985.
- 26.Darzi A, Mackay S. Assessment of surgical competence. Qual Health Care 2001; 10 (Suppl 2): 64–9. [DOI] [PMC free article] [PubMed] [Google Scholar]
- 27.Cuschieri A. Reflections on surgical training. Surg Endosc 1993; 7: 73–4. [DOI] [PubMed] [Google Scholar]
- 28.Pugh CM, Srivastava S, Shavelson R, et. al. The effect of simulator use on learning and self-assessment: The case of Stanford University’s E-Pelvis simulator. Stud Health Technol Inform. 2001; 81:396–400 [PubMed] [Google Scholar]
- 29.Datta V, Mackay S, Mandalia M, Darzi A. The use of electromagnetic motion tracking analysis to objectively measure open surgical skill in the laboratory-based model. J Am Coll Surg 2001;193(5):479–85. [DOI] [PubMed] [Google Scholar]
- 30.Szalay D, MacRae H, Regehr G, Reznick R. Using operative outcome to assess technical skill. Am J Surg 2000; 180:234–7. [DOI] [PubMed] [Google Scholar]


