Abstract
The analytical representation and simulation of complex molecular pathways can contribute to understanding and evaluating physiological as well as pathological processes. We are interested in modeling the processes of menopause to stratify women in terms of the genotypic and environmental components and their implications for development of individualized risk of postmenopausal disorders, e.g., breast and ovarian cancer, cardiovascular disease, and osteoporosis. We have initiated this study using the UltraSAN package to analyze the pathway associated with estrogen production. This model incorporates detailed information about the hormone factors affecting estrogen production, and the simulations carried out are based on published experimental data corresponding to hormone levels during the course of the normal female reproductive cycle. The agreement between the experimental data and the simulation is typically less than 2 ng/ml or 2 pg/ml respectively for progesterone and estradiol output. This approach further permits inclusion of information about an SNP observed in the gene coding for the enzyme aromatase as a model to study the impact of reduced enzymatic activity on hormone levels.
The timeframe of reproductive potential in the human female is marked by its beginning, termed “menarche,” at approximately age 12, and continues until “menopause,” at approximately age 51. This 39-year timeframe is modulated individually by an approximate 30-day hormonal cycle and normal accretion of hormonal changes that occur over time along with interaction with environment and lifestyle. In addition, pregnancy, childbirth, and lactation, to name only a few natural events, produce significant impact beyond the normal aging process itself. Limited quantitative analysis of this normal progression, beyond measurement of serum hormone levels as a woman approaches menopause, has been carried out. An accurate quantitative model of this process would be invaluable in assessing an individual’s risk for breast cancer, ovarian cancer, cardiovascular disease, osteoporosis, and Alzheimer’s disease, in evaluating fertility and infertility issues, as well as suitability for hormone replacement therapy, and in providing insight into the interactions of these endocrine effects on other endocrine-sensitive processes, including diabetes, psychological responses, and other responses to environment and lifestyle. As data from the human genome project become available, revealing presence of polymorphisms at an individual’s enzyme level, it is of particular interest to initiate methods for representation and simulation of the underlying molecular processes so that even rational qualitative reasoning can be made available for use in diagnosing and evaluating the impact of aging of the female reproductive system on general health issues.
Background
The female reproductive aging is a continuous process beginning early in a woman’s life and gradually leading to its final stage, menopause. The hallmark of menopause is a major decline in ovarian function manifested by a marked decrease in estrogen production. The onset of menopause follows gradual changes in the menstrual cycle that define the so-called perimenopausal period, accompanied by gonadotropin hormone changes (mainly an increase in follicle-stimulating hormone [FSH]). The transition from normal menstrual cycles to peri- and subsequently post-menopause lays the ground for disorders (breast and ovarian cancer, heart disease, osteoporosis), according to genetic and environmental factors determining individual disease predisposition. At the center of the pathogenetic mechanisms of postmenopausal diseases lies estradiol, which predisposes to certain conditions and protects from others.1,2 Understanding and modeling the hormonal changes during the normal menstrual cycle and then extending the model to include peri- and post-menopause are essential to accurately evaluate estrogen production and assessing individual disease risks.
Only a few published papers focus on modeling the menstrual cycle.3–8 These studies use differential equations to describe estradiol and progesterone concentrations changing upon FSH and luteinizing hormone (LH) gonadotropin-dependent regulation. These modeling approaches attempt to establish a basis to quantitatively associate steroid hormone levels to FSH and LH concentrations, without considering in detail the molecular pathways involved in hormonal control, and without including the enzymes responsible for steroid hormone production into their models.
In this study we have applied stochastic activity nets9,10 as a means for representing the pathway and its components and interactions, and simulating its response in both normal cycling and abnormal cycling.
The Normal Menstrual Cycle
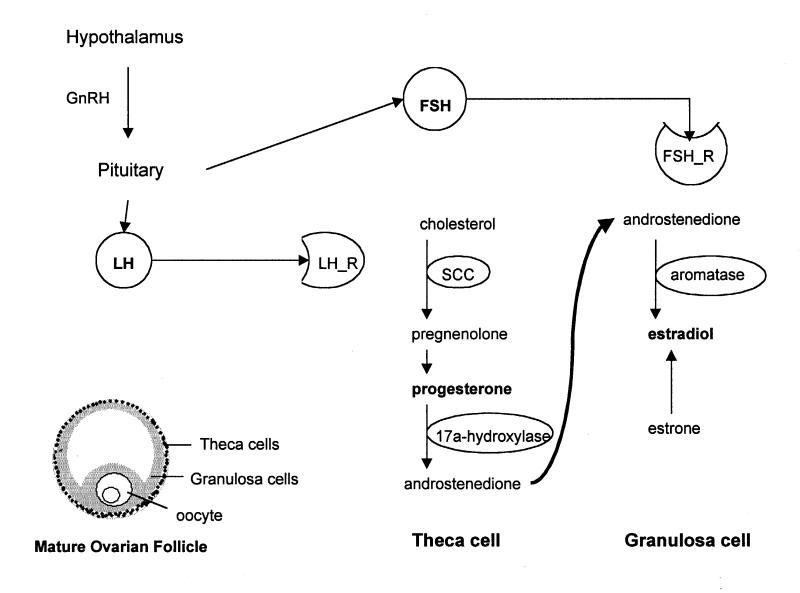
The normal menstrual cycle involves three successive phases: follicular, periovulatory, and luteal. The estradiol and progesterone produced in the ovary in each phase are tightly controlled by the gonadotropin pituitary hormones FSH and LH, as well as by local ovarian factors such as inhibin and activin. Hypothalamus also plays a role through gonado-tropin-releasing hormone (GnRH) release. Together, the ovaries, pituitary and hypothalamus constitute the so-called hypothalamic-pituitary-ovarian axis (Figure 1▶), which specifies the function of the menstrual cycle through a network of elaborate feedback circuits.11 Menses coincides with the beginning of the follicular phase. At the beginning of the cycle, circulating levels of estrogen and progesterone are low, signaling the hypothalamus-pituitary axis to release large amounts of FSH. FSH initiates the process of follicular maturation, which produces increasing amounts of estrogen. At the end of the follicular phase, the primordial follicle has matured in preparation for the release of the oocyte. During periovulation, a surge in LH levels coincides with the release of the oocyte. LH stimulates the residual ovarian follicle, transforming it into the corpus luteum. The luteal phase follows, with increased progesterone secretion from the corpus luteum. If fertilization of the oocyte does not occur, estrogen and progesterone levels drop, the corpus luteum dissolves through controlled cell death (apoptosis) mechanisms, and the cycle is re-entered. More than 95% of the circulating estradiol comes from the dominant (mature) follicle and the corpus luteum. Most of the remaining amount is derived from estrone conversion in tissues other than ovarian.
Figure 1 .
The mature ovarian follicle contains the two cell types responsible for estradiol and progesterone production. Theca cells produce progesterone and androgens. Androstenedione is retrieved by granulosa cells and converted to estradiol. The enzymes responsible for these processes are shown inside ovals. Theca cells express LH receptors (LH_R) and respond to LH released by the pituitary gland. Similarly, granulosa cells have receptors (FSH_R) for the pituitary hormone FSH. FSH and LH release is regulated by the hypothalamic hormone GnRH.
The process of follicle maturation, oocyte release, and consequent formation of corpus luteum gives rise to a variety of structures and cell types. Two cell types, granulosa and theca cells, play a central role in ovarian steroidogenesis (Figure 1▶).12 The granulosa cells reside in the stratum granulosum of the mature follicle, and are equipped with an estradiol-producing enzymatic machinery. They also express FSH receptors on their plasma membrane, and they are therefore sensitive to FSH stimulation. The theca cells are located in a zone (theca) that surrounds the granulosa-rich area. These cells respond to LH (they express the appropriate receptors) and convert cholesterol to progesterone and androgens. According to the two-gonadotropin two-cell model of estrogen production, the LH-responsive theca cells produce androstenedione and testosterone, with the cholesterol-to-pregnenolone conversion being the rate-limiting step of the whole process. This conversion depends on the enzyme p450SCC, whose expression is positively regulated by LH. The theca-produced androgens serve as substrates for estradiol and estrone production by the granulosa cells. The conversion of androgens to estrogens in these cells depends on the enzyme aromatase, whose expression is positively regulated by FSH during follicle growth. After ovulation, androgen, estrogen and progesterone production is sustained by the cells in the corpus luteum, which are responsive to LH and express all enzymes necessary for the above processes.
The estrogen production is not a simple linear process starting from cholesterol and stopping to estradiol. Instead, there are at least two positive and one negative feedback responses. The negative feedback response comes from estradiol-dependent inhibition of FSH actions, when estradiol levels are very high. The two positive feedback loops involve estradiol (which promotes its own production as well as progesterone’s production when present in low-to-moderate amounts), and progesterone, which up-regulates its own concentration.13
Perimenopausal Cycles and the Menopause
The number of ovarian premature follicles is fixed at birth and gradually decreases each time follicles mature and release oocytes. At perimenopause, the follicular number has decreased substantially, and those present respond poorly to FSH and LH, resulting in cycle irregularity and erratic ovulation.14 There is gradual decrease in progesterone and estrogen, but hormone fluctuations are common. This period can last from 3-10 years before menopause. Irregular menstrual cycles are the most common first sign of perimenopause, along with increasing levels of FSH. As the number of follicles keeps decreasing, estrogen production continues to fall. At some point, the estrogen-based feedback mechanisms associated with LH secretion are disrupted, leading to non-ovulatory cycles. At the onset of menopause, when ovulation ceases entirely, LH starts rising again.
Menopause is due mainly to declining ovarian function, as the pool of primordial follicles is exhausted. The feedback control mechanisms of the hypothalamic-pituitary-ovarian axis are disrupted, leading to increased levels of FSH, but with unchanged levels of hypothalamic GnRH. Estradiol and progesterone production is sharply reduced due to cessation of the menstrual cycle and mature follicular development.15 The increased levels of FSH have no effect on estrogen production, because there is limited expression of FSH receptors in the follicles, rendering them insensitive to FSH. Ovarian steroidogenesis during menopause is restricted to androgen production. It is established that menopausal theca cells are responsive to LH and produce androstenedione and testosterone. Most of the circulating androgens come from the adrenal gland. During menopause, estrone is exclusively produced at remote sites (mainly adipose tissue) by the conversion of androstenedione. The rate of this conversion correlates to body size (amount of adipose tissue).
Introduction to Stochastic Activity Networks
Our interest in the quantitative evaluation of complex biological processes such as the menstrual cycle requires the need to develop flexible models that enable accurate representation of the underlying biological pathways, through incorporation of only a limited amount of data. This ability is typically necessary in dealing with biological pathways because of the potential lack of complete information about all components and their interactions, as well as limited experimental observations, measured under a variety of conditions and of varying potential quality. Stochastic activity networks, a stochastic extension of Petri nets, are appropriate for modeling such processes that can be viewed as discrete-event systems of probabilistic nature. In this study, stochastic activity networks have been implemented using the UltraSAN software environment, which allows for representation and modeling of biological pathways that can be either simulated or solved analytically.16,17 The user’s manual and information about how to retrieve the software are available at www.crhc.uiuc.edu/UltraSAN.
We have previously evaluated the use and sensitivity of this approach in studying the behavior of normal and abnormal coagulation processes.10 UltraSAN was originally developed as a tool for model-based performance and dependability evaluation of computer and communication systems, and was later used for modeling purposes in biology and biomedical research.9,10,18,19 The UltraSAN environment contains five process elements: places, activities, gates, arcs and tokens. Places appear graphically as circles and represent the state of the modeled system. In terms of biological pathway modeling, places correspond to molecular species such as enzymes and hormones. Places contain tokens that correspond to numbers of molecules. The number of tokens defines the marking of the place, which is always a discrete number. Activities (hollow ovals) represent actions of the modeled system that take a nondeterministic amount of time to complete. The duration of the activities is controlled by a probability distribution function, which can depend on place markings. The activities allow the flow of tokens from places that are connected at their left side, to places connected to the right. Gates (triangles) are distinguished in input and output gates that include predicates and functions. In specific, input predicates define the conditions upon which the activities are enabled, and the functions of both gate types determine the marking changes occurring in places connected to activities, after these activities complete. Arcs are used to connect the components to one another in an orderly fashion.
As a stochastic activity network executes, it undergoes state (marking) changes according to a marking change algorithm. The steps for implementing this algorithm are:
The predicates of the input gates and the markings of the places are examined.
Activities are enabled if the predicates of the connected input gates are true, and only when there is at least one token to each of the incoming connected places. These conditions should be true throughout the duration of the activity time for the activity to complete. The order of priority with which the activities are enabled and executed, depends on their probability distribution functions.
After activity completion, the connected input places have their marking decremented.
All the input gate functions are executed.
All the connected output places have their marking incremented.
The functions of the connected output gates are executed.
In the UltraSAN environment, the user monitors certain important parameters of the modeled system (such as hormone concentrations or enzymatic activity) by declaring reward variables, which can relate to place markings or activity durations. During analytical solution or simulation of the network, UltraSAN estimates and provides the mean and variance for each reward variable over a period of time.
Modeling the Menstrual Cycle in Young, Perimenopausal and Menopausal Women
The first step in modeling the menstrual cycle is to represent the enzymatic pathway leading to progesterone and estrogen production. We performed a thorough search of the literature in order to get accurate information about the substrates and enzymes involved in this pathway. We also used information available at the KEGG pathway database <www.genome.ad.jp/kegg/pathway/map/map00150.html>.
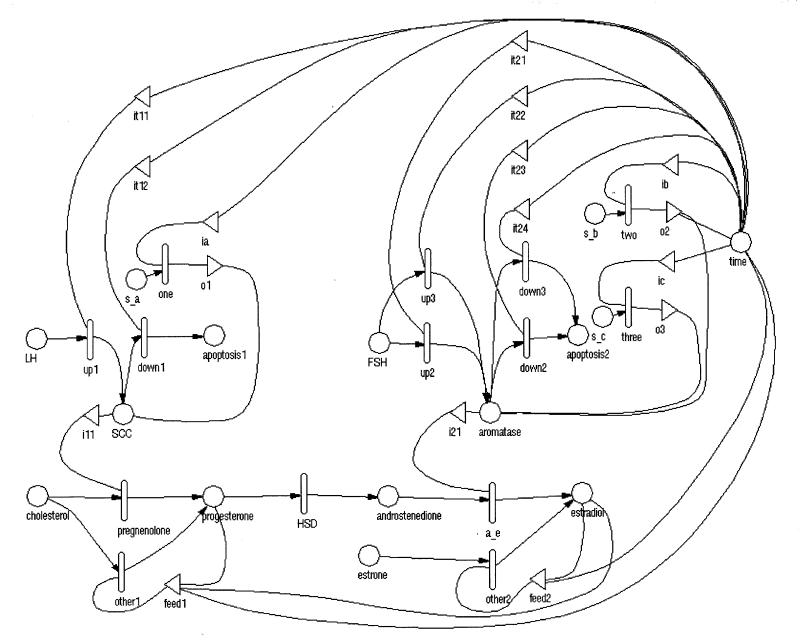
After gathering the information, the initial objective was to represent the estradiol and progesterone production pathway in terms of stochastic activity net methodology, and incorporate the information about the FSH and LH contributions to the control of enzymatic activity (Figure 2▶). The enzymes and hormones are represented as places (circles). Activities enable the flow of tokens from substrate to product for each reaction. They are enabled only when the input places have more than zero tokens.
Figure 2 .
Stochastic activity network representation of the estradiol and progesterone production.
The default behavior in UltraSAN is to reduce the tokens in the input places. Since this is not a desirable behavior for enzymes (their concentration should not be consumed), there is a gate next to each enzyme place, ensuring non-consumption. For simplicity purposes, pregnenolone and 17 alpha-hydroxylase are not introduced as places in the model: they are used to name activities instead.
All activities are chosen to have exponential probability distribution functions, with rates depending on each occasion. The activities that control conversion from one hormone to another have rates proportional to the input enzyme levels.
According to the two-cell two-gonadotropin theory, the rate-limiting step of the cholesterol-to-progesterone conversion is controlled by LH, and the conversion of androstenedione to estradiol depends on FSH. These control mechanisms are modeled by introducing the place “LH” connected to p450SCC, and the place “FSH” connected to aromatase.
Normal Menstrual Cycle—Results
From what is known about the normal menstrual cycle, it is evident that it is a discontinuous process. It can be considered as a discrete event-driven system, where the events determining the transitions from state to state reflect ovarian processes such as follicle growth, ovulation, luteal growth, and apoptosis. In specific, the development of progesterone and estrogen production during the menstrual cycle can be divided into four distinct periods of time corresponding to the ovarian events mentioned above.
Stochastic activity network modeling allows the introduction of input gates that control the transition from one state to another through the use of predicates. These predicates include statements referring to specific time periods, and enable initiation and completion of the appropriate activities, when their conditions are satisfied. It is also necessary to consider time as a separate “place” in the model, in order to “inform” the input gates about what time point is visited each time the stochastic activity net executes. It is also helpful to introduce the activities named “one,” “two,” and “three,” to ensure smooth transition from a time period to another by informing the model which was the resulting state of the previously visited time period.
The input gates in this model are defined with respect to the four distinct time periods of the cycle. The first time period extends from day 1 to day 12 of the cycle, and involves progressive growth of the maturing follicle in an FSH-dependent manner. This growth results in the exponential increase of the number of granulosa cells in the follicle, which produce aromatase, responsible for the conversion of androgens to estradiol. This is reflected in the model, by selecting an exponential probability distribution function for the activity “up2,” with rate of the form: N* (2^t) where N = number and t = time (Table 1▶). This activity controls the increase of aromatase concentration in response to FSH.
Table 1 .
Modeling Parameters for the Stochastic Activity Network in Figure 2▶
| Place Names | Initial Markings | Input Gates | Predicates |
|---|---|---|---|
| androstenedione | 0 | it11 | MARK(time)>12 && <19 |
| aromatase | 5 | it12 | MARK(time)>=19 |
| apoptosis1,2 | 0 | it21 | MARK(time)<13 |
| cholesterol | 100 | it22 | MARK(time)>15 && <20 |
| estradiol | 0 | it23 | MARK(time)>=20 |
| estrone | 0 | it24 | MARK(time)>12 && <=15 |
| FSH | 100 | feed1,2 | MARK(time)>13 |
| LH | 100 | ||
| progesterone | 0 | ||
| s_a,b,c | 1 | ||
| SCC | 40 | ||
| time | GLOBAL_S(cycle_days) |
| Activity Names | Rates |
|---|---|
| a_e | 0.04* MARK(aromatase) |
| HSD | 4 |
| pregnenolone | 0.2* MARK(SCC) |
| up1 | 0.5* pow(2, MARK(time) – 12) |
| up2 | 0.1* pow(2, 0.5* MARK(time)) |
| up3 | 2 – 0.5* exp(–MARK(time) + 14) |
| down1 | pow(2, 0.7* (MARK(time) – 18)) |
| down2 | 0.1* pow(2, 0.7* (MARK(time) – 20)) |
| down3 | 0.1* (MARK(time) – 12) |
| other1,2 | 0.2 |
| one, two, three | 1000 |
During ovulation, the structure of the follicle is disrupted and the oocyte is released. During this process, the estradiol levels fall abruptly (day 13 to day 15). The activity “down3” controls the down-regulation of aromatase during these cycle days, with rate proportional to time (Table 1▶).
After day 15, the residual follicular body is transformed to the corpus luteum. The corpus luteum cells start to produce increasing amounts of the enzyme p450SCC as well as aromatase, resulting in a limited increase in estradiol and a major increase in progesterone levels. Progesterone production depends on LH, and is controlled by activity “up1” at an exponential rate. Estradiol levels increase moderately and soon achieve plateau levels. This behavior is accurately modeled by introducing the activity “up3” with rate of the form 2-N*exp(-t) where N = number and t = time (Table 1▶).
At this time period another feature, involving feedback loops, is added to the model. In particular, there is a positive self-regulation mechanism involving estradiol, and another one for progesterone. These interactions are modeled by introducing feedback circuits. These feedback interactions are modeled by connecting estradiol and progesterone places directly to enzymatic activities, and not indirectly, through interaction with FSH and LH sub-circuits.
After day 20, the enzymatic activities of the corpus luteum gradually dissipate, resulting in down-regulation of both progesterone and estradiol levels. The biological reason for this behavior is the triggering of controlled death mechanisms (apoptosis) that lead to gradual degradation of the corpus luteum structure and function. The reduced enzymatic levels are modeled by the routes “activity (down1)—place (apoptosis1)” for p450SCC, and “activity (down2)—place (apoptosis2)” for aromatase.
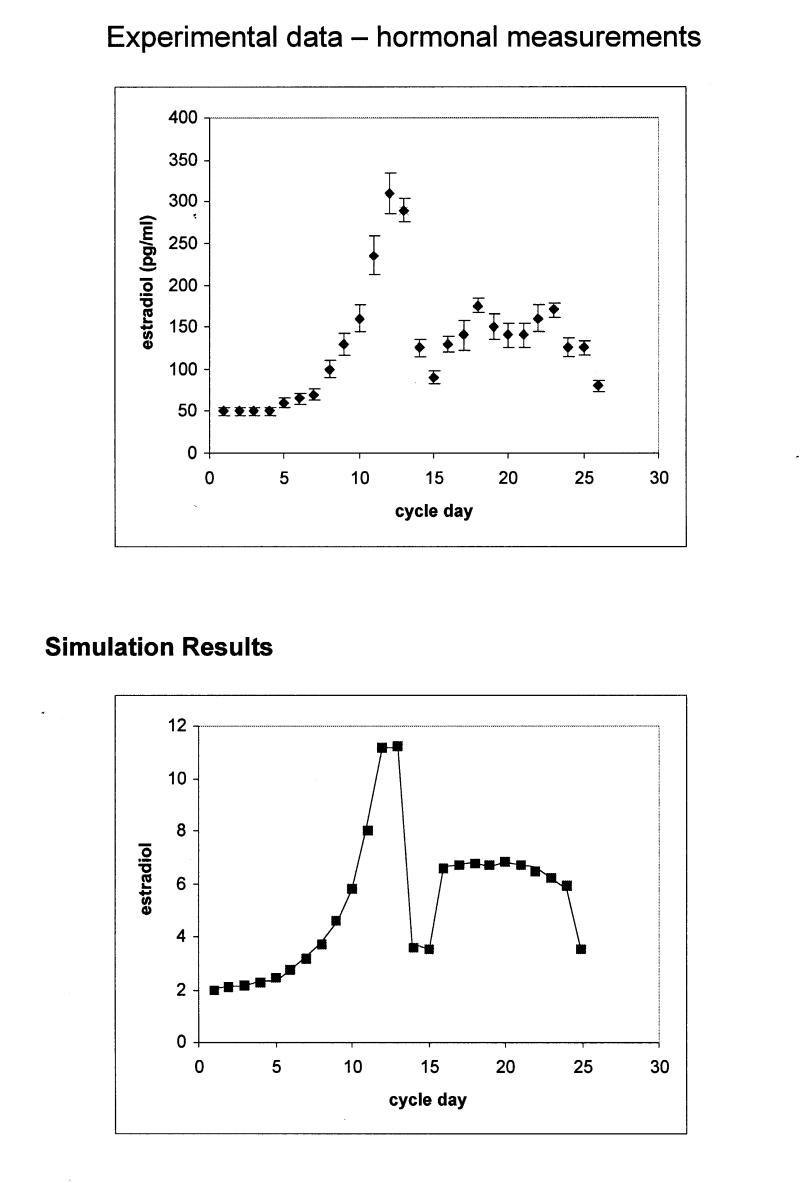
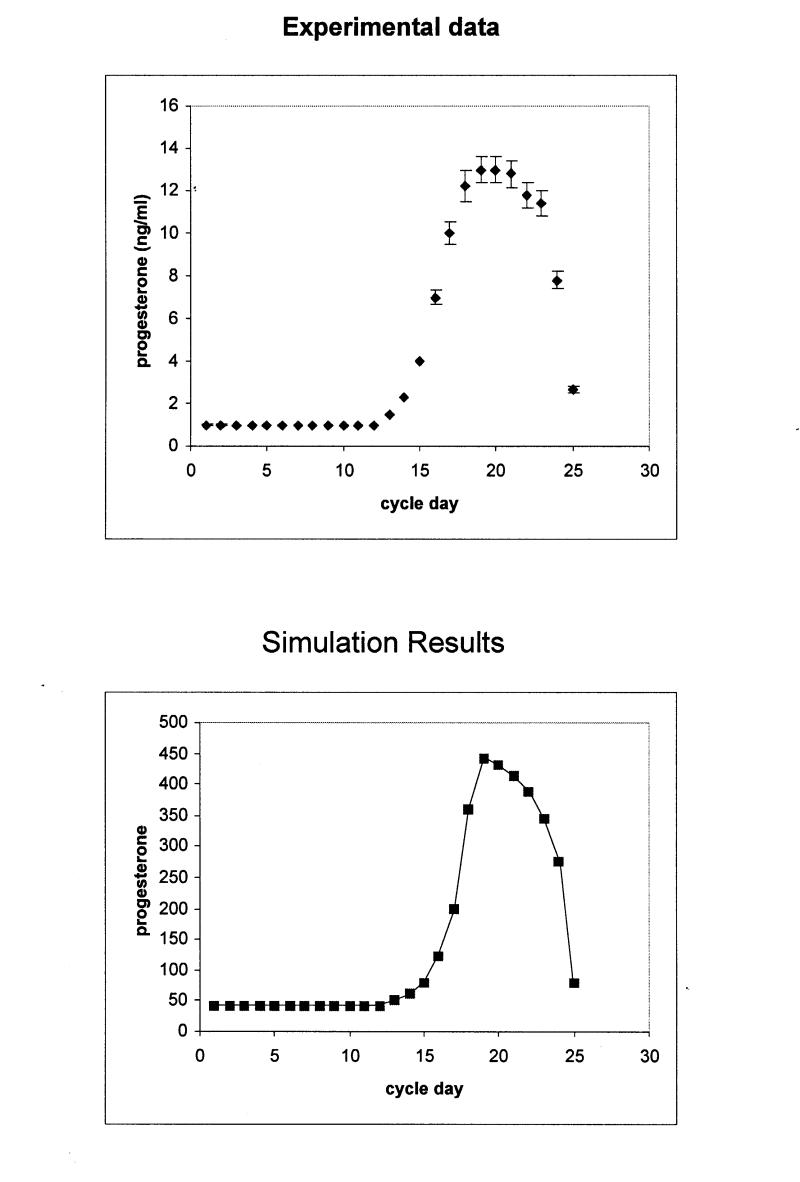
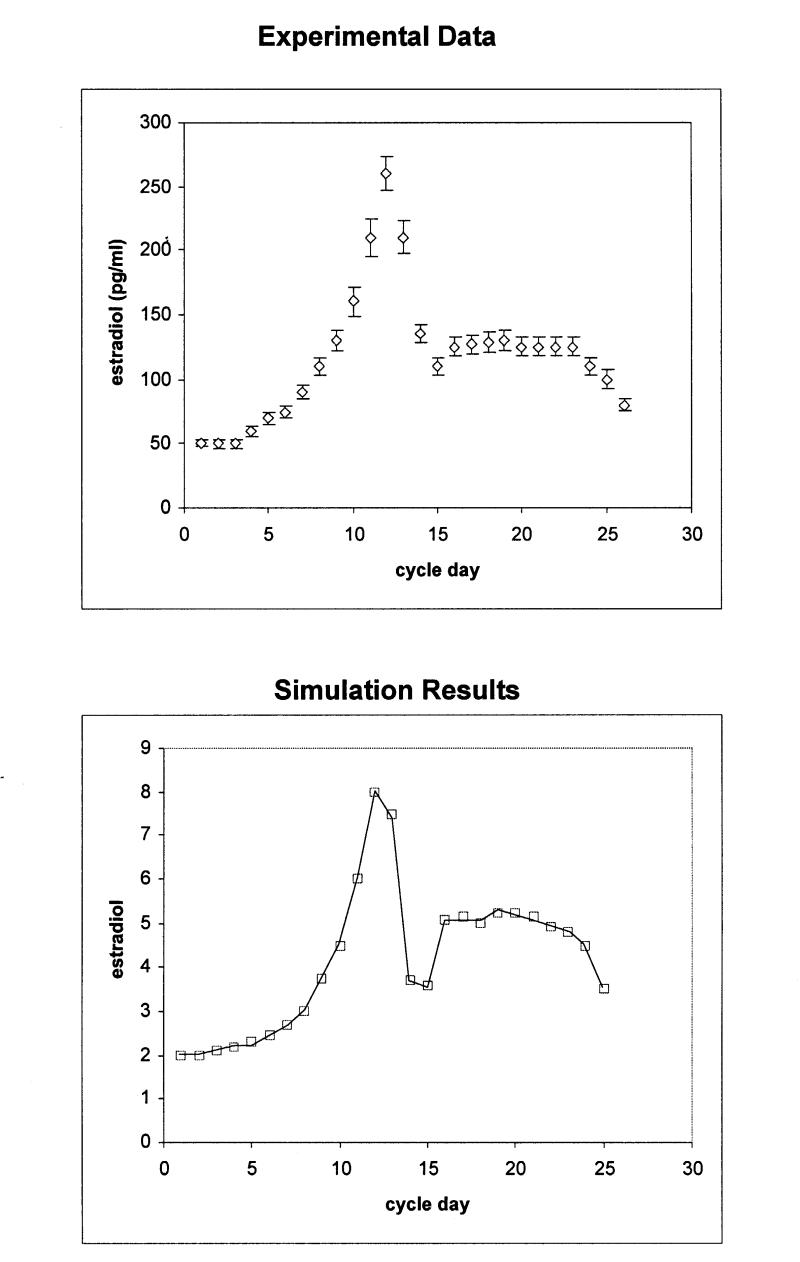
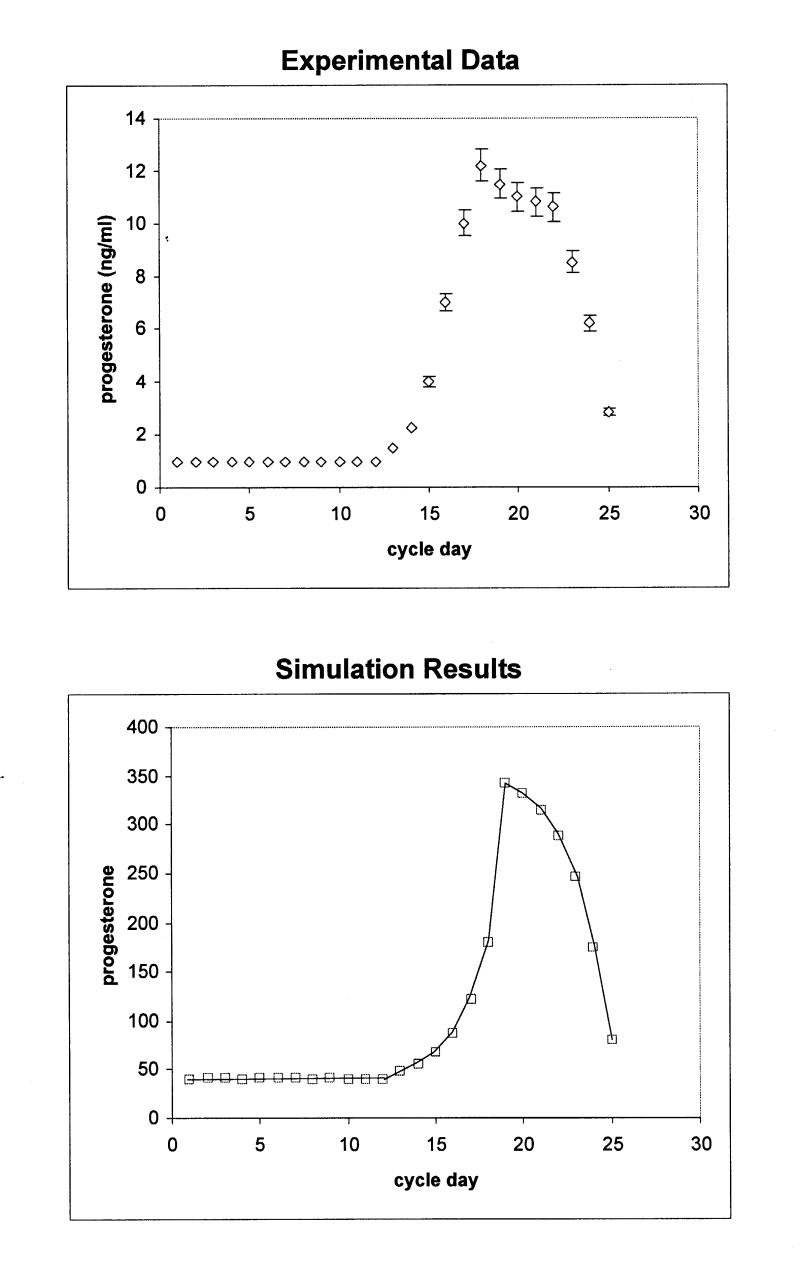
The model has been initialized with 100 tokens in the cholesterol place, in order to represent 100 percent of the available cholesterol molecules in the system. The model also starts with initial marking values for SCC and aromatase enzymes, which represent basal levels of enzymatic activity. Simulations were performed with the terminating simulator provided by UltraSAN. Figures 3 and 4▶▶▶▶ (bottom panels) show the estimated mean values of hormone levels for each time point (cycle day). The results were validated by comparison with data from hormone measurement studies (Figures 3 and 4▶▶▶▶, upper panels). The plots of the experimental data (hormone measurements) were compiled by incorporating data points from three different major studies.20–22
Figure 3a .
Upper panel: Estradiol production during the normal menstrual cycle derived by hormone measurements. Bottom panel: Simulation of estradiol production during the normal menstrual cycle using the stochastic activity model. The scale differs from that of the experimental data, because values are given in tokens. The rms for the calculation is 1.78 ng/ml.
Figure 3b .
Upper panel: Progesterone production during the normal menstrual cycle derived by hormone measurements. Bottom panel: Simulation of progesterone production during the normal menstrual cycle using the stochastic activity model. The scale differs from that of the experimental data, because values are given in tokens. The rms for the calculation is 1.8 pg/ml.
Figure 4a .
Upper panel: Estradiol production during the perimenopausal menstrual cycle derived by hormone measurements. Bottom panel: Simulation of estradiol production during the perimenopausal menstrual cycle using the stochastic activity model. The scale differs from that of the experimental data, because values are given in tokens. The rms for the calculation is 1.62 ng/ml.
Figure 4b .
Upper panel: Progesterone production during the perimenopausal menstrual cycle derived by hormone measurements. Bottom panel: Simulation of progesterone production during the perimenopausal menstrual cycle using the stochastic activity model. The scale differs from that of the experimental data, because values are given in tokens. The rms for the calculation is 1.82 pg/ml.
Data from the studies are given as pg/ml for estradiol and ng/ml for progesterone. Since the model counts tokens that correspond to number of molecules, values are considered in pmol/l and nmol/l in order to compare the simulated against the experimental data. In addition, the modeled data do not provide any units such as pmol, so that the evaluation of the data depends on relative changes between time points.
To quantitatively compare the output of the simulation to that of the experimental data, a root-mean-squared deviation (rms) was computed after appropriate scaling was determined to account for the conversion from “tokens” to ng/ml or pg/ml as appropriate. The resulting values are rms for the comparison in Figure 3A▶ is 1.78, for Figure 3B▶ rms = 1.8, for Figure 4A▶ rms = 1.62, and for Figure 4B▶, 1.82. Given all the above, we concluded that the simulated model provides an accurate representation of the real data.
Perimenopause and Menopause
Having the model of the normal menstrual cycle as a starting point, we proceeded with the modeling and simulation of the menstrual cycle during perimenopause (Figure 4▶▶). During perimenopause, both estradiol and progesterone levels decrease. To achieve these lower hormone levels, the rates of the activities controlling the flow of tokens from the FSH and LH places to aromatase and SCC respectively, were lowered. Again, the simulation results closely resemble the experimentally observed hormone measurements of women in perimenopause.
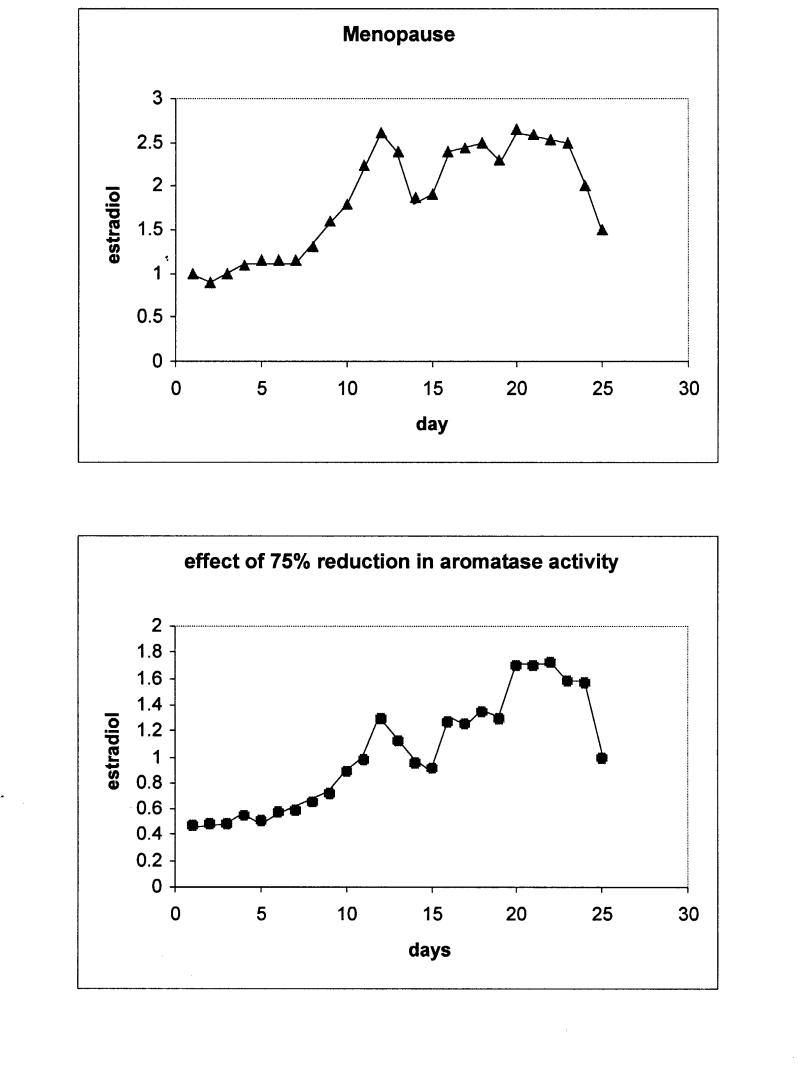
In menopause, estradiol levels drop dramatically, below basal levels, and stay there throughout the cycle. The estradiol peaks around ovulation and during the second half of the cycle do not exist, being consistent with the lack of ovulation and the follicular death in the menopausal ovaries (Figure 5▶, upper panel). These observations are accurately modeled here by drastically lowering the activity rates that control aromatase and SCC up-regulation.
Figure 5 .
Upper panel: Simulation results for estradiol levels in menopause over the period of one month. Bottom panel: Simulation of estradiol levels corresponding to a reduction of 75% of aromatase activity.
Modeling Abnormal Physiological States
Our interest in modeling normal physiological responses such as the menstrual cycle is to enable the interpretation and analysis of pathophysiological states such as changes that accompany menopause, alterations in enzyme activities because of naturally occurring polymorphisms, changes in gene expression or protein expression levels, or drug interactions that present partial inhibition to specific enzymes in the fundamental pathways. To test the suitability of this approach, as had been previously done with coagulation,10 we applied experimental observations based on single nucleotide polymorphism data to validate that the system would be sensitive to the changes and produce an accurate representation of the resulting physiological condition.
Single Nucleotide Polymorphisms
The stochastic activity network model of the menstrual cycle described in this study allows introduction of information about reduced or increased enzymatic activity as result of single nucleotide polymorphisms found in the genes that encode for these enzymes. The aromatase gene (CYP19) is extensively studied and contains many SNPs, some of which are related to pathogenesis of diseases. Most of the studies about SNPs in the CYP19 gene that are registered in the OMIM database (<www.ncbi.nlm.nih.gov/entrez/>, CYP19 accession number in OMIM: 107910), are related to disrupted function of the enzyme.23,24 We performed simulation of estradiol production by introducing perturbation to the model equivalent to 75% loss of aromatase function (this number is derived from studies measuring the activity of the mutated forms of the enzyme). The results show major down-regulation of estradiol levels (Figure 5▶, bottom panel). The peaks that are present in the normal cycle do not occur, and the pattern during the cycle is erratic, revealing non-ovulation and impaired ovarian function. This is consistent with studies using genetically engineered mice having deleterious mutations in the aromatase gene, and human subjects with hereditary diseases caused by function-disrupting single mutations.23–25
Discussion
We have developed a staged approach to the representation of key components of the female reproductive system for the purposes of establishing a baseline model of the menstrual cycle. This approach utilized stochastic activity network methodology based on the UltraSan system and has established our ability to represent both normal system functions, including typical menstrual cycle behavior both pre-menopause and post-menopause. Key components of the normal cycle include hormone level changes, coincidence of hormone cycling, etc., which are fundamental to the physiological processes leading to ovulation and pregnancy. These elements have been shown to be consistent from experimental data to the model presented above. In addition, we have shown that the system is sensitive to changes that accompany differences in the population, i.e., single nucleotide polymorphisms, which present alterations in the overall pathway behavior as well as differences in response to environmental and lifestyle issues. We are focused on identifying a number of key physiological landmarks that can be incorporated into this analysis26 as part of our ongoing study of the effects of normal aging in the female reproductive system and its association with risk for pre- and post-menopausal disease. In particular, we will be using this model to extend its interactions with additional hormonal factors, e.g., inhibin, to further define the detailed sensitivities of this system, an individualized risk assessment for use in evaluating hormone replacement therapy decisions and its association with breast and ovarian cancer.
In this study we have used stochastic activity networks to represent and simulate the pathways under study. We recognize that there are other methods for accomplishing these computations, but have selected this approach because of our observation that it is robust in dealing with problems of the following classification: (1) limited experimental data about the system response; (2) potential for incomplete information about the full set of reactions within the pathway; (3) lack of consistent experimental data on component reactions by the same investigator and in the same environment; (4) need to evaluate hypothesis based on partial pathway information for comparison with observed pathway behavior and use in rational design of experiments for clarification and/or verification of prediction; and (5) ability to construct pathway subgraphs and assemble into larger composite pathways, e.g., coagulation plus complement. Our experience in modeling coagulation and now in modeling menopause suggest that this method is appropriate but we have not yet tested its limits. We will continue to survey alternative methods as the systems we model become more complex or exhibit other constraints that this approach may reveal to be limiting toward its extension from macroscopic modeling to a microscopic system such as a biological pathway or process. We believe that the integrated approach of systems-based modeling with experimental observations and then validation will be the key to the future integration of informatics and genomics into the practice of medicine.
References
- 1.Kuller LH, Matthews KA, Meilahn EN. Estrogens and women’s health: Interrelation of coronary heart disease, breast cancer and osteoporosis. J Steroid Biochem Mol Biol. 2000;74:297–309. [DOI] [PubMed] [Google Scholar]
- 2.Martin AM, Weber BL. Genetic and hormonal risk factors in breast cancer. J Natl Cancer Inst. 2000;92:1126–35. [DOI] [PubMed] [Google Scholar]
- 3.Bogumil RJ, Ferin M, Rootenberg J, et al. Mathematical studies of the human menstrual cycle. I. Formulation of a mathematical model. J Clin Endocrinol Metab. 1972;35(1):126–43. [DOI] [PubMed] [Google Scholar]
- 4.Chavez-Ross A, Franks S, Mason HD, et al. Modeling the control of ovulation and polycystic ovary syndrome. J Math Biol. 1997; 36:95–118. [DOI] [PubMed] [Google Scholar]
- 5.Feng L, Rodbard D, Rebar R, Ross GT. Computer simulation of the human pituitary-ovarian cycle: studies of follicular phase estradiol infusions and the midcycle peak. J Cli. Endocrinol Metab. 1977; 45:775–87. [DOI] [PubMed] [Google Scholar]
- 6.Grigoliene R, Svitra D. The mathematical model of the female menstrual cycle and its modifications. Informatica. 2000; 11:411–20. [Google Scholar]
- 7.Schlosser PM, Selgrade JF. A Model of gonadotropin regulation during the menstrual cycle in women: Qualitative features. Environ Health Perspect. 2000; 108(Suppl 5):873–81. [DOI] [PubMed] [Google Scholar]
- 8.Shack WJ, Tam PY, Lardner, TJ. Mathematical model of the human menstrual cycle. Biophys J. 1971; 11:835–8. [DOI] [PMC free article] [PubMed] [Google Scholar]
- 9.Goss PJ, Peccoud J. Quantitative modeling of stochastic systems in molecular biology by using stochastic Petri nets. Proc Natl Acad Sci U S A. 1998;95(12):6750–5. [DOI] [PMC free article] [PubMed] [Google Scholar]
- 10.Mounts WM, Liebman MN. Qualitative modeling of normal blood coagulation and its pathological states using stochastic activity networks. Int J Biol Macromol. 1997;20(4):265–81. [DOI] [PubMed] [Google Scholar]
- 11.Hillier SG. Gonadotropic control of ovarian follicular growth and development. Mol Cell Endocrinol. 2001;179:39–46. [DOI] [PubMed] [Google Scholar]
- 12.Webb R, Campbell BK, Garverick HA, et al. Molecular mechanisms regulating follicular recruitment and selection. J Reprod Fertil Suppl. 1999;54:33–48. [PubMed] [Google Scholar]
- 13.Drummond AE, Findlay JK. The role of estrogen in folliculogenesis. Mol Cell Endocrinol. 1999;151:57–64. [DOI] [PubMed] [Google Scholar]
- 14.O’Connor KA, Holman DJ, Wood JW. Menstrual cycle variability and the perimenopause. Am J Human Biol. 2001; 13:465–78. [DOI] [PubMed] [Google Scholar]
- 15.Te Velde ER, Scheffer GJ, Dorland M, et al. Developmental and endocrine aspects of normal ovarian aging. Mol Cell Endocrinol. 1998;145:67–73. [DOI] [PubMed] [Google Scholar]
- 16.Couvillion J, Freire R, Johnson R, et al. Performability Modeling with UltraSAN. Proceedings of the International Workshop on Petri Nets and Performance Models, Melbourne, Australia, December 2–5, 1991, pp. 290–299.
- 17.Sanders WH, Obal II WD, Qureshi MA,Widjanarko FK. The UltraSAN modeling environment. Performance Evaluation. 1995;24(1):89–115. [Google Scholar]
- 18.Reddy VN, Mavrovouniotis ML, Liebman MN. Petri net representations in metabolic pathways. Proc Int Conf Intell Syst Mol Biol. 1993;1:328–36. [PubMed] [Google Scholar]
- 19.Oliveira JS, Bailey CG, Jones-Oliveira JB, Dixon DA. An algebraic-combinatorial model for the identification and mapping of biochemical pathways. Bull Math Biol. 2001;63(6):1163–96. [DOI] [PubMed] [Google Scholar]
- 20.Overlie I, Moen MH, Morkrid L, et al. The endocrine transition around menopause—a five year prospective study with profiles of gonadotropines, estrogens, androgens and SHBG among healthy women. Acta Obstet Gynecol Scand. 1999; 78:642–7. [PubMed] [Google Scholar]
- 21.Schneyer AL, Fujiwara T, Fox J, et al. Dynamic changes in the intrafollicular inhibin/activin/follistatin axis during human follicular development: relationship to circulating hormone concentrations. J Clin Endocrinol Metab. 2000;85:3319–30. [DOI] [PubMed] [Google Scholar]
- 22.Soules MR, Battaglia DE, Klein NA. Inhibin and reproductive aging in women. Maturitas. 1998;30:193–204. [DOI] [PubMed] [Google Scholar]
- 23.Ito Y, Fisher CR, Conte FA, et al. Molecular basis of aromatase deficiency in an adult female with sexual infantilism and polycystic ovaries. Proc Nat Acad Sci. 1993;90:11673–7. [DOI] [PMC free article] [PubMed] [Google Scholar]
- 24.Mullis PE, Yoshimura N, Kuhlmann B, et al. Aromatase deficiency in a female who is compound heterozygote for two new point mutations in the P450(arom) gene: impact of estrogens on hypergonadotropic hypogonadism, multicystic ovaries, and bone densitometry in childhood. J Clin Endocrinol Metab. 1997;82:1739–45. [DOI] [PubMed] [Google Scholar]
- 25.Toda K, Takeda K, Okada T, et al. Targeted disruption of the aromatase P450 gene (Cyp19) in mice and their ovarian and uterine responses to 17beta-oestradiol. J Endocrinol. 2001; 170:99–111. [DOI] [PubMed] [Google Scholar]
- 26.Tsavachidou, D. and Liebman, M. N., unpublished results.


