Abstract
The Seattle Cancer Care Alliance (SCCA) is a Pacific Northwest regional network that enables patients from community cancer centers to participate in multicenter oncology clinical trials where patients can receive some trial-related procedures at their local center. Results of positron emission tomography (PET) scans performed at community cancer centers are not currently used in SCCA Network trials since clinical trials customarily accept results from only trial-accredited PET imaging centers located at academic and large hospitals. Oncologists would prefer the option of using standard clinical PET scans from Network sites in multicenter clinical trials to increase accrual of patients for whom additional travel requirements for imaging is a barrier to recruitment. In an effort to increase accrual of rural and other underserved populations to Network trials, researchers and clinicians at the University of Washington, SCCA and its Network are assessing feasibility of using PET scans from all Network sites in their oncology clinical trials. A feasibility study is required because the reproducibility of multicenter PET measurements ranges from approximately 3% to 40% at national academic centers. Early experiences from both national and local PET phantom imaging trials are discussed and next steps are proposed for including patient PET scans from the emerging regional quantitative imaging network in clinical trials. There are feasible methods to determine and characterize PET quantitation errors and improve data quality by either prospective scanner calibration or retrospective post hoc corrections. These methods should be developed and implemented in multicenter clinical trials employing quantitative PET imaging of patients.
Keywords: Multicenter trials, Quantitative imaging, PET
1. Introduction
In the last decade positron emission tomography (PET) imaging using the glucose analogue (18F)-fluorodeoxyglucose (FDG) has become an important tool for cancer patient care and a routine part of oncology clinical practice [1–3]. Molecular imaging using PET is also a useful tool for accelerated and streamlined development of targeted therapies in cancer therapeutic trials [4]. Quantitative imaging can provide useful biomarker data for clinical efficacy and underlying molecular mechanisms of therapeutic agents [4–6]. Despite studies demonstrating the accuracy and predictive power of FDG PET as a measure of therapeutic effectiveness [3, 7], its use as a biomarker and response endpoints in clinical trials remains limited. Two factors impeding progress in incorporating PET into clinical trials are considerable variability in patient imaging methods across centers and inconsistency in quantitative measures of the same object at different sites. In order to assess and improve the state of quantitative PET imaging in both nationally recognized and community clinic PET imaging centers, we have established a regional quantitative imaging network in the Pacific Northwest for PET/CT clinical trials.
While FDG PET and PET / Computerized Tomography (PET/CT) have become part of the routine practice of cancer treatment, quantitative analysis of FDG PET imaging is variably and inconsistently practiced. The majority of oncologic FDG PET/CT studies performed in current clinical practice are for disease detection and staging [1]. Cancer staging comprises the vast majority of currently approved indications for FDG PET/CT and has been most widely investigated in clinical imaging trials [8, 9]. Image quantification is helpful for cancer diagnosis and staging by FDG PET, but it is non-essential. Quantification has been helpful in some cases in providing specificity for cancer diagnosis and staging [10]; however, the more recent ability to correlate metabolic and anatomic features directly by using PET/CT (versus PET only), also improves specificity and accuracy [11, 12], making PET quantification even less important for clinical cancer diagnosis and staging. Many centers perform purely qualitative interpretation of PET/CT images. Others make limited use of static FDG uptake measures, such as the standardized uptake value (SUV), but do so quite variably and often without consistency in patient preparation and image acquisition [13].
While participating in cancer clinical trials, non-imaging clinical investigators, often unfamiliar with the details of PET, assume that approaches used in clinical practice readily apply to clinical trials. This, however, is far from the truth. While the staging studies used routinely in clinical practice may not depend upon accurate image quantification, quantitative measures are essential for the assessment of therapeutic response [14–16]. Multicenter trials are the gold standard for establishing new standards for clinical practice but comparisons of quantitative PET values between sites can be problematic [17–22]. Systematic efforts are needed to understand and address the issues impeding use of PET measures from multicenter trials [13, 23–27].
PET calibration procedures and associated phantoms have been developed to regulate the known sources of PET measure variance and bias including patient specific biology, imaging protocol (i.e. patient preparation and scan protocol), image generation (e.g. accuracy of corrections, reconstruction method, and longitudinal calibration drift), and image analysis (region of interest (ROI) definition and static versus dynamic models). Potential patient specific sources of PET measure variance and bias include individual differences in available volume for PET tracer distribution as assessed by body habitus (e.g. weight, lean body mass, or body surface area), natural patient differences in concentrations of the biological compound of interest such as glucose levels in patients receiving FDG PET scans, or natural differences in patient motion (e.g. respiratory patterns). Differences in PET measure variability from patient specific sources can be regulated via normalizing the PET scanner measurement in radioactivity per volume units by dividing by the ratio of PET tracer injected dose to body habitus measure to yield PET measurements in the commonly reported standard uptake value (SUV) units [28], defining patient imaging protocols that set limits on natural concentrations of biological compounds of interest in patients receiving PET scans [13] and making additional patient motion measurements to allow motion compensation correction of PET measures [29]. The goal of PET calibration procedures is to ensure that PET measurement of a phantom region of interest (ROI) has the same radioactivity per unit volume (plus or minus some tolerance) as expected based on the known PET radioactivity in the phantom’s known volume. The most basic PET calibration phantoms are typically cylinders that are either filled with solid epoxy containing 68Ge/68 or filled with water and then injected with a known PET radioactivity a few minutes before the calibration procedure. PET calibration procedures in general include scanning the radioactive emissions of one of these cylinders with a known radioactivity concentration and then adjusting instrumentation settings in order to measure the correct radioactive concentration.
A minimum of quarterly cross-calibration between a PET scanner and the associated dose calibrator is the generally accepted standard. The European Association of Nuclear Medicine (EANM) in their guidelines for PET/CT tumor imaging recommend cross-calibration between PET scanners and associated dose calibrators occur at least every 3 months and immediately after any software and hardware revisions in addition to scanner manufacturer daily quality control procedures [30]. The EANM also recommends every institution participating in a multicenter trial at least once performs a image quality and recovery coefficient study using a standardized anthropomorphic phantom containing spheres of different diameters [30]. In the United States guidelines for PET calibration range from general statements asserting quantitative integrity and stability should be routinely tested using standard phantoms [13] to the American College of Radiology (ACR) strongly recommended quarterly testing with phantoms to the ACRIN certification of NCI Centers of Quantitative Imaging Excellence requiring yearly testing using a uniform cylinder PET phantom to the Society of Nuclear Medicine Clinical Trials Network requirement to annually test using their anthropomorphic chest oncology PET phantom.
Robust PET calibration protocols are expected to limit longitudinal variability in PET measurements from phantoms between PET calibrations performed quarterly to around 4% [31]. The minimum reproducibility of serial PET measurements in patients is higher and around 10% for single site studies [17–20]. Based in part on these PET reproducibility studies, the American College of Radiology Imaging Network (ACRIN) requires a site to demonstrate their PET scanner can correctly measure the SUV value within 10% in a phantom filled with 18F in water before allowing a site to participate in their multicenter clinical trials. In a single site or multicenter trial, a recent meta-analysis of the repeatability of FDG uptake measurements in tumors found the minimum threshold of change in SUV to account for test-retest variability was a combination of 20% change and a minimum absolute change of 1.2 units of SUV [32]. These PET measurement test-retest findings suggest that PET measurement changes between calibrations are fine if less than 5% [31], should be monitored and possibly corrected if between 5 and 10%, and any changes exceeding 10% should be investigated and corrective action taken including recalibration or improvements to quality assurance protocols.
Sites often hire outside experts or retain in house physicists to perform this calibration or at least validate an adequately accurate PET measurement on a regular schedule of every month, quarter, 6-months, or year. Quality assurance that PET measurements have acceptable accuracy and reproducibility may be performed as often as daily or only as part of regularly scheduled PET calibration. A major advantage of the calibration cylinders containing 68Ge/68 in solid epoxy is the long nine month half-life of 68Ge, which allows the same identically filled phantom to be periodically scanned to assess any longitudinal changes in PET measures without introducing possible variability due to repeated phantom preparation and requiring additional staff time and expense to order and injected 18F into liquid-filled phantoms. A disadvantage of many current solid 68Ge/68 cylinders is the activity concentration in the cylinder is only known with an accuracy of plus or minus 10 percent, which can especially be an issue for multicenter studies relying on a single PET measure from many scanners. Here we will discuss initial results of multicenter studies using solid 68Ge/68 epoxy-filled phantoms, which may some day replace or supplement the current use of water-filled phantoms for PET calibration procedures.
While inconsistent and non-optimized image quantification has a limited impact upon the interpretation of staging FDG PET/CT scans in clinical practice, improper image quantification may seriously degrade the utility of FDG PET as a dynamic measure in cancer therapy trials as shown by results of a multicenter PET phantom experiment by Takahashi and colleagues [33] that found up to 46% measurement error in SUV across separate scanners using phantoms filled with FDG in water. A subsequent reproducibility study of repeat FDG PET scans from 62 patients in a multicenter phase I trial observed 95% repeatability coefficients ranging from −34% to 52% for local site-measurements of SUVs with the range decreasing to −28% to 40% after applying quality assurance to initial results [34]. The lack of progress toward transitioning from qualitative clinical PET imaging to its unrealized potential for quantitative PET in clinical trials is a point of considerable frustration for both imagers and oncologists [35].
Oncologists, the targeted community PET clinics, and therapy trial sponsoring pharmaceutical companies are thus all strongly motivated to establish the use of PET measures in multicenter therapy trials and be able to include PET measures from other clinics in single center therapy trials to increase patient accrual rates through increased access to clinical trials for underserved low income and rural populations. The establishment of a regional quantitative imaging network will provide a test bed for both assessing the variation in PET quantitation and patient imaging protocols and for determining the feasibility of including patient PET scans from the emerging regional quantitative imaging network in clinical trials. Here we report on early experiences from both national and regional PET phantom imaging trials and the next steps proposed for including patient PET scans from the emerging regional quantitative imaging network in academic center clinical trials.
2. Experience in national multicenter PET phantom trials
2.1 Overview of studies performed by professional organizations and NIH multidisciplinary research consortiums
There has been some recent progress towards standardization of PET imaging protocols. Guidelines for standardization of patient preparation and imaging protocols for FDG PET in clinical therapy trials [13, 24–26, 36] represent important steps towards the consistent and optimal quantitative PET imaging needed for cancer therapy trials [23]. In addition, support for quantitative PET imaging clinical trials through programs and initiatives such as the National Cancer Institute (NCI) Phase I/II Imaging Centers, the American College of Radiology Imaging Network (ACRIN) certification of NCI Centers of Quantitative Imaging Excellence program, and Society of Nuclear Medicine (SNM) clinical trials initiative provide the infrastructure for testing quantitative PET imaging approaches for multicenter clinical trials at nationally recognized PET centers. However, a feasibility study of including regional research PET scans in our University of Washington and Fred Hutchinson Cancer Research Center oncology trials is still required because data regarding PET reproducibility and variation in patient imaging protocols at local centers of practice is not available.
2.2 Materials and methods for national multicenter trials at University of Washington
We have participated in three national efforts [21] SNM standards validation task force [37,38], NCI Reference Image Database to Evaluate Response (RIDER) project [22], and Pediatric Brain Tumor Consortium (PBTC) [39] that have examined the bias and variance of PET measures of the long half-life phantoms at multiple national academic centers. The two multicenter 68Ge epoxy-filled phantoms described below are different from clinic PET calibration phantoms in that smaller radioactive targets with diameters ranging from 10 to 37 mm were measured within a ¼ lower radioactive background while standard PET clinic phantoms typically have a uniform radioactive concentration in a cylinder with a diameter and height of approximately 20 centimeters. These more radioactive targets within a less radioactive background more closely approximates measurements of lesions within a body and allowed study of the impact on target size on PET measurements. Both of the two PET phantoms described below for the multicenter trials have been commonly used for 18F in water PET experiments with our studies being some of the first to use long half-live epoxy in place of water injected with PET tracer [21].
The Society of Nuclear Medicine standards validation task force directed Sanders Medical (Knoxville, TN) to manufacture a phantom to enable study of the systemic biases in serial PET imaging performed using different vendor scanners in multicenter studies [22]. The SNM Validation Phantom was based on a NEMA NU-2 IQ phantom (manufactured by Data Spectrum, Durham NC) with the central 5 cm diameter 'lung' cylinder removed. In addition the two larger hollow spheres were changed to hot spheres, as opposed to the cold spheres specified in NEMA NU-2 instructions. Hot sphere diameters were 10, 13, 17, 22, 28, and 37 mm. The target/background ratio was 4:1. Scanner and site dependent bias and variability between the 8 national academic PET centers was assessed by a single imaging (using typical clinical imaging parameters) of the same 271 day half-life 68Ge/68 phantom on 11 PET scanners of which 9 were PET/CTs with at least two representative PET/CTs from each of the three major vendors consisting of General Electric (GE), Philips and Siemens. The eight participating PET centers were Beth Israel Deaconess Medical Center, Brigham & Women's Hospital, Children's Hospital of Boston, Dana-Farber Cancer Institute in Boston, Huntsman Cancer Institute at the University of Utah, Massachusetts General Hospital in Boston, University of Pennsylvania in Philadelphia, and University of Washington in Seattle [38]. Maximum and average activity concentrations were centrally measured at the University of Washington using the PET DICOM files generated at each site from a single 68Ge PET scan of the phantom using a 10 mm diameter regions of interest (ROIs) centered on the spheres on the most central axial slice of the sphere centers [22]. The maximum and mean measurements were reported as maximum and mean recovery coefficients after normalizing the measured activity concentration by the known 68Ge activity concentration [22].
The same SNM Validation Phantom filled with 68Ge/68 epoxy was used for study of PET/CT reproducibility for the National Cancer Institute’s (NCI) Reference Image Database to Evaluate Response (RIDER) project in addition to the scans required for participation in the SNM validation task force at the University of Pennsylvania, University of Utah, and University of Washington. These additional studies investigated the variance in measures from multiple images of the same subject over a short period with either no movement between subsequent scans or some event such as removal of the subject from the imaging device occurring between each scan [22].
The American Association of Physicists in Medicine (AAPM)/SNM Task Group 145 funded a third study of PET calibration using the AAPM/SNM TG145 Calibration Phantom based on the PET phantom used by the American College of Radiology (ACR). This work migrated from the NEMA NU-2 IQ phantom to the ACR PET phantom because of problems with filling the small spheres of the NEMA IQ phantom, which resulted in the measurement confounding air voids within the smaller hot spheres [22]. Sanders Medical (Knoxville, TN) filled three ACR PET lids from the same 68Ge/68 epoxy batch in order to reduce the overall data collection time. One of the three modified ACR PET phantom lids attached to an ACR phantom was imaged at ten sites of the Pediatric Brain Tumor Consortium (PBTC) comprised of the Children’s Hospital of Boston, Children’s Hospital of Philadelphia, Children’s Memorial at Northwestern Memorial Hospital, Duke University, Georgetown University Hospital, National Institutes of Health, St. Jude Children’s Research Hospital, University of California at San Diego, University of Pittsburgh Children’s Hospital, and University of Washington. The main chamber of the ACR phantom was filled with water and sufficient 18F tracer was injected for an approximate 4:1 target-to-background ratio during imaging. All sites were directed to locally draw an ROI with a diameter or square side of about 1.2 cm and report maximum and mean values for both activity concentration and weight-based SUVs (in SUV units of g/mL) [39]. Central analyses of PET scans from all sites were performed at both Children’s Hospital Boston and the University of Washington Medical Center in Seattle.
2.3 Summary of national multicenter long half-life PET phantom results
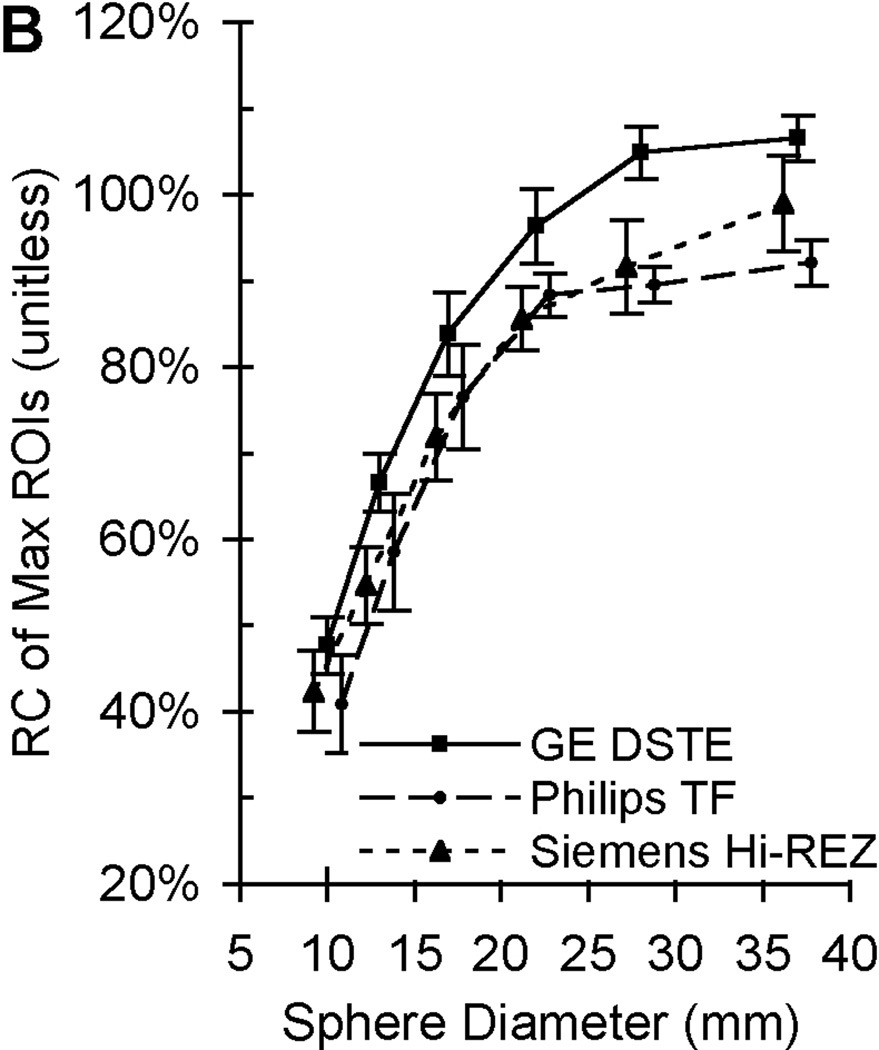
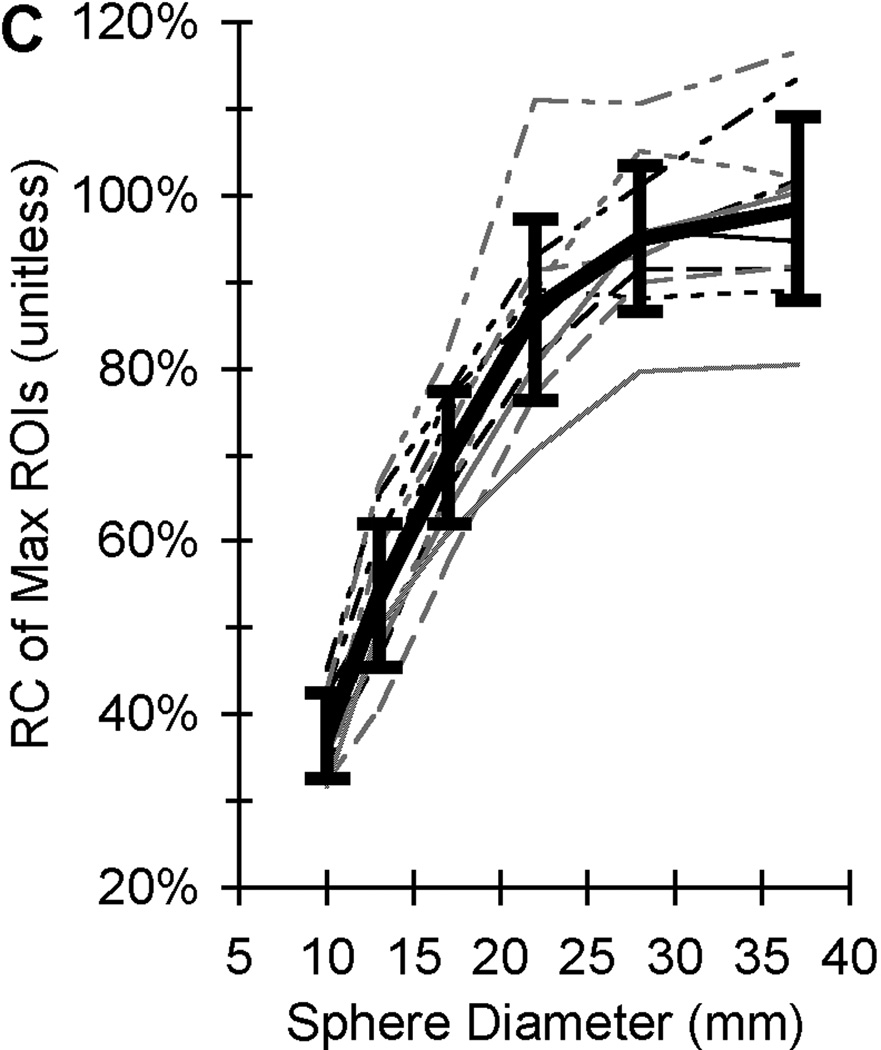
The total time required to complete all PET scans of the one NEMA NU-2 IQ phantom on 11 scanners at eight sites was 18 months while only 5 months was required to complete the PBTC scans of one of three ACR PET lids. The PET measurement coefficients of variation (COV) ranged from 2.5% to 9.8% (depending on image reconstruction parameters) from twenty repeat scans on one scanner after averaging the COVs across all NEMA NU-2 IQ sphere diameters [22]. A standard deviation range of 3 to 5% was observed for maximum and mean recovery coefficient measurements from 20 repeat scans on three scanners distributed among three sites using comparable imaging reconstruction [22]. The PET measurement coefficients of variation (COV) from mean and maximum ROIs were 10% and 12% after averaging across all sphere diameters from a single PET scan of the same phantom by all eleven PET scanners [38]. Sample maximum recovery coefficient data from PET scans of the same 68Ge/68 epoxy-filled phantom from 20 repeat scans at three sites are in Fig. 1B and from a single scan on eleven PET/CTs distributed over eight sites. The error bars from PET measurements of the same phantom in Fig. 1 are observed to increase from Fig. 1B to Fig. 1C as measurements go from repeat acquisitions from one scanner at one site to a single PET acquisition from 11 scanners at multiple sites. Recovery coefficients (RCs) shown are based on maximum SUV and illustrate the well-known partial volume error [40], i.e. where the recovery coefficient (ideally 100% regardless of size) decreases with sphere size. The difference between the top and bottom RC curves in Fig. 1C for the larger diameter spheres is approximately 40%. Analyses of the ACR phantom with 68Ge/68 in the PET lid cylinders yielded a COV range of 8% to 18% for SUV measurements of hot cylindrical features from all ten PBTC sites performed by the same reviewer (central analysis), while the COV range for the same scans was 30% to 43% when using local site-based SUV measures [39].
Figure 1.
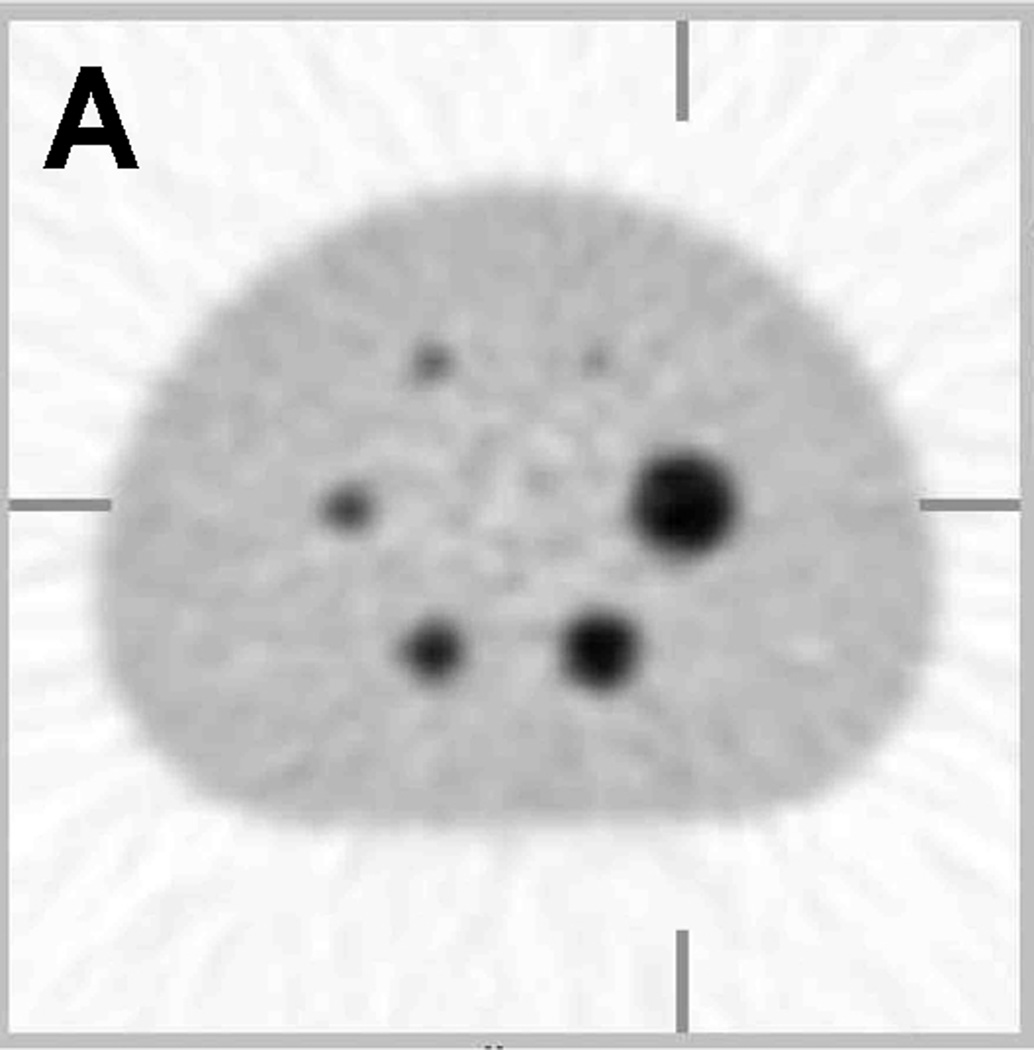
Sample PET image and recovery coefficient measurements of the same phantom filled with long half-life 68Ge epoxy. (A) A sample PET image of the modified NEMA NU-2 Image Quality (IQ) phantom with hot sphere diameters range from 10 to 37 mm. (B) Average recovery coefficients (RC) of maximum ROIs (measured / true) based on 20 repeat scans by 3 scanners at 3 sites with each scanner made by a different manufacturer (adapted from Doot et al. [22]). (C) Recovery coefficients of maximum ROIs from single scans from 11 different PET scanners with the average value represented by a thick black line (adapted from Doot et al. [38]. Error bars represent the standard deviation of maximum ROI measurements from 20 scans by a single scanner in (B) and one scan by eleven scanners in (C).
2.4 Lessons learned from national multicenter PET phantom trials
A long half-life phantom filled with solid 68Ge/68 epoxy allows for direct comparison of quantitative results from multiple sites using a variety of PET scanners, image processing methods, and patient imaging protocols. Overall PET measurement error levels for multicenter PET clinical trials in these early studies ranged from 3% [22] to 40% [39], primarily due to local versus central reading and quality assurance and quality control [39] and differences in instrumentation factors such as PET scanner acquisition methods and degree of filtering in image reconstruction [22]. One challenge in these early trials was the need to ship the same phantom across the country where each site must have personnel with US Department of Transportation Hazmat training in order to ship the radioactive phantom to the next site. In the future, the time required to complete multicenter cross-calibration scans of long half-life phantoms can be reduced by producing multiple phantoms using the same batch of 68Ge epoxy to ensure all phantoms have very similar activity concentrations.
3. Regional quantitative imaging networks (QIN) for local centers of practice
3.1 Approach
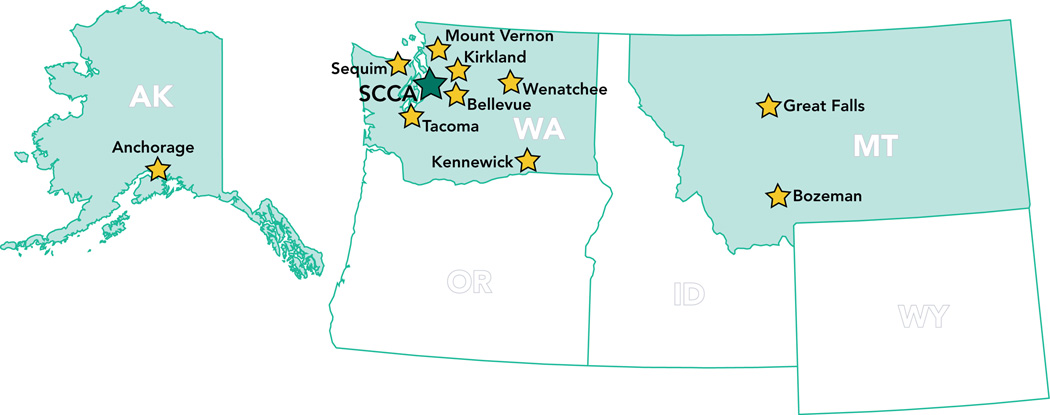
Our approach to establish a regional quantitative imaging network was to recruit regional imaging sites located in community cancer centers (Fig. 2) participating in the Seattle Cancer Care Alliance (SCCA) Network, which enables regional cancer center patients to participate in national oncology trials based at the University of Washington (UW), Fred Hutchinson Cancer Research Center (FHCRC), and Seattle Children’s Hospital. Twelve external SCCA Network members currently include Bozeman Deaconess Cancer Center in Bozeman, MT, Cascade Cancer Center in Kirkland, WA, Clinic Cancer Care in Great Falls, MT, Columbia Basin Hematology & Oncology in Kennewick, WA, Group Health Cooperative in Seattle, WA, MultiCare Regional Cancer Center in Tacoma, WA, Olympic Medical Cancer Center in Sequim, WA, Overlake Hospital Medical Center in Bellevue, WA, Providence Alaska Medical Center in Anchorage, AK, Sea Mar Community Health Centers along the I-5 corridor in Washington, Skagit Valley Hospital Regional Cancer Center in Mount Vernon, WA and Wenatchee Valley Medical Center in Wenatchee, WA.
Figure 2.
Locations of Seattle Cancer Care Alliance (SCCA) Network sites outside Seattle area.
The published Netherlands protocol for standardization of FDG PET scans in multicenter trials [36] reported that differences in PET quantification methodology prevents comparing PET measures from different centers unless every center agrees to some form of protocol standardization and cross calibration of PET measures through common phantom experiments. We have observed similar differences in PET quantification between our site and a SCCA Network hospital for two patients who had their outside baseline PET scan repeated at our institutions as a condition of enrollment in one of our clinical therapy trials. Two patients were rescanned at 16 and 37 days after the outside hospital scan with maximum SUV measurement of their breast tumors increasing by 38% and decreasing by 10%, respectively. It is possible that a portion of the difference between scans is related to the disease process, however, without standardization of the technical collection of the measures it is not possible to identify the true change in the PET measures that is related to the disease alone. This anecdotal evidence points to the need for similar PET measure standardization as performed in the Netherlands for our SCCA Network sites. In addition we plan to implement further improvements toward standardization with multicenter measures using a long half-life phantom that will allow all the centers to image "identical" solid 68Ge phantoms to eliminate any variance due to differences in preparing a short half-life 18F in a water-filled phantom at each site.
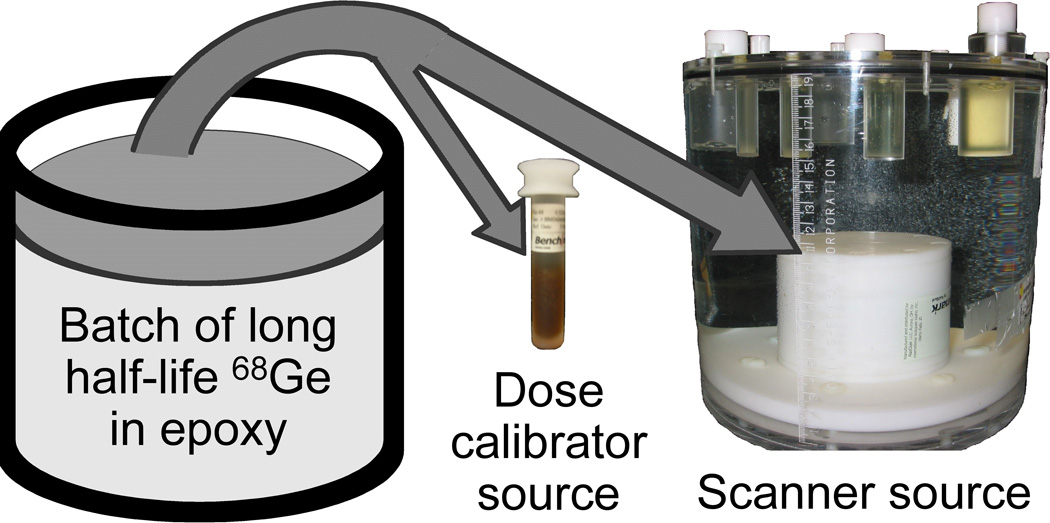
In addition to studying the bias and variation in PET scanner measurements using 68Ge sources, we also used a National Institute of Standards and Technology (NIST)-traceable 68Ge/68 source [41] for evaluating the bias and variation in dose calibrator 18F measurements. The patented 68Ge/68 epoxy sources [42] for the scanner and dose calibrator were constructed by RadQual LLC (Weare, NH) from the same batch of 68Ge epoxy as shown in Figure 3 and consequently had the same radioactivity concentration. Assessment of both PET scanner and dose calibrator measurements at each participating site will allow us to determine the accuracy and precision of the commonly used PET standardized uptake value (SUV), which is a ratio that incorporates both PET scanner and dose calibrator measures. SUV calculations also require patient weight measurements, which we do not quantitatively study beyond confirmation that sites have reliable patient weighing procedures in place. We also planned to repeat our PET cross-calibration experiments at sites to determine the frequency of the anecdotal observations of large longitudinal drifts in repeated SUV measurements and determine if the longitudinal measurement error of approximately 4% observed at the University of Washington Medical Center [31] is also observed across the participating sites due in part to calibration drift when months occur between serial scans.
Figure 3.
PET cross-calibration 68Ge/68 kit sources for a dose calibrator and a PET scanner were constructed from the same epoxy batch to enable cross-calibration between dose calibrator and PET scanner measurements [42]. The cylindrical scanner source had a diameter and height of 6-cm and was mounted to the bottom of a modified ACR PET phantom.
Our long term goal is to use a combination of quantitative PET measurements of NIST-traceable PET phantoms and repeated patient scans at University of Washington, SCCA, and regional imaging centers to enable definition of the requirements for including patient PET scans from the emerging regional quantitative network in our UW, FHCRC, and SCCA clinical trials.
3.2 Early steps
We measured radioactivity of the 68Ge/68 scanner and dose calibrator sources in Fig. 3 from May 2009 through April 2010 at five SCCA Network sites including the SCCA and University of Washington Medical Center in Seattle and three external SCCA Network sites located in Mount Vernon and Tacoma in Washington and Anchorage in Alaska [43]. Radioactivity in the dose calibrator source was measured using two Biodex Medical Systems (Shirley, NY) Atomlab 100 and four Capintec (Ramsey, NJ) CRC dose calibrators. Two General Electric Healthcare Technologies (Milwaukee, WI) DSTE, two Siemens Medical Solutions (Knoxville, TN) Biograph, and one Philips Healthcare (Eindhoven, The Netherlands) Gemini TF TOF PET/CT scanners each imaged the same 68Ge/68 source twice including a measurement before and after a regularly scheduled PET scanner calibration. The range of error in dose calibrator measurements was from −50% to 9% with range of 29 to 226 days between repeat measurements. Dose calibrator measures were similar for the two longitudinal measurements for five of the six dose calibrators with these five observing a change of less than 3.5% in bias between measurements. The two measurement errors for the sixth dose calibrator were 9% and −50%, which bracketed the observed range of dose calibrator error. The range of PET/CT scanner errors was from −26% to 13% with the −26% error observed at the site with a dose calibrator error of −50%. The range of SUV errors was from −20% to 49%. The site with an outlying −50% dose calibrator error and −26% PET scanner error had the highest SUV error of 49% and observed a change in SUV error bias of 60%. The five PET measurement sets at the other four locations had a range of change in SUV error from −11% to 11%. These preliminary results suggest SUV measurements from the same scanner and dose calibrator are not stable over time and use of SUV values does not cancel out any error in the scanner and dose calibrator.
3.3 Next steps
We have now opened the phantom study recruitment to all SCCA Network members located across the Pacific Northwest including those employing mobile PET scanners in trailers that are only onsite for as little as one day a week. We will subsequently open a study of repeat FDG PET scan of patients to sites participating in the phantom study in order of the Network sites’ rates of patient referral to our University of Washington and SCCA oncology trials.
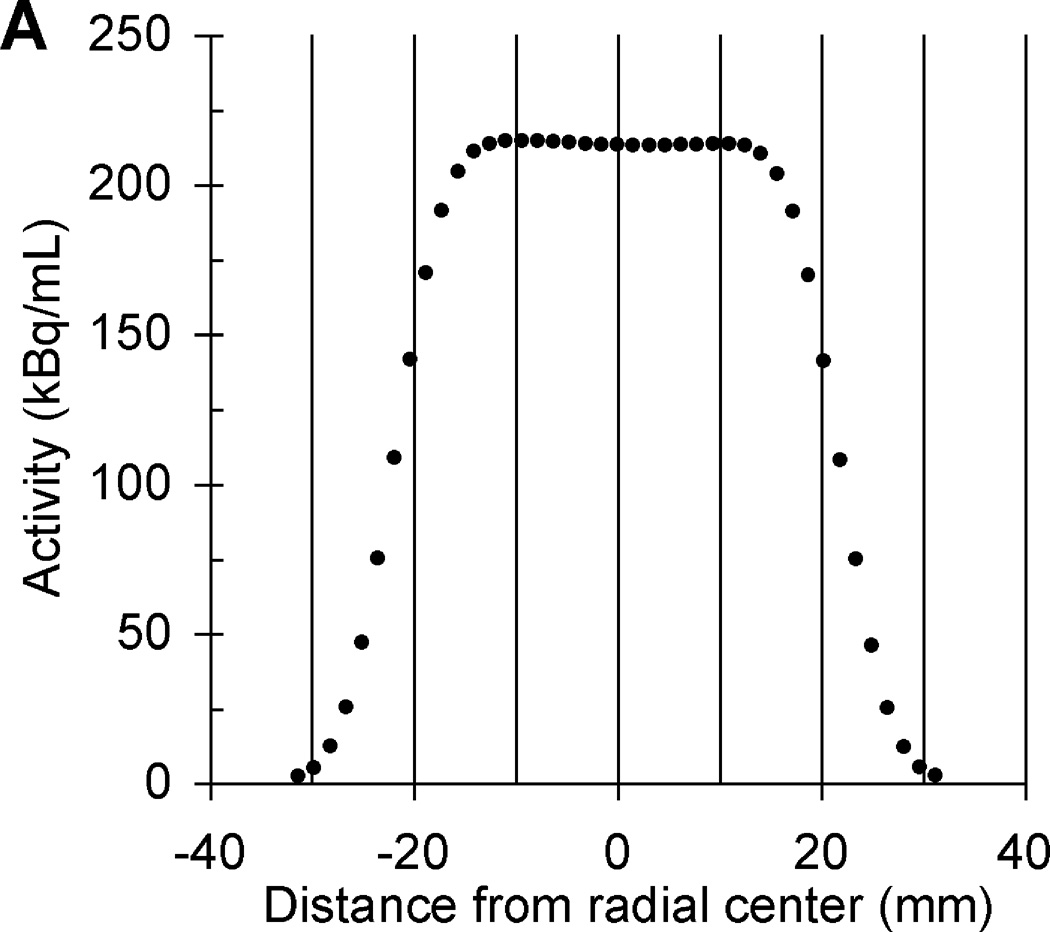
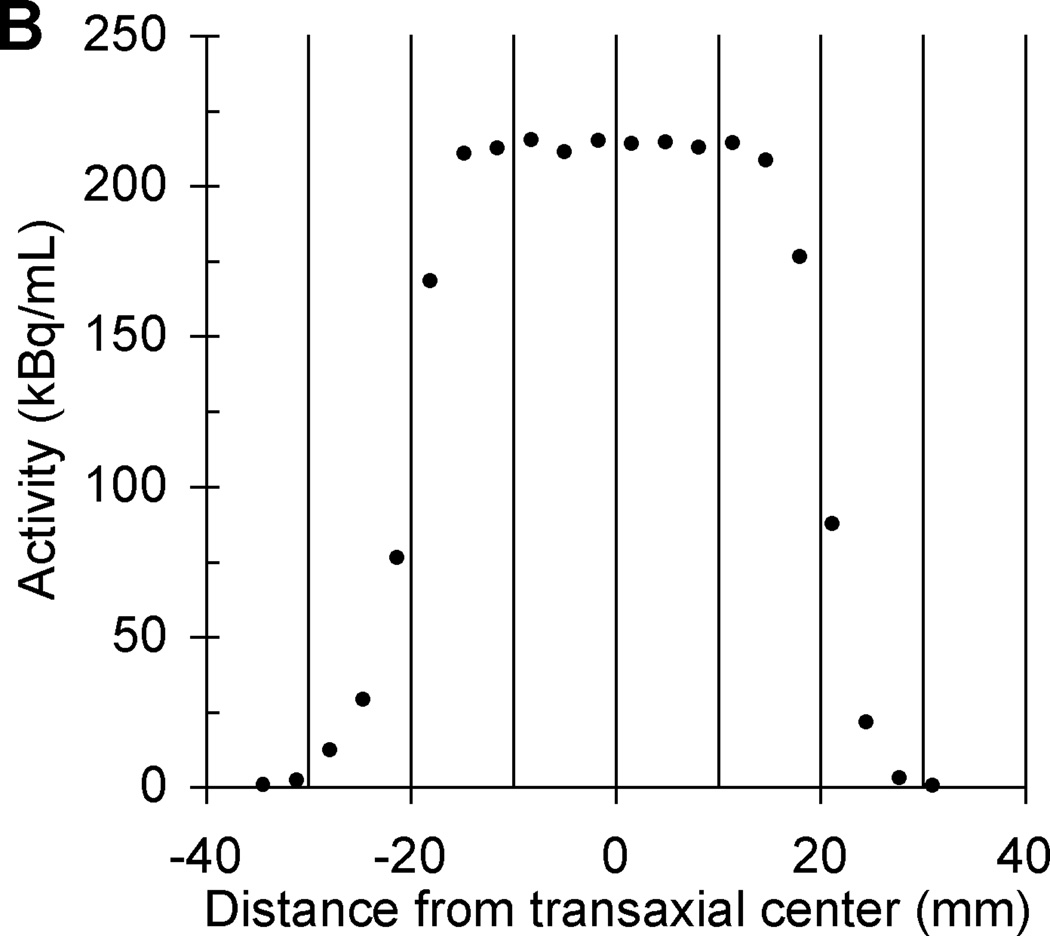
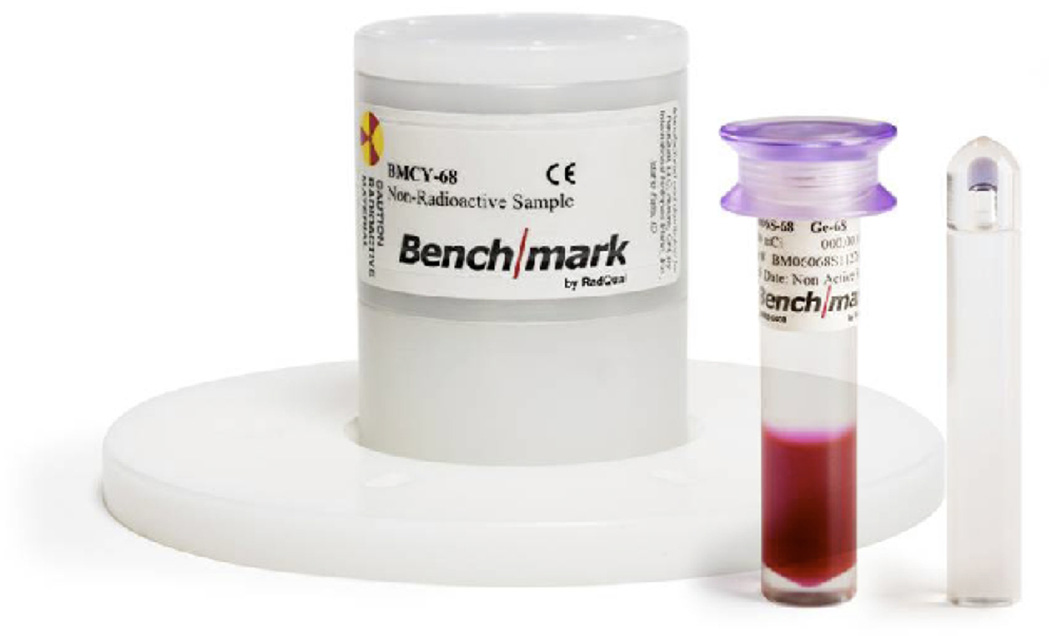
Based on lessons learned from previous multicenter trials using long half-life phantoms, we have redesigned the phantom’s PET scanner source to reduce the size and total activity to a radioactive cylinder with a radioactive matrix of 4.5 cm in diameter and height. The relative merits of all discussed 68Ge-filled phantoms are summarized in Table 1. The initial total activity in the scanner source is now 18.5 MBq (0.5 mCi) and this calibrated activity value is implicitly traceable to NIST. A pedestal was added between the ACR (Data Spectrum ECT) phantom mounting plate and the bottom of the scanner source to reduce the probability of any measured PET values being impacted by attenuation correction artifacts that sometimes occur near the edges of the ACR phantom depending on the image reconstruction. CT and PET images of the scanner source mounted inside an ACR phantom are in Fig. 4. The transaxial and axial linear PET profiles of the scanner source in Fig. 5 suggests a cylindrical ROI with a diameter and height of ≤ 1.5 cm could be positioned in the center of the scanner source image to measure the mean activity concentration without partial volume measurement error [40]. The second source for the dose calibrator has an initial total activity of approximately 0.90 MBq (25 µCi), which is directly traceable to NIST [41]. A third small 68Ge/68 point source near the tip of a nonradioactive rod was added to the second-generation PET cross-calibration kit using epoxy from the same 68Ge/68 epoxy batch used to construct the dose calibrator and PET scanner sources with an approximate initial activity of 3.85 kBq (0.14 µCi), which is implicitly traceable to NIST. The third solid source is for evaluation of measurement error by well counter equipment used to determine the activity in patient blood samples. The three 68Ge/68 epoxy sources with "identical" activity concentrations (commercially available as X-Cal F-18 (Ge-68/Ga-68) System kit only from RadQual LLC, Weare, NH) are shown in Fig. 6 and will allow cross-calibration between PET activity measurements by any scanners, dose calibrators, and the blood activity measuring well counter equipment available at multicenter PET imaging centers. We now recommend a PET cross-calibration kit is sent to each site enrolled in a multicenter trial to ensure regular calibration of each site’s PET scanners and dose calibrators. Future studies will include cross-calibration studies of PET scanners, dose calibrators, and sampled blood activity measuring well counters.
Table 1.
Relative merits of PET phantoms filled with nine-month half-life 68Germanium-filled epoxy
| PET phantom description: | Advantages: | Disadvantages: |
|---|---|---|
| Generic flangeless 20 cm diameter and height phantom filled with 68Ge-filled epoxy |
|
|
| SNM Validation Phantom: (NEMA NU-2 Image Quality (IQ) torso phantom) without lung insert and with hot spheres filled with 68Ge epoxy in a 4:1 ratio to 68Ge in main chamber |
|
|
| AAPM/SNM TG145 Calibration Phantom: flangeless 20 cm phantom with 68Ge epoxy in PET lid in 4 cylinders of 8 to 25 mm diameters and scanned with 18F-water with 1/4 the activity in the 68Ge-filled PET lid cylinders. |
|
|
| RadQual prototype scanner source with 6 cm diameter and height cylinder filled with 68Ge epoxy and attached to main chamber bottom of flangeless 20 cm phantom with water-filled main chamber |
|
|
| RadQual X-CAL 18F (68Ge/68Ga) scanner source with 4.5 cm diameter and height cylinder filled with 68Ge epoxy and mounted on top of Teflon pedestal over 5 cm in height that attaches to main chamber bottom of flangeless 20 cm diameter phantom |
|
|
Figure 4.
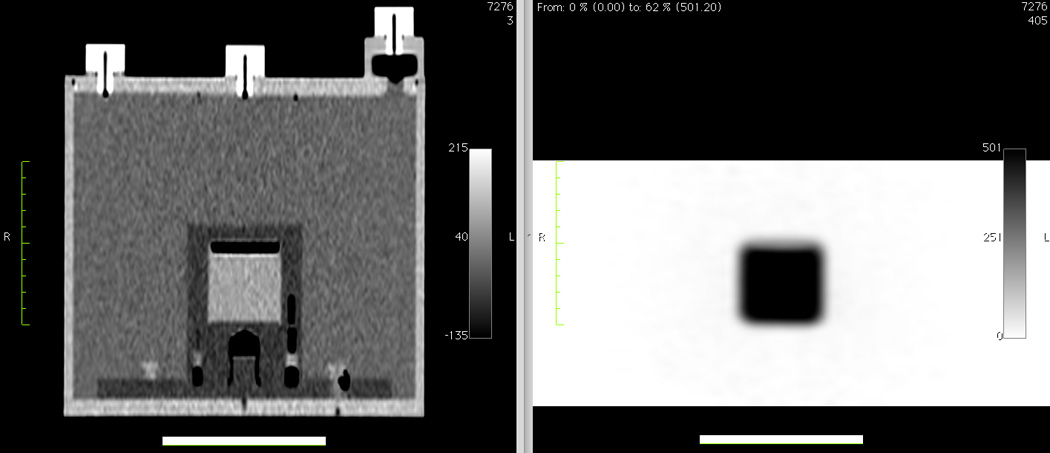
Coronal CT (left) and PET (right) images of a second-generation 68Ge/68Ga scanner source mounted inside an ACR Data Spectrum ECT phantom without the CT rod inserts and without the optional PET lid of refillable cylinders. The length of the thick horizontal white lines is 10 cm.
Figure 5.
Transaxial (A) and axial (B) linear PET profiles of same second-generation scanner source shown in Fig. 4.
Figure 6.
The second-generation PET cross-calibration 68Ge/68 kit sources (from left to right) for PET scanners, dose calibrators, and well counters, which measure activity in blood samples.
Two final important next steps include surveying local patient PET imaging protocols to evaluate compliance with consensus recommendations [13] and commencement of a reproducibility studying using repeat patient PET scans at the same SCCA Network site and at different sites to study PET measurement errors at the same site and between sites including the error contribution from instrumentation from concurrent measurements of PET cross-calibration kit sources.
4. Summary and discussion
Our findings show that use of PET scanner and dose calibrator cross-calibration kits is useful in multicenter imaging trials to both assess bias and enable correction of biases due to instrumentation factors in serial PET studies. While the site with highest PET SUV error of 49% occurred at a community imaging center, it is too early to determine if PET measurement calibration is significantly better at national centers of imaging after assessing PET measurement errors at only three regional imaging centers. A multicenter trial using PET cross-calibration kits should consider providing a kit for each site to facilitate repeated local measures as part of the trial’s local quality control and quality assurance procedures and to enable rapid confirmation that any unusual patient PET result was likely not due to an instrumentation error. We recommend the frequency of PET cross-calibration measurements range from every week to every three months for multicenter trials with higher frequency of cross-calibration for sites with higher patient accrual rates and for trials assessing early response with serial PET measures. If PET cross-calibration discovers error levels requiring recalibration, it is estimated recalibration will require at least an hour after arrival of qualified PET scanner calibration personnel provided error is due to operator error or instrumentation measurement drift. However if the error source is due to less common equipment failure then repair and recalibration may take 2 to 3 days depending on availability of replacement parts. Methods to determine and characterize PET quantitation errors and improve data quality by either prospective scanner calibration or retrospective post hoc corrections should be developed and implemented in multicenter clinical trials employing PET imaging of patients.
Acknowledgements
The authors thank Seattle Cancer Care Alliance Network staff and faculty, especially Cecilia Zapata, for supporting recruitment of Network sites to the study and thank Brian Pankow and Raymond Noble in the Radiation Safety Office at the University of Washington for facilitating transport of 68Ge radioactive sources to participants. We appreciate the support of John Rieke, Medical Director at Multicare Regional Cancer Center in Tacoma, Andrew Levine, at Medical Imaging Northwest in Tacoma, Wanda Katinszki, Oncology Service Line Director and W. Bryan Winn, Diagnostic Radiologist at Providence Medical Center in Anchorage, Barbara Jensen, Director at Skagit Valley Regional Cancer Care Center in Mount Vernon, Ray Schemm at Skagit Valley Hospital in Mount Vernon, and Feiyu Xueat at Skagit Radiology in Mount Vernon. We are also grateful for assistance in making local dose calibrator and PET scanner measurements from Roland Zheng at Multicare Medical Center in Tacoma, Tiffany Kooken and Melissa Bridges at Skagit Valley Hospital’s Regional Cancer Care Center in Mount Vernon, and Karen Hanrahan, Norm Lind, and Kathryn Collins at Providence Imaging Center in Anchorage, Wendy McDougald at the University of Washington Medical Center, and Lawrence MacDonald at the Seattle Cancer Care Alliance. This work was supported by a National Cancer Institute Cancer Imaging Program (SAIC) contract 24XS036 and U01 grant CA148131 from the National Institutes of Health.
Footnotes
Publisher's Disclaimer: This is a PDF file of an unedited manuscript that has been accepted for publication. As a service to our customers we are providing this early version of the manuscript. The manuscript will undergo copyediting, typesetting, and review of the resulting proof before it is published in its final citable form. Please note that during the production process errors may be discovered which could affect the content, and all legal disclaimers that apply to the journal pertain.
References
- 1.Gambhir SS, Czernin J, Schwimmer J, Silverman DH, Coleman RE, Phelps ME. A tabulated summary of the FDG PET literature. J Nucl Med. 2001;42:1S–93S. [PubMed] [Google Scholar]
- 2.Kelloff GJ, Hoffman JM, Johnson B, Scher HI, Siegel BA, Cheng EY, et al. Progress and promise of FDG-PET imaging for cancer patient management and oncologic drug development. Clin Cancer Res. 2005;11:2785–2808. doi: 10.1158/1078-0432.CCR-04-2626. [DOI] [PubMed] [Google Scholar]
- 3.Mankoff DA, Eary JF, Link JM, Muzi M, Rajendran JG, Spence AM, et al. Tumor-specific positron emission tomography imaging in patients: [18F] fluorodeoxyglucose and beyond. Clin Cancer Res. 2007;13:3460–3469. doi: 10.1158/1078-0432.CCR-07-0074. [DOI] [PubMed] [Google Scholar]
- 4.Aboagye EO. Imaging in drug development. Clin Adv Hematol Oncol. 2006;4:902–904. [PubMed] [Google Scholar]
- 5.Weber WA. Positron emission tomography as an imaging biomarker. J Clin Oncol. 2006;24:3282–3292. doi: 10.1200/JCO.2006.06.6068. [DOI] [PubMed] [Google Scholar]
- 6.Kelloff GJ, Krohn KA, Larson SM, Weissleder R, Mankoff DA, Hoffman JM, et al. The progress and promise of molecular imaging probes in oncologic drug development. Clin Cancer Res. 2005;11:7967–7985. doi: 10.1158/1078-0432.CCR-05-1302. [DOI] [PubMed] [Google Scholar]
- 7.Weber WA, Figlin R. Monitoring cancer treatment with PET/CT: does it make a difference? J Nucl Med. 2007;48(Suppl 1):36S–44S. [PubMed] [Google Scholar]
- 8.Hillner BE, Siegel BA, Liu D, Shields AF, Gareen IF, Hanna L, et al. Impact of positron emission tomography/computed tomography and positron emission tomography (PET) alone on expected management of patients with cancer: initial results from the National Oncologic PET Registry. J Clin Oncol. 2008;26:2155–2161. doi: 10.1200/JCO.2007.14.5631. [DOI] [PubMed] [Google Scholar]
- 9.Lardinois D, Weder W, Hany TF, Kamel EM, Korom S, Seifert B, et al. Staging of nonsmall- cell lung cancer with integrated positron-emission tomography and computed tomography. The New England journal of medicine. 2003;348:2500–2507. doi: 10.1056/NEJMoa022136. [DOI] [PubMed] [Google Scholar]
- 10.Lowe VJ, Fletcher JW, Gobar L, Lawson M, Kirchner P, Valk P, et al. Prospective investigation of positron emission tomography in lung nodules. J Clin Oncol. 1998;16:1075–1084. doi: 10.1200/JCO.1998.16.3.1075. [DOI] [PubMed] [Google Scholar]
- 11.Mahner S, Schirrmacher S, Brenner W, Jenicke L, Habermann CR, Avril N, et al. Comparison between positron emission tomography using 2-[fluorine-18]fluoro-2-deoxy-Dglucose, conventional imaging and computed tomography for staging of breast cancer. Ann Oncol. 2008;19:1249–1254. doi: 10.1093/annonc/mdn057. [DOI] [PubMed] [Google Scholar]
- 12.Fueger BJ, Weber WA, Quon A, Crawford TL, Allen-Auerbach MS, Halpern BS, et al. Performance of 2-deoxy-2-[F-18]fluoro-D-glucose positron emission tomography and integrated PET/CT in restaged breast cancer patients. Mol Imaging Biol. 2005;7:369–376. doi: 10.1007/s11307-005-0013-4. [DOI] [PubMed] [Google Scholar]
- 13.Shankar LK, Hoffman JM, Bacharach S, Graham MM, Karp J, Lammertsma AA, et al. Consensus recommendations for the use of18F-FDG PET as an indicator of therapeutic response in patients in National Cancer Institute Trials. J Nucl Med. 2006;47:1059–1066. [PubMed] [Google Scholar]
- 14.Mankoff DA, Muzi M, Zaidi H. Quantitative analysis of nuclear oncologic images. In: Zaidi H, editor. Quantitative Analysis of Nuclear Medicine Images. Hingham, MA: Springer; 2004. [Google Scholar]
- 15.Lammertsma AA, Hoekstra CJ, Giaccone G, Hoekstra OS. How should we analyse FDG PET studies for monitoring tumour response? European journal of nuclear medicine and molecular imaging. 2006;33(Suppl 1):16–21. doi: 10.1007/s00259-006-0131-5. [DOI] [PubMed] [Google Scholar]
- 16.Spence AM, Muzi M, Graham MM, O’Sullivan F, Link JM, Lewellen TK, et al. 2- [(18)F]Fluoro-2-deoxyglucose and glucose uptake in malignant gliomas before and after radiotherapy: correlation with outcome. Clin Cancer Res. 2002;8:971–979. [PubMed] [Google Scholar]
- 17.Minn H, Zasadny K, Quint L, Wahl R. Lung cancer: reproducibility of quantitative measurements for evaluating 2-[F-18]-fluoro-2-deoxy-D-glucose uptake at PET. Radiology. 1995;196:167–173. doi: 10.1148/radiology.196.1.7784562. [DOI] [PubMed] [Google Scholar]
- 18.Weber WA, Ziegler SI, Thodtmann R, Hanauske AR, Schwaiger M. Reproducibility of metabolic measurements in malignant tumors using FDG PET. J Nucl Med. 1999;40:1771–1777. [PubMed] [Google Scholar]
- 19.Nahmias C, Wahl L. Reproducibility of standardized uptake value measurements determined by18F-FDG PET in malignant tumors. J Nucl Med. 2008;49:1804–1808. doi: 10.2967/jnumed.108.054239. [DOI] [PubMed] [Google Scholar]
- 20.Krak N, Boellaard R, Hoekstra O, Twisk J, Hoekstra C, Lammertsma A. Effects of ROI definition and reconstruction method on quantitative outcome and applicability in a response monitoring trial. European journal of nuclear medicine and molecular imaging. 2005;32:294–301. doi: 10.1007/s00259-004-1566-1. [DOI] [PubMed] [Google Scholar]
- 21.Kinahan PE, Doot RK, Wanner-Roybal M, Bidaut LM, Armato SG, Meyer CR, et al. PET/CT Assessment of Response to Therapy: Tumor Change Measurement, Truth Data, and Error. Translational oncology. 2009;2:223–230. doi: 10.1593/tlo.09223. [DOI] [PMC free article] [PubMed] [Google Scholar]
- 22.Doot RK, Scheuermann JS, Christian PE, Karp JS, Kinahan PE. Instrumentation factors affecting variance and bias of quantifying tracer uptake with PET/CT. Medical physics. 2010;37:6035–6046. doi: 10.1118/1.3499298. [DOI] [PMC free article] [PubMed] [Google Scholar]
- 23.Boellaard R. Mutatis mutandis: harmonize the standard! J Nucl Med. 2012;53:1–3. doi: 10.2967/jnumed.111.094763. [DOI] [PubMed] [Google Scholar]
- 24.Young H, Baum R, Cremerius U, Herholz K, Hoekstra O, Lammertsma A, et al. Measurement of clinical and subclinical tumour response using [18F]-fluorodeoxyglucose and positron emission tomography: review and 1999 EORTC recommendations. European Organization for Research and Treatment of Cancer (EORTC) PET Study Group. Eur J Cancer. 1999;35:1773–1782. doi: 10.1016/s0959-8049(99)00229-4. [DOI] [PubMed] [Google Scholar]
- 25.Wahl RL, Jacene H, Kasamon Y, Lodge MA. From RECIST to PERCIST: Evolving considerations for PET response criteria in solid tumors. J Nucl Med. 2009;50:122S–150S. doi: 10.2967/jnumed.108.057307. [DOI] [PMC free article] [PubMed] [Google Scholar]
- 26.Boellaard R. Standards for PET Image Acquisition and Quantitative Data Analysis. J Nucl Med. 2009;50:11S–20S. doi: 10.2967/jnumed.108.057182. [DOI] [PubMed] [Google Scholar]
- 27.Doot RK, Kurland BF, Kinahan PE, Mankoff DA. Design considerations for using PET as a response measure in single site and multicenter clinical trials. Acad Radiol. 2012;19:184–190. doi: 10.1016/j.acra.2011.10.008. PMCID: 3251737. [DOI] [PMC free article] [PubMed] [Google Scholar]
- 28.Kinahan PE, Fletcher JW. Positron emission tomography-computed tomography standardized uptake values in clinical practice and assessing response to therapy. Semin Ultrasound CT MR. 2010;31:496–505. doi: 10.1053/j.sult.2010.10.001. PMCID: 3026294. [DOI] [PMC free article] [PubMed] [Google Scholar]
- 29.Nehmeh SA, Erdi YE. Respiratory motion in positron emission tomography/computed tomography: a review. Semin Nucl Med. 2008;38:167–176. doi: 10.1053/j.semnuclmed.2008.01.002. [DOI] [PubMed] [Google Scholar]
- 30.Boellaard R, O’Doherty MJ, Weber WA, Mottaghy FM, Lonsdale MN, Stroobants SG, et al. FDG PET and PET/CT: EANM procedure guidelines for tumour PET imaging: version 1.0. European journal of nuclear medicine and molecular imaging. 2010;37:181–200. doi: 10.1007/s00259-009-1297-4. PMCID: 2791475. [DOI] [PMC free article] [PubMed] [Google Scholar]
- 31.Lockhart CM, MacDonald LR, Alessio AM, McDougald WA, Doot RK, Kinahan PE. Quantifying and reducing the effect of calibration error on variability of PET/CT standardized uptake value measurements. J Nucl Med. 2011;52:218–224. doi: 10.2967/jnumed.110.083865. [DOI] [PMC free article] [PubMed] [Google Scholar]
- 32.de Langen AJ, Vincent A, Velasquez LM, van Tinteren H, Boellaard R, Shankar LK, et al. Repeatability of18F-FDG Uptake Measurements in Tumors: A Metaanalysis. J Nucl Med. 2012;53:701–708. doi: 10.2967/jnumed.111.095299. [DOI] [PubMed] [Google Scholar]
- 33.Takahashi Y, Oriuchi N, Otake H, Endo K, Murase K. Variability of lesion detectability and standardized uptake value according to the acquisition procedure and reconstruction among five PET scanners. Annals of nuclear medicine. 2008;22:543–548. doi: 10.1007/s12149-008-0152-1. [DOI] [PubMed] [Google Scholar]
- 34.Velasquez LM, Boellaard R, Kollia G, Hayes W, Hoekstra OS, Lammertsma AA, et al. Repeatability of18F-FDG PET in a multicenter phase I study of patients with advanced gastrointestinal malignancies. J Nucl Med. 2009;50:1646–1654. doi: 10.2967/jnumed.109.063347. [DOI] [PubMed] [Google Scholar]
- 35.Shankar LK, Sullivan DC. PET/CT in cancer patient management. Commentary. J Nucl Med. 2007;48(Suppl 1):1S. [PubMed] [Google Scholar]
- 36.Boellaard R, Oyen WJ, Hoekstra CJ, Hoekstra OS, Visser EP, Willemsen AT, et al. The Netherlands protocol for standardisation and quantification of FDG whole body PET studies in multi-centre trials. European journal of nuclear medicine and molecular imaging. 2008;35:2320–2333. doi: 10.1007/s00259-008-0874-2. [DOI] [PubMed] [Google Scholar]
- 37.Kinahan PE, Doot RK, Christian PE, Karp JS, Scheuermann JS, Zimmerman RE, et al. Multi-center comparison of a PET/CT calibration phantom for imaging trials. J Nucl Med Meeting Abstracts. 2008;49(Supplement 1):63P. [Google Scholar]
- 38.Doot RK. Factors affecting quantitative PET as a measure of cancer response to therapy [Dissertation] Seattle, WA: University of Washington; 2008. [Google Scholar]
- 39.Fahey FH, Kinahan PE, Doot RK, Kocak M, Thurston H, Poussaint TY. Variability in PET quantitation within a multicenter consortium. Medical physics. 2010;37:3660–3666. doi: 10.1118/1.3455705. [DOI] [PMC free article] [PubMed] [Google Scholar]
- 40.Soret M, Bacharach SL, Buvat I. Partial-volume effect in PET tumor imaging. J Nucl Med. 2007;48:932–945. doi: 10.2967/jnumed.106.035774. [DOI] [PubMed] [Google Scholar]
- 41.Zimmerman BE, Cessna JT. Development of a traceable calibration methodology for solid (68)Ge/(68)Ga sources used as a calibration surrogate for (18)F in radionuclide activity calibrators. J Nucl Med. 2010;51:448–453. doi: 10.2967/jnumed.109.070300. [DOI] [PubMed] [Google Scholar]
- 42.Kinahan PE, Allberg KC, Doot RK, Lockhart CM, McDougald WA, inventors. University of Washington, assignee. Calibration method and system for PET scanners. US7858925. United States patent. 2010 Dec 28;
- 43.Doot RK, Allberg KC, Kinahan PE. Errors in serial PET SUV measurements. J Nucl Med Meeting Abstracts. 2010;51(Supplement 2):126. [Google Scholar]


