Abstract
The ability of the cornea to transmit light while being mechanically resilient is directly attributable to the formation of an extracellular matrix containing orthogonal sheets of collagen fibrils. The detailed structure of the fibrils and how this structure underpins the mechanical properties and organization of the cornea is understood poorly. In this study, we used automated electron tomography to study the three-dimensional organization of molecules in corneal collagen fibrils. The reconstructions show that the collagen molecules in the 36-nm diameter collagen fibrils are organized into microfibrils (≈4-nm diameter) that are tilted by ≈15° to the fibril long axis in a right-handed helix. An unexpected finding was that the microfibrils exhibit a constant-tilt angle independent of radial position within the fibril. This feature suggests that microfibrils in concentric layers are not always parallel to each other and cannot retain the same neighbors between layers. Analysis of the lateral structure shows that the microfibrils exhibit regions of order and disorder within the 67-nm axial repeat of collagen fibrils. Furthermore, the microfibrils are ordered at three specific regions of the axial repeat of collagen fibrils that correspond to the N- and C-telopeptides and the d-band of the gap zone. The reconstructions also show macromolecules binding to the fibril surface at sites that correspond precisely to where the microfibrils are most orderly.
Keywords: automated electron tomography, microfibril, filaments
The cornea is a highly specialized tissue that combines optical transparency with mechanical resilience. These properties are directly attributable to the formation of an extracellular matrix containing narrow-diameter (≈36 nm) and heterotypic collagen fibrils that are spaced and organized uniformly into sheets of parallel fibrils. Each sheet is arranged orthogonal to its neighbor and to the path of light through the cornea. We reasoned that an understanding of the morphogenesis of the corneal stroma requires detailed knowledge of the structure of individual collagen fibrils.
Corneal fibrils are D-periodic (axial periodicity of collagen fibrils, where D ≈67 nm), uniformly narrow (≈30–35 nm in diameter), and indeterminate in length, particularly in older animals. The D-periodicity of the fibril arises from side-to-side associations of triple-helical collagen molecules that are ≈300 nm in length (i.e., the molecular length = 4.4 × D) and are staggered by D. The D-stagger of collagen molecules produces alternating regions of protein density in the fibril, which explains the characteristic gap and overlap appearance of fibrils negatively contrasted for transmission electron microscopy. Previous attempts to study the high-resolution structure of collagen fibrils have used primarily x-ray fiber diffraction of rat tail tendon (e.g., ref. 1 and references therein) and lamprey notochord (2) in which the fibrils are aligned and composed mostly of one genetic type of collagen. This method has yielded information about the triple-helical structure of the collagen molecules. However, there is controversy about the packing of the molecules in the fibril. In particular, about whether the fibril has a microfibrillar substructure or a crystalline packing of collagen molecules in a sheet structure (3–5). A five-stranded microfibrillar model was proposed originally by Smith (6) and then developed by Piez and Trus (7, 8) on the basis of sequence regularities and x-ray diffraction data. Recent analysis of synchrotron x-ray diffraction from rat tail tendon has yielded the best agreement with a microfibril substructure (9).
Corneal collagen fibrils are heterotypic structures composed of type I collagen molecules coassembled along with those of type V collagen (10). The collagen molecules comprise an uninterrupted triple-helical domain flanked by short telopeptides at the ends of each polypeptide chain (for review see ref. 11). These collagens are synthesized as precursor procollagens containing N- and C-terminal propeptides. The removal of the C-propeptides by procollagen C-proteinases (12) is required for the self-assembly of collagen molecules into fibrils (13), whereas cleavage of the N-propeptides is not. In cornea, the completely processed form of type V collagen retains a large N-terminal propeptide domain (14), which has been implicated in fibril diameter limitation (ref. 15 and references therein).
FACIT (Fibril Associated Collagens with Interrupted Triple helices) collagens have important roles in modifying the structure and function of collagen fibrils. Type IX collagen, for example, is a FACIT collagen that lies on the surface of collagen fibrils in cartilage where it is bound covalently to type II collagen molecules (16). The N-terminal noncollagenous domain of type IX collagen projects from the surface of the fibrils (17) and can bind cartilage oligomeric matrix protein (18, 19). Type XII and XIV collagens are FACIT collagens that occur in the cornea (20, 21). By analogy with type IX collagen, the N-terminal domains of type XII and XIV collagens might be expected to protrude from the surface of corneal collagen fibrils where they would be able to interact with proteins in the corneal stroma.
Other proteins, in addition to FACIT collagens, have important roles in modifying the structure and function of collagen fibrils. These include, for example, some leucine- rich repeat (LRR) proteoglycans (for review see refs. 22 and 23 and references therein). At least four corneal LRR proteoglycans have been identified (24). These include decorin, lumican, keratocan, and osteoglycin (also known as mimecan). The importance of LRR proteoglycans in corneal stroma development is exemplified in mice lacking lumican, for example, that develop corneal opacity (25), and in people who have mutations in kera, the gene encoding keratocan, who have cornea plana (26), in which the forward convex curvature is flattened leading to a decrease in refraction. Studies, therefore, to determine the structure of corneal fibrils and to identify, in three dimensions, the binding of FACIT collagens, LRR proteoglycans, and other macromolecules, are directly relevant to understanding the assembly of the corneal stroma in health and disease.
Materials and Methods
Sample Preparation.
We isolated individual collagen fibrils from adult bovine cornea by using established procedures (27) and prepared the fibrils for transmission electron microscopy by either freeze-drying in 2% (wt/vol) uranyl acetate or air drying in 5% (wt/vol) uranyl acetate. The grids were pretreated with colloidal gold (5 nm) to serve as fiducial markers in subsequent alignment of images for three-dimensional reconstruction.
Automated Electron Tomography (AET) and Three-Dimensional Reconstruction.
By using automated low-dose technique, we recorded tomographic series from 12 different fibrils over a tilt range of ±70° at 1 or 2° intervals, using a 200 kV FEG electron microscope (CM200, Philips, Eindhoven, The Netherlands), at an instrumental magnification of 20 K with a total accumulated dose of typically ≈600 electrons per Å−2. Automated low-dose acquisition of tilt series with standard tracking and focusing procedures was controlled by an external computer running the microscope control and image acquisition software (Tietz, Gauting, Germany). Images were recorded on a cooled CCD camera (1,024 × 1,024 pixels, Photometrics, Tucson, AZ). Reconstruction of three-dimensional volumes from tilt series was performed by the weighted back-projection method by using the imod software package (28).
Image Analysis on Three-Dimensional Image Data.
Fourier transforms and Fourier filtering on virtual slice image data were done by using the semper image analysis software (Synoptics, Cambridge, U.K.). For analysis of the longitudinal slices of the reconstruction, Fourier filtering was used to enhance the signal-to-noise ratio and to allow clearer visualization of microfibrillar substructure. For analysis of cross sections of the reconstructions, the original images were deblurred in the z axis to allow resolution of the microfibrils. Noise reduction was achieved by band-pass filtering in the spatial frequency range 1/2.5 nm−1 to 1/8 nm−1. Two measurements of lateral order were obtained. The first was to use autocorrelation on the filtered transverse slices. The second was to use relative peak-intensity measurements on Fourier intensities of the virtual slices. To obtain theoretical axial stain patterns, we used values for residue side-chain bulkiness, the amino acid sequences of type I collagen, the known triple-helical structure of the collagen molecules, and the quasi-quarter staggered alignment of collagen molecules in the fibril.
Results
The Gap–Overlap Structure Occurs Throughout the Fibril Cross Section.
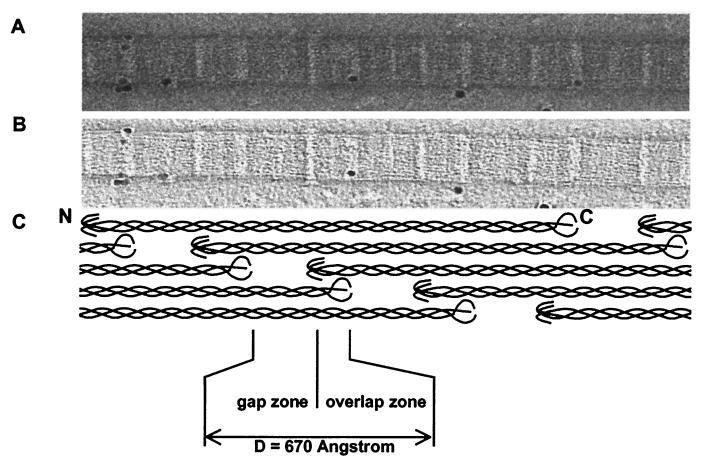
Fig. 1A shows part of a collagen fibril that was obtained by gentle homogenization of bovine cornea and prepared for transmission electron microscopy by negative staining in 2% (vol/vol) uranyl acetate. The isolation procedure produces a stable suspension of collagen fibrils that do not aggregate or fuse. The fibril was typical of those isolated from cornea in that it was ≈36 nm in diameter (29, 30) and exhibited the usual 67-nm D-periodicity of collagen fibrils. Three stain-excluding domains that repeated D-period were distinguishable in each D-period; one domain corresponded to the C-telopeptides of collagen, one domain corresponded to the N-telopeptides of collagen, and one domain was in the gap (stain-filled) zone of the fibril. These domains were identified by alignment with a model for the quarter-staggered arrangement of collagen molecules in the fibril (Fig. 1C). By using AET, we recorded tilt series from 12 different fibrils and computed three-dimensional reconstructions. Fig. 1B shows a slice taken through the center of one of the reconstructions, corresponding to five contiguous D-periods. The colloidal gold particles (the fiducial markers) were spherical in the reconstructions, which was indicative of accurate reconstruction. The slice exhibits the same three domains that were visible in the original negative-stained images (Fig. 1A) and shows that the axial structure of the fibril is the same throughout the body of the fibril.
Figure 1.
AET reconstruction of corneal collagen fibrils. Electron microscope data on negatively stained corneal collagen fibrils. Images were collected by using a TVIPS for AET on a Philips CM200 FEG at an instrumental magnification of 20 K with a total accumulated dose of 616 electrons per Å−2. (A) A single image at 0° from a −70°- to +70°-tilt series. (B) A virtual slice from the three-dimensional reconstruction showing a central section of the fibril shown in A. (C) Schematic representation of the axial arrangement of molecules in the D-periodic fibril, shown at the same magnification and in axial alignment with the images in A and B.
Resolution in the Reconstruction.
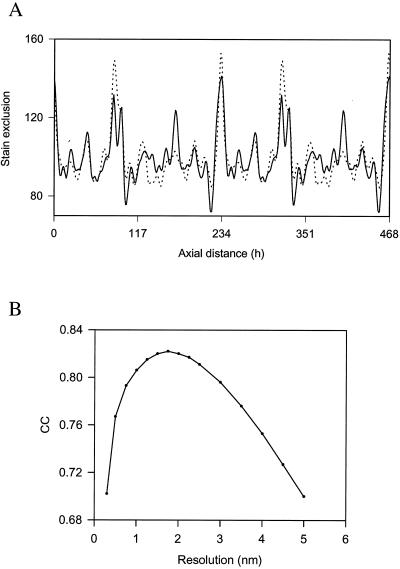
To determine the resolution in the x–y plane of the reconstruction, we generated a trace of the theoretical distribution of bulkiness within a collagen fibril D-period and compared this distribution of stain to that observed within the reconstruction. The results showed that best fit between experimental and theoretical traces (Fig. 2A) was obtained when the theoretical trace was smoothed to 18 Å (Fig. 2B). This approach has been used successfully to study the axial structure of collagen fibrils (31).
Figure 2.
Resolution in the axial structure. (A) Comparison of a theoretical (dotted line) stain-exclusion pattern with experimental (solid line) data from interior 4-nm-thick slices of the three-dimensional reconstruction, averaged over 20 D-periods. The theoretical pattern is based on the known axial structure of the triple helix and established correlation between stain exclusion and “bulkiness” (= volume/chain length) of each amino acid residue (43). The gap structure has been modeled in a compact form thereby removing the gap–overlap contrast in the fibril interior. The contributions of the N- and C-telopeptides have been calculated by using contraction factors, with respect to the residue spacing in the triple helix, of 0.3 and 0.7, respectively. The theoretical pattern has been smoothed to a resolution of 18 Å. h, axial residue spacing where D (67 nm) = 234 residues. (B) Plot of cross correlation coefficient (CC) between the experimental stain-exclusion pattern and the resolution of the smoothed theoretical pattern.
The Fibrils Had a Microfibrillar Substructure.
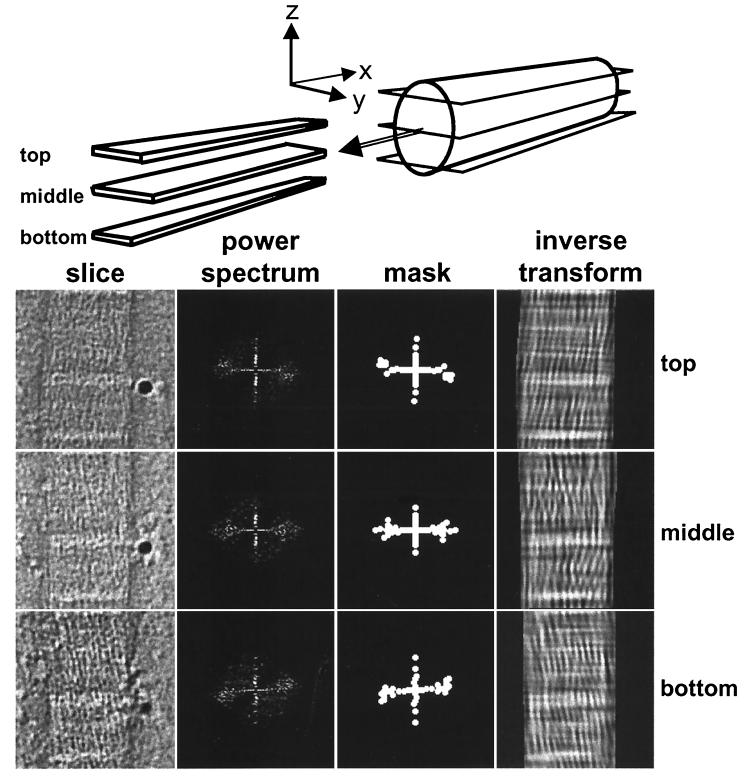
Fig. 3 (“slice”) shows x–y slices through the top, middle, and bottom of a typical reconstruct. Visual inspection of x–y slices through the reconstructions shows that the fibrils are constructed from narrow-diameter microfibrils. Fourier transform intensities of x–y slices corresponding to the top and bottom of the fibril (i.e., high and low values on the z axis, respectively, relative to the carbon support film on which the fibril was resting) exhibit equatorial reflections that were consistent with tilted microfibrils (Fig. 3 “power spectrum”). To display the arrangement of microfibrils, we produced a Fourier mask (Fig. 3 “mask”) and inverted the filtered transform (Fig. 3 “inverse transform”). The inverted transforms show that the microfibrils are tilted, in a right-hand orientation, with respect to the fibril long axis.
Figure 3.
Visualization of microfibrillar structure. Longitudinal virtual slices (x–y) through the three-dimensional reconstruction sampling the fibril in the top, middle, and bottom zones, as indicated schematically. The raw slice images are shown together with the power spectra masks that include the main peak intensities and the Fourier-filtered images by using these masks. A filamentous substructure is apparent in the original images and this is enhanced after filtering. The filaments show a predominant tilt of about +15° and −15° in the upper and lower zones of the fibril, respectively. The tilt direction changes rapidly in the central zone. Both tilt components can be seen in the middle slice.
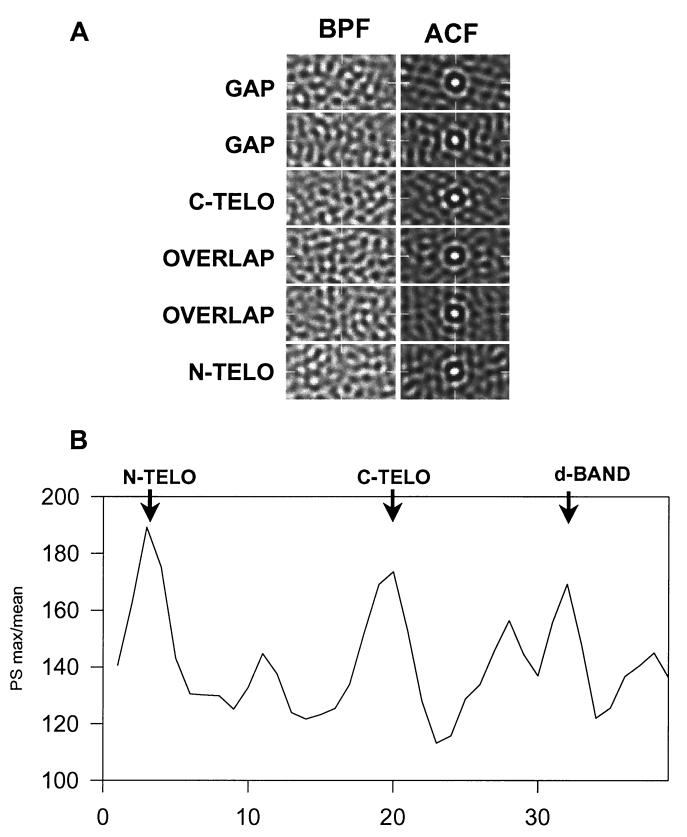
To determine the lateral (i.e., in the y–z plane, perpendicular to the long axis of the fibril) organization of collagen microfibrils in the fibril, we examined consecutive y–z slices and determined regions of ordered packing of the microfibrils. Fig. 4A shows band-pass filtered images of slices through the gap, telopeptide, and overlap regions of a typical reconstruct. The microfibrils (which are stain-excluding and therefore appear white in the image) are circular in cross section. Autocorrelation function analysis of the slices (Fig. 4A “ACF”) shows that the microfibrils exhibit preferred hexagonal packing at the C-telopeptide, gap, and N-telopeptide regions of the D-period. At these regions of highest order, the mean center-to-center spacing of microfibrils was 4.1 nm. The extent of order and disorder was displayed by plotting the intensity/mean of the power spectrum throughout the D-period (Fig. 4B).
Figure 4.
The lateral arrangement of microfibrils demonstrates a dependence on axial position within the D-period. (A) Typical transverse slice (y–z) images after band-pass filtering (BPF) (1/2.5–1/8 nm−1) and corresponding autocorrelation functions (ACF) are shown. The ACFs show first-order peaks at a spacing of ≈4.1 nm. The appearance of this inner ring varies from diffuse to a hexagonal arrangement of peaks [e.g., C-telopeptides (C-TELO)], which is indicative of regular hexagonal packing of microfibrils. (B) Quantitative measure of lateral order. The maximum peak height/mean intensity of the power spectra was plotted against axial position. The plot is an average over 8 D-periods for an individual fibril. The average D-period is shown in 38 slices. Regions of maximum order occur at the N- and C-telopeptides and at a region in the gap zone that corresponds to the position of the d-band, as defined from stain patterns.
Visualization of Surface-Bound Macromolecules.
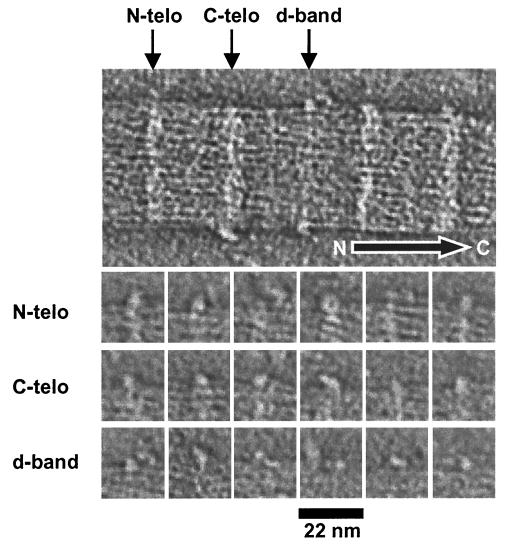
Fig. 5 shows a typical slice taken from one of the reconstructions in which surface-bound macromolecules are visible. The macromolecules are not evident in every D-period and range in size from 2 to 8 nm. Therefore, the smallest macromolecules are visualized at the limit of resolution of the reconstructions. Nevertheless, it was possible to discern that the surface-bound macromolecules occur at sites adjacent to the N-telopeptides of collagen, the C-telopeptides of collagen, and the d-band in the gap zone of the fibrils. Fig. 5 shows a gallery of these macromolecules. Within the category of macromolecules adjacent to the N-telopeptides, some views exhibited a doughnut or ring structure with an outer diameter of 6 nm. Some of the macromolecules adjacent to the C-telopeptides exhibit a stalk that connects a globular head to the fibril surface. The macromolecules associated with the d-band are the least conspicuous and are either small or closely associated with microfibrils at the fibril surface.
Figure 5.
Visualization of surface-bound macromolecules. The upper image is part of a central slice of a three-dimensional reconstruction of a negatively stained collagen fibril, showing macromolecules bound at preferred axial locations along the fibril. The arrow shows the molecular polarity of the fibril. The gallery shows views of 18 individual macromolecules that were bound to N-telopeptides (N-telo), C-telopeptides (C-telo), and the gap zone. Nine macromolecules are shown for each location. Note the doughnut (ring-shaped) structure at the N-telopeptides and the tadpole-shaped molecule bound to the C-telopeptides. The macromolecules bound to the gap zone were smaller and more conspicuous than those bound to the telopeptides.
Discussion
The present study has achieved a three-dimensional reconstruction of corneal collagen fibrils of sufficient resolution to reveal a microfibrillar substructure and macromolecules bound to the fibril surface. The microfibrils, which are uniform in diameter (≈4 nm) and tilted right-handed with respect to the long axis of the fibril, are the principal tensile element of the fibrils. The right-handed path of the microfibrils represents a final level of alternating handedness at successive levels of structure in the fibril, which begins with left-handed polypeptide chains in collagen molecules to right- handed super helices in triple-helical collagen molecules and then to left-handed collagen molecules within microfibrils (1). Presumably, alternating handedness among successive structural levels increases the resistance of the fibril to elongation. Furthermore, a fibril composed of microfibrils would be expected to be more resistant to fracture propagation than one composed of a crystalline arrangement of molecules.
A surprising observation is that the microfibrils exhibit a constant tilt angle (≈15°) irrespective of the radial distance from the center of the fibril. Raspanti et al. (32) have observed helical microfibrils (tilted by 17° to the fibril long axis) on the surface of fibrils in skin and aorta by using freeze-fracture and freeze-etch techniques. Two models were proposed to account for this helical arrangement. The “constant tilt angle” model composed microfibrils at the same tilt angle in coaxial layers. The “constant pitch” model described an arrangement in which microfibrils at the core of the fibril were approximately parallel to the long axis and those at the fibril surface exhibited a pronounced helical tilt. Our data support the constant tilt angle model as the basis for the structure of corneal collagen fibrils.
The three-dimensional reconstructions show that microfibrils have a relatively ordered lateral arrangement at the boundaries of the overlap regions (directly corresponding to the projected positions of the telopeptides of collagen molecules) and at a region within the gap region. In other regions of the D-period, the microfibrils exhibit a disordered arrangement. The observation that microfibrils are ordered at the telopeptide regions of corneal fibrils is consistent with x-ray data from stretched rat tail tendon, which shows crystalline packing in these regions, and biochemical studies of heterotypic fibrils containing type I and V collagen showing intermolecular covalent crosslinks involving specific lysyl and hydroxylysyl residues (33, 34). However, covalent crosslinking does not account readily for the ordered packing of microfibrils in the gap region. The molecular basis of this ordered packing is unclear.
A prominent feature of corneal fibril structure is the occurrence of macromolecules at sites on the fibril surface. Furthermore, these sites correspond precisely to the sites where the microfibrils are most ordered. Evidence from in vitro studies of collagen fibril formation suggests that the telopeptides are crucial for fibril formation (35–37). The present study shows that these sequences have additional roles in binding macromolecules from the extracellular matrix, which presumably have functions in regulating fibril assembly. The size of some of the macromolecules (after contrast enhancement for electron microscopy) was approximately the same as the resolution limit of the three-dimensional reconstruction. Therefore, it was not possible to identify the macromolecules from their shape. However, a likely candidate for some of these structures is the N-propeptide of type V collagen. Detailed studies demonstrate that these N-propeptides are located at the fibril surface and have a spiral distribution around the fibril (14).
It is also possible that some of the macromolecules seen in the reconstructions are LRR proteoglycans and FACIT collagens. LRR proteoglycans have been implicated in maintaining interfibrillar spacing (38) and inhibiting lateral fusion of fibrils. Lumican, for example, occurs in cornea and nonexpression leads to loss of transparency with increased fibril diameter and decreased spatial organization of fibrils (39). Decorin, for example, is known to bind to individual collagen molecules at a narrow region near the C terminus of type I collagen (40) or to two regions on the triple-helical domain (41). These sites would predict binding at the c1 and d/e bands in the collagen fibril, respectively. Noteworthy, the reconstructions show macromolecules binding to both these sites. Type XII and XIV collagens are further candidates for the macromolecules seen in the reconstructions. Both these collagens occur in cornea (42) but their precise locations are unknown.
Acknowledgments
The work was supported generously by a grant from the Wellcome Trust. The authors thank Drs. Per Bullough and Jordi Bella for helpful discussions.
Abbreviations
- FACIT
fibril-associated collagens with interrupted triple helices
- LRR
leucine-rich repeat
- AET
automated electron tomography
- D-period
axial periodicity of collagen fibrils
References
- 1.Wess T J, Hammersley A P, Wess L, Miller A. J Struct Biol. 1998;122:92–100. doi: 10.1006/jsbi.1998.3991. [DOI] [PubMed] [Google Scholar]
- 2.Eikenberry E F, Childs B, Sheren S B, Parry D A, Craig A S, Brodsky B. J Mol Biol. 1984;176:261–277. doi: 10.1016/0022-2836(84)90424-8. [DOI] [PubMed] [Google Scholar]
- 3.Hulmes D J S, Miller A. Nature (London) 1979;282:878–880. doi: 10.1038/282878a0. [DOI] [PubMed] [Google Scholar]
- 4.Fraser R D B, MacRae T P, Miller A. J Mol Biol. 1987;193:115–125. doi: 10.1016/0022-2836(87)90631-0. [DOI] [PubMed] [Google Scholar]
- 5.Miller A, Tocchetti D. Int J Biol Macromol. 1981;3:9–18. [Google Scholar]
- 6.Smith J W. Nature (London) 1968;219:157–158. doi: 10.1038/219157a0. [DOI] [PubMed] [Google Scholar]
- 7.Piez K A, Trus B L. J Mol Biol. 1978;122:419–432. doi: 10.1016/0022-2836(78)90419-9. [DOI] [PubMed] [Google Scholar]
- 8.Piez K A, Trus B L. Biosci Rep. 1981;1:801–810. doi: 10.1007/BF01114803. [DOI] [PubMed] [Google Scholar]
- 9.Wess T J, Hammersley A P, Wess L, Miller A. J Mol Biol. 1998;275:255–267. doi: 10.1006/jmbi.1997.1449. [DOI] [PubMed] [Google Scholar]
- 10.Birk D E, Fitch J M, Babiarz J P, Linsenmayer T F. J Cell Biol. 1988;106:999–1008. doi: 10.1083/jcb.106.3.999. [DOI] [PMC free article] [PubMed] [Google Scholar]
- 11.Kadler K E, Holmes D F, Trotter J, Chapman J A. Biochem J. 1996;316:1–11. doi: 10.1042/bj3160001. [DOI] [PMC free article] [PubMed] [Google Scholar]
- 12.Scott I C, Blitz I L, Pappano W N, Imamura Y, Clark T G, Steiglitz B M, Thomas C L, Maas S A, Takahara K, Cho K W Y, Greenspan D S. Dev Biol. 1999;213:283–300. doi: 10.1006/dbio.1999.9383. [DOI] [PubMed] [Google Scholar]
- 13.Kadler K E, Hojima Y, Prockop D J. J Biol Chem. 1987;262:15696–15701. [PubMed] [Google Scholar]
- 14.Linsenmayer T F, Gibney E, Igoe F, Gordon M K, Fitch J M, Fesler L I, Birk D E. J Cell Biol. 1993;121:1181–1189. doi: 10.1083/jcb.121.5.1181. [DOI] [PMC free article] [PubMed] [Google Scholar]
- 15.Birk D E. Micron. 2001;32:223–237. doi: 10.1016/s0968-4328(00)00043-3. [DOI] [PubMed] [Google Scholar]
- 16.Van der Rest M, Mayne R. J Biol Chem. 1988;263:1615–1618. [PubMed] [Google Scholar]
- 17.Vaughan L, Mendler M, Huber S, Bruckner P, Winterhalter K H, Irwin M I, Mayne R. J Cell Biol. 1988;106:991–997. doi: 10.1083/jcb.106.3.991. [DOI] [PMC free article] [PubMed] [Google Scholar]
- 18.Holden, P., Meadows, R. S., Chapman, K. L., Grant, M. E., Kadler, K. E. & Briggs, M. D. (2001) J. Biol. Chem., in press. [DOI] [PubMed]
- 19.Thur, J., Rosenberg, K., Nitsche, D. P., Pihlajamaa, T., Ala-Kokko, L., Heinegard, D., Paulsson, M. & Maurer, P. (2001) J. Biol. Chem., in press. [DOI] [PubMed]
- 20.Gordon M K, Gerecke D, Olsen B R. Proc Natl Acad Sci USA. 1987;84:6040–6044. doi: 10.1073/pnas.84.17.6040. [DOI] [PMC free article] [PubMed] [Google Scholar]
- 21.Gordon M K, Foley J W, Linsenmayer T F, Fitch J M. Dev Dyn. 1996;206:49–58. doi: 10.1002/(SICI)1097-0177(199605)206:1<49::AID-AJA5>3.0.CO;2-0. [DOI] [PubMed] [Google Scholar]
- 22.Iozzo R V, Murdoch A D. FASEB J. 1996;10:598–614. [PubMed] [Google Scholar]
- 23.Iozzo R V. J Biol Chem. 1999;274:18843–18846. doi: 10.1074/jbc.274.27.18843. [DOI] [PubMed] [Google Scholar]
- 24.Dunlevy J R, Beales M P, Berryhill B L, Cornuet P K, Hassell J R. Exp Eye Res. 2000;70:349–362. doi: 10.1006/exer.1999.0789. [DOI] [PubMed] [Google Scholar]
- 25.Chakravarti S, Magnuson T, Lass J H, Jepson K J, LaMantia C, Carroll H. J Cell Biol. 1998;141:1277–1286. doi: 10.1083/jcb.141.5.1277. [DOI] [PMC free article] [PubMed] [Google Scholar]
- 26.Pellagata N S, Dieguez-Lucena J L, Joensuu T, Lau S, Montgomery K T, Krahe R, Kivela T, Kucherlapati R, Forsius H, de la Chapelle A. Nat Genet. 2000;25:91–95. doi: 10.1038/75664. [DOI] [PubMed] [Google Scholar]
- 27.Graham H K, Holmes D F, Watson R B, Kadler K E. J Mol Biol. 2000;295:891–902. doi: 10.1006/jmbi.1999.3384. [DOI] [PubMed] [Google Scholar]
- 28.Kremer J R, Mastronarde D N, McIntosh J R. J Struct Biol. 1996;116:71–76. doi: 10.1006/jsbi.1996.0013. [DOI] [PubMed] [Google Scholar]
- 29.Craig A S, Robertson J G, Parry D A D. J Ultrastruct Mol Struct Res. 1986;96:172–175. doi: 10.1016/0889-1605(86)90018-2. [DOI] [PubMed] [Google Scholar]
- 30.Sayers Z, Koch M H J, Whitburn S B, Meek K M, Elliott G F, Harmsen A. J Mol Biol. 1982;160:593–607. doi: 10.1016/0022-2836(82)90317-5. [DOI] [PubMed] [Google Scholar]
- 31.Chapman J A, Tzaphlidou M, Meek K M, Kadler K E. Electron Microsc Rev. 1990;3:143–182. doi: 10.1016/0892-0354(90)90018-n. [DOI] [PubMed] [Google Scholar]
- 32.Raspanti M, Ottani V, Ruggeri A. Int J Biol Macromol. 1989;11:367–371. doi: 10.1016/0141-8130(89)90009-3. [DOI] [PubMed] [Google Scholar]
- 33.Niyibizi C, Eyre D R. Eur J Biochem. 1994;224:943–950. doi: 10.1111/j.1432-1033.1994.00943.x. [DOI] [PubMed] [Google Scholar]
- 34.Wu J J, Eyre D R. J Biol Chem. 1995;270:18865–18870. doi: 10.1074/jbc.270.32.18865. [DOI] [PubMed] [Google Scholar]
- 35.Leibovich J, Weiss J. Biochim Biophys Acta. 1970;214:445–454. doi: 10.1016/0005-2795(70)90303-x. [DOI] [PubMed] [Google Scholar]
- 36.Capali M J, Chapman J A. Biopolymers. 1982;21:2291–2313. doi: 10.1002/bip.360211115. [DOI] [PubMed] [Google Scholar]
- 37.Prockop D J, Fertala A. J Biol Chem. 1998;273:15598–15604. doi: 10.1074/jbc.273.25.15598. [DOI] [PubMed] [Google Scholar]
- 38.Scott J E. Biochem J. 1988;252:313–323. doi: 10.1042/bj2520313. [DOI] [PMC free article] [PubMed] [Google Scholar]
- 39.Chakravarti S, Petroll M, Hassell J, Jester J, Lass J H, Paul J, Birk D E. Invest Ophthalmol Visual Sci. 2000;41:3365–3373. [PMC free article] [PubMed] [Google Scholar]
- 40.Keene D R, San Antoni J D, Mayne R, McQuillan D J, Sarris G, Santoro S A, Iozzo R V. J Biol Chem. 2000;275:21801–21804. doi: 10.1074/jbc.C000278200. [DOI] [PubMed] [Google Scholar]
- 41.Lan Y, Cummings C, Sheehan J K, Kadler K E, Holmes D F, Chapman J A. In: Dermatan Sulphate Proteoglycans. Chemistry, Biology, Chemical Pathology. Scott J E, editor. London: Portland Press; 1993. pp. 183–192. [Google Scholar]
- 42.Kato T, Nakayasu K, Kanai A, Nishiyama T, Imamura Y, Hayashi T. Ophthalmic Res. 2000;32:215–221. doi: 10.1159/000055616. [DOI] [PubMed] [Google Scholar]
- 43.Chapman J A, Tzaphlidou M, Meek K M, Kadler K E. Electron Microsc Rev. 1990;3:143–182. doi: 10.1016/0892-0354(90)90018-n. [DOI] [PubMed] [Google Scholar]


