Abstract
FAK (focal adhesion kinase) and IGF-1R (insulin-like growth factor receptor-1) directly interact with each other and thereby activate crucial signaling pathways that benefit cancer cells. Inhibition of FAK and IGF-1R function has been shown to significantly decrease cancer cell proliferation and increase sensitivity to chemotherapy and radiation treatment. As a novel approach in human melanoma, we evaluated the effect of a small-molecule compound that disrupts the protein interaction of FAK and IGF-1R.
Previously, using virtual screening and functional testing, we identified a lead compound (INT2–31) that targets the known FAK-IGF-1R protein interaction site. We studied the ability of this compound to disrupt FAK-IGF-1R protein interactions, inhibit downstream signaling, decrease human melanoma cell proliferation, alter cell cycle progression, induce apoptosis and decrease tumor growth in vivo.
INT2–31 blocked the interaction of FAK and IGF-1R in vitro and in vivo in melanoma cells and tumor xenografts through precluding the activation of IRS-1, leading to reduced phosphorylation of AKT upon IGF-1 stimulation. As a result, INT2–31 significantly inhibited cell proliferation and viability (range 0.05–10 μM). More importantly, 15 mg/kg of INT2–31 given for 21 d via intraperitoneal injection disrupted the interaction of FAK and IGF-1R and effectively decreased phosphorylation of tumor AKT, resulting in significant melanoma tumor regression in vivo.
Our data suggest that the FAK-IGF-1R protein interaction is an important target, and disruption of this interaction with a novel small molecule (INT2–31) has potential anti-neoplastic therapeutic effects in human melanoma.
Keywords: small-molecule inhibitor, melanoma, FAK, IGF-1R
Introduction
FAK is a critical tyrosine kinase that modulates signaling, motility and survival pathways in response to extracellular signals.1,2 In addition to being a key player in regulating normal cellular activities such as adhesion, migration and survival, FAK is also implicated in cancer cell invasion, metastasis and survival.3,4 FAK interacts with key cell surface receptors including IGF-1R to modulate the malignant phenotype. Previously we have demonstrated that the N-terminal four-point-one, ezrin, radixin, moesin (FERM) domain of FAK interacts with the β subunit of IGF-1R.5
The FERM domain of FAK arranges into three sub-domains and regulates the kinase activity of FAK.6-8 The FERM domain binds directly to the kinase C-lobe when FAK is auto-inhibited, impeding access to the active site and protecting FAK’s activation loop from phosphorylation by Src. The inhibitory FERM-kinase interaction involves the F2 lobe of the FERM domain and a site on the C-lobe of the kinase centered on Phe596 (reviewed in ref. 7). The FAK FERM domain has been shown to associate with the β subunit of integrin and growth factors, implying the important role of FAK in integrating diverse cellular signaling pathways.
The β subunit of IGF-1R contains a transmembrane domain, a juxtamembrane domain, a tyrosine kinase domain and a C-terminal tail. Initiated by ligand binding, IGF-1R undergoes conformational changes and autophosphorylation that trigger an intracellular signaling cascade including activation of the mitogen-activated protein kinase (MAPK) and the phosphatidylinositol 3 kinase (PI3K) pathways, two main downstream signals of IGF-1R.9,10 IGF-1R signaling is required for cellular transformation by most oncogenes and facilitates the survival and spread of transformed cells.11 Interruption of IGF-1R signaling has been shown to inhibit tumor growth and block metastasis in a wide variety of tumor models.12
Melanoma patients with metastatic disease have a very poor prognosis with a five-year survival probability of less than 5%.13 Progression from benign nevi to malignant melanoma is paralleled by an increased expression of IGF-1R and FAK.14-16 The MAPK and PI3K-AKT signaling pathways are constitutively activated through multiple mechanisms in melanoma and play a major role in tumor progression.17,18
We have demonstrated that the interaction site of FAK and IGF-1R can be targeted with a small-molecule compound and that this inhibition induces cell detachment and apoptosis.5,19-21 Previously, we have identified a small-molecule compound that disrupts the interaction of FAK and IGF-1R at a dose of 50 μM.5 In this study, we demonstrate an anti-neoplastic strategy directed at melanoma by interfering with FAK and IGF-1R function at low micromolar (< 5 μM) concentrations through targeting of their protein-protein interaction (PPI) site. Our results show that use of a small molecule compound, (INT2–31), to inhibit downstream signaling of FAK/IGF-1R has significant therapeutic potential in the treatment of melanoma.
Results
INT2–31 disrupts the interaction of FAK and IGF-1R in melanoma cells
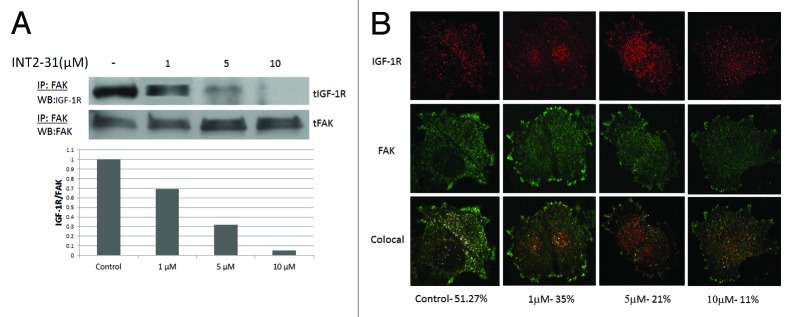
As previously described, we used structure based in silico modeling to select INT2–31 (NSC 344553) as our lead compound.5 In two melanoma cell lines, the ability of INT2–31 to perturb FAK and IGF-1R protein interactions was evaluated. INT2–31 disrupted binding in C8161 and A375 melanoma cancer cells at low micromolar concentrations (average IC50 of 2.7 μM range 2.1–5.2 μM and 3.2 μM, respectively) as demonstrated by immunoprecipitation (Fig. 1A; Fig. S1). Subsequently, in melanoma cells, confocal microscopy was performed demonstrating a decrease in colocalization of FAK and IGF-1R in the presence of INT2–31 treatment. Colocalization of FAK and IGF-1R was identified in 51% of pixels evaluated. This was reduced to 11% following exposure to 10 μM of INT2–31 (Fig. 1B). Finally, the concentration of INT2–31 in C8161 melanoma cells was determined utilizing mass spectrometry. In a cell lysate prepared from C8161 cells exposed to 10 μM of INT2–31 and washed extensively with PBS, the concentration of INT2–31 identified was calculated to be 658 ng/ml (1.75 μM). This demonstrates the ability of INT2–31 to enter cells in vitro.
Figure 1. Disruption of the interaction of FAK and IGF-1R. (A) Following exposure of cells to increasing doses of INT2–31 for 24 h, coimmunoprecipitation of FAK and IGF-1R is decreased in vivo in C8161 cells. Densitometry showing the ratio of IGF-1R to FAK is shown below the western blots. (B) Confocal microscopy utilizing dual fluorescent secondary antibodies against FAK and IGF-1R primary antibodies. At 24 h after treatment with increasing doses of INT2–31, colocalization (illustrated as merged white dots) of FAK and IGF-1R is decreased. Drug concentration and percent colocalization is demonstrated below color images and interpreted with LAS-AF imaging software. All shown figures are representative of experiments performed in triplicate.
INT2–31 reduces the viability of melanoma cells
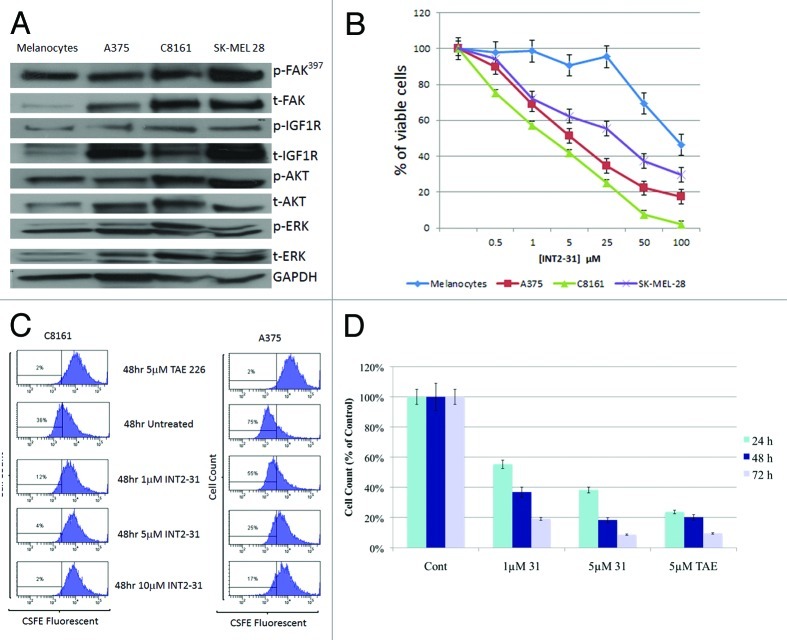
Upon exposure to increasing doses of INT2–31, viability was decreased in three human melanoma cell lines compared with human melanocytes (Fig. 2B). All three melanoma cell lines showed upregulated FAK and IGF-1R expression and increased sensitivity to INT2–31 compared with normal human melanocytes (Fig. 2A). The effects of INT2–31 varied in the three cell lines and was possibly related to constitutive FAK and IGF-1R activation, with the least sensitive cell line (SK-MEL-28) having the greatest expression of FAK and IGF-1R.
Figure 2. INT2–31 reduces the viability and proliferation of melanoma cells. (A) Expression of constitutive FAK, IGF-1R, AKT and ERK in the three melanoma cell lines and melanocytes. (B) INT2–31 inhibited the cell viability (MTT assay) of normal melanocytes and three melanoma cell lines in a dose-dependent fashion over 72 h. (C) CSFE cell proliferation assay with C8161 melanoma cells (left) and A375 melanoma cells (right) in the presence of increasing doses of INT2–31 or TAE 226 (dual FAK and IGF-1R kinase inhibitor) was performed at 24, 48 and 72 h. Representative data are shown after 48 h of treatment. (D) C8161 melanoma cell counts at 24, 48 and 72 h in the presence of INT2–31 or TAE 226. Shown figures are representative of experiments performed in triplicate.
INT2–31 inhibits melanoma cell proliferation and has effects dependent on the presence of FAK and IGF-1R
To assess the effects of INT2–31 on cell proliferation, a CSFE cell distribution assay was performed. As shown in Figure 2C, INT2–31 inhibited cell proliferation in both C8161 and A375 cells, with the effect being greater in C8161 cells. Evaluation of cell numbers with INT2–31 treatment demonstrated a potent time- and dose-dependent inhibition of the growth of C8161 melanoma cells (Fig. 2D). These results were similar to the findings seen by MTT assay (Fig. 2B).
To show target specificity of INT2–31, C8161 cells were transfected with FAK shRNA constructs resulting in transient knockdown of FAK (Fig. 3A). FAK shRNA1 was utilized for MTT assay due to greater efficiency of FAK knockdown compared with FAK shRNA2. C8161 cells expressing FAK shRNA1 were significantly less sensitive to the effects of INT2–31 than parental and mock-transfected cells. In addition, cells with stable knockdown of IGF-1R shRNA demonstrated significantly reduced sensitivity to INT2–31 (Fig. 3B). These findings were confirmed with the use of FAK wild-type and null fibroblasts. At low micromolar concentrations, FAK +/+ fibroblasts were significantly more sensitive to the effects of INT2–31 than FAK −/− fibroblasts (Fig. 3C). Similarly, specificity for IGF-1R was also shown during the treatment of IGF-1R-proficient and -deficient fibroblasts. IGF-1R −/− fibroblasts were significantly less sensitive to the effects of INT2–31 than IGF-1R +/+ cells. (p < 0.05, Fig. 3C).
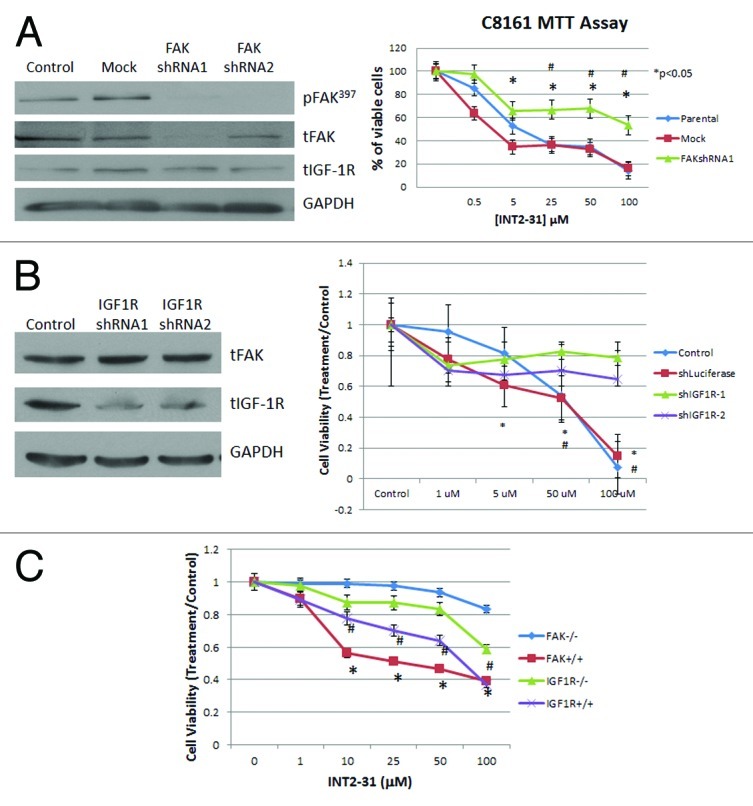
Figure 3. Effects of INT2–31 are FAK and IGF-1R specific. (A) Left panel: western blot showing knockdown of FAK with FAKshRNA after 48 h. Right panel: MTT assay (72 h) showing decreased sensitivity to INT2–31 treatment in FAK knockdown C8161 cells *p < 0.05, FAKshRNA1 vs. mock transfected, #p < 0.05, FAKshRNA1 vs. parental (B) Left panel: western blot showing knockdown of IGF-1R with IGF-1R shRNA after 48 h. Right panel: MTT assay (72 h) showing decreased sensitivity to INT2–31 treatment in IGF-1R knockdown cells compared with control (parental) and shLuciferase transfected cells. *p < 0.05, shIGF-1R vs. shLuciferase, #p < 0.05, shIGF-1R vs. control C. MTT assay at 72 h showing the increased effect of INT2–31 on FAK or IGF-1R wildtype (+/+) compared with FAK or IGF-1R null (−/−) fibroblasts. *p < 0.05, FAK +/+ vs. FAK −/−, #p < 0.05, IGF-1R +/+ vs. IGF-1R −/−. All shown figures are from triplicate data points from one experiment and are representative of experiments performed at least three times.
INT2–31 induces apoptosis and cell cycle arrest
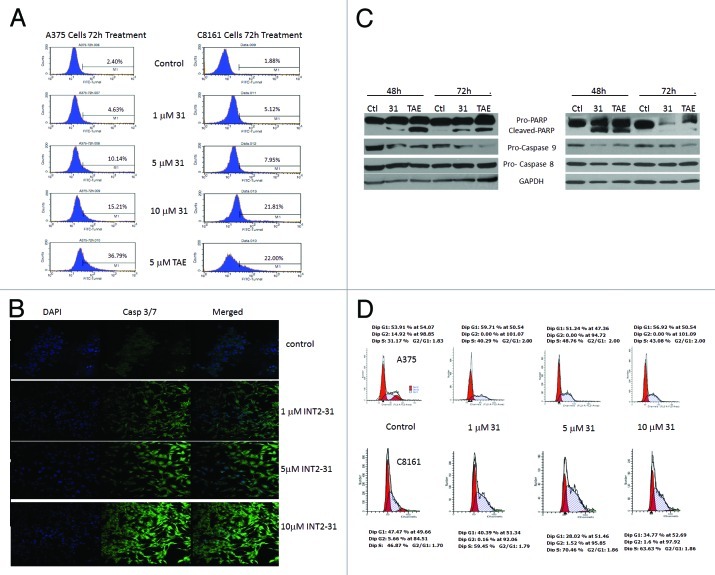
Assessment of TUNEL-positive cells by flow cytometry demonstrated a dose-dependent increase in apoptosis that is seen at 72 h following exposure to the drug (Fig. 4A). This was confirmed by analysis of caspase 3/7 activation following treatment for 72 h with increasing concentrations of INT2–31 and detected by confocal microscopy (Fig. 4B). Finally, the effect of INT2–31 was evaluated by immunoblot. PARP and caspase-9 cleavage was demonstrated starting at 48 h of treatment with INT2–31 (Fig. 4C). There was no significant effect of INT2–31 on caspase 8 levels, indicating induction of apoptosis through activation of the intrinsic pathway only.
Figure 4. INT2–31 induces apoptosis and cell cycle arrest. (A) Flow cytometry detection of TUNEL-positive cells in A375 (left) and C8161 (right) cells after 72 h treatment of INT2–31 or TAE226. Number of TUNEL-positive cells indicated as a percentage inside each figure. (B) Activated fluorescent caspase 3/7 detection with 72 h of treatment of INT2–31. DAPI staining demonstrated in the left panel, caspase 3/7 in the middle and the merged image is on the right. (C) Western blot analysis of biochemical markers of the apoptotic pathway at 48 h following treatment with 5 μM of INT2–31 or 5 μM TAE226 in A375 (left) and C8161 cells (right). All shown figures are representative of experiments performed in triplicate. (D) Cell cycle analysis of INT2–3-treated A375 and C8161 cells was performed at 24, 48 and 72 h. Representative data shown at 48 h demonstrates an increase in S fraction and a decrease in the G2 phase following INT2–31 treatment.
The ability of INT2–31 to induce cell cycle specific arrest was evaluated by flow cytometry in both A375 and C8161 cells. There was an accumulation of cells in the S phase with a concomitant decrease in G2 in both cell lines in the presence of INT2–31 (Fig. 4D). Further experiments have shown that INT2–31 treatment directly decreases DNA replication (data not shown). As shown in Figure S2, p21 protein expression is induced in both C8161 and A375 melanoma cells in the presence of INT2–31. Therefore, the ability of INT2–31 to disrupt FAK and IGF-1R interaction results in downstream inhibition of DNA synthesis and induction of a G1/S arrest.
INT2–31 decreases activation of AKT without inhibiting kinase activity
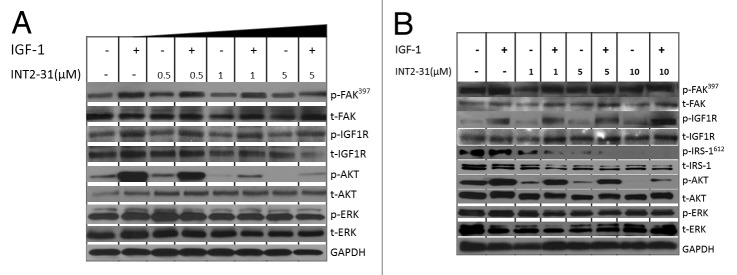
The ability of INT2–31 to disrupt survival pathways downstream of FAK and IGF-1R was analyzed in three melanoma cell lines at different concentration and treatment times (Fig. 5; Figs. S3 and S4). INT2–31 treatment resulted in a consistent inhibition of constitutive and IGF-1-induced signaling to AKT. However, basal phosphorylation of FAK and IGF-1R or the IGF-1-induced phosphorylation of IGF-1R was not altered by INT2–31 treatment. A plausible mechanism for the action of INT2–31 was observed through decreased phosphorylation of IRS-1 in a dose-dependent manner correlating with the decrease in p-AKT as demonstrated in Figure 5B. The decrease in phosphorylation of AKT in the presence of INT2–31 correlated with the effects on cell growth, viability and apoptosis, with C8161 cells having significant inhibition of p-AKT with 0.5–1 μM of treatment, while higher doses of INT2–31 were necessary to significantly decrease p-AKT in A375 and SK-MEL-28 cells (1–5 μM and 5–10 μM, respectively, Fig. 5A and B). Therefore, the effect of INT2–31 is dependent on alteration of signaling pathways downstream of IGF-1R and FAK. As shown in Figure S5, normal melanocytes do not have much constitutive IGF-1R protein expression. In addition, following stimulation with IGF-1, although p-IGF-1R increases, there is not a large increase in p-AKT. INT2–31 did not inhibit constitutive or IGF-1 induced phosphorylation of AKT in the melanocytes. It may be that pathways to AKT may not be as important for survival in melanocytes compared with the melanoma cells lines (where FAK and IGF-1R are overexpressed). In addition, it is possible that with reduced expression of IGF-1R in melanocytes there are fewer complexes of FAK and IGF-1R and fewer targets for INT2–31.
Figure 5. INT2–31 disrupts FAK-IGF-1R-dependent signaling and abrogates IGF-dependent AKT activation. Effect of increasing doses of INT2–31 in the presence and absence of IGF-1 (10 ng/dl) stimulation on signaling in (A) C8161 and (B) A375 cells after 24 h. All shown figures are representative of experiments performed in triplicate.
In order to determine if overexpression of the domain of FAK, which was shown to interact with IGF-1R,5 yields a similar phenotype to the INT2–31 compound, we overexpressed the F1, F2 and F3 domains of the N terminus of FAK into both C8161 and A375 melanoma cells. As shown in Figure S6, overexpression of the F2 domain (FAK-NT2 a.a.127–243) resulted in the greatest decrease in the IGF-1-stimulated phosphorylation of IRS-1 and AKT in both cell lines. Since INT2–31 was selected against the FAK F2 domain, this supports the specificity of this drug and the significance of targeting this region on FAK in melanoma cells.
Subsequently, the effect of this compound on the kinase activity of FAK and IGF-1R, and 57 other critical kinases important for growth and cell cycle control was determined (Table S1). At a dose of 10 μM, INT2–31 did not inhibit the kinase activity of FAK or IGF-1R and did not inhibit any of the other protein kinases by more than 27%. Therefore, INT2–31 disrupted binding of FAK and IGF-1R without inhibiting their kinase activity and inhibited melanoma cell viability and signaling in a dose- and time-dependent fashion.
INT2–31 decreases protein interactions, tumor p-AKT and growth in melanoma xenografts
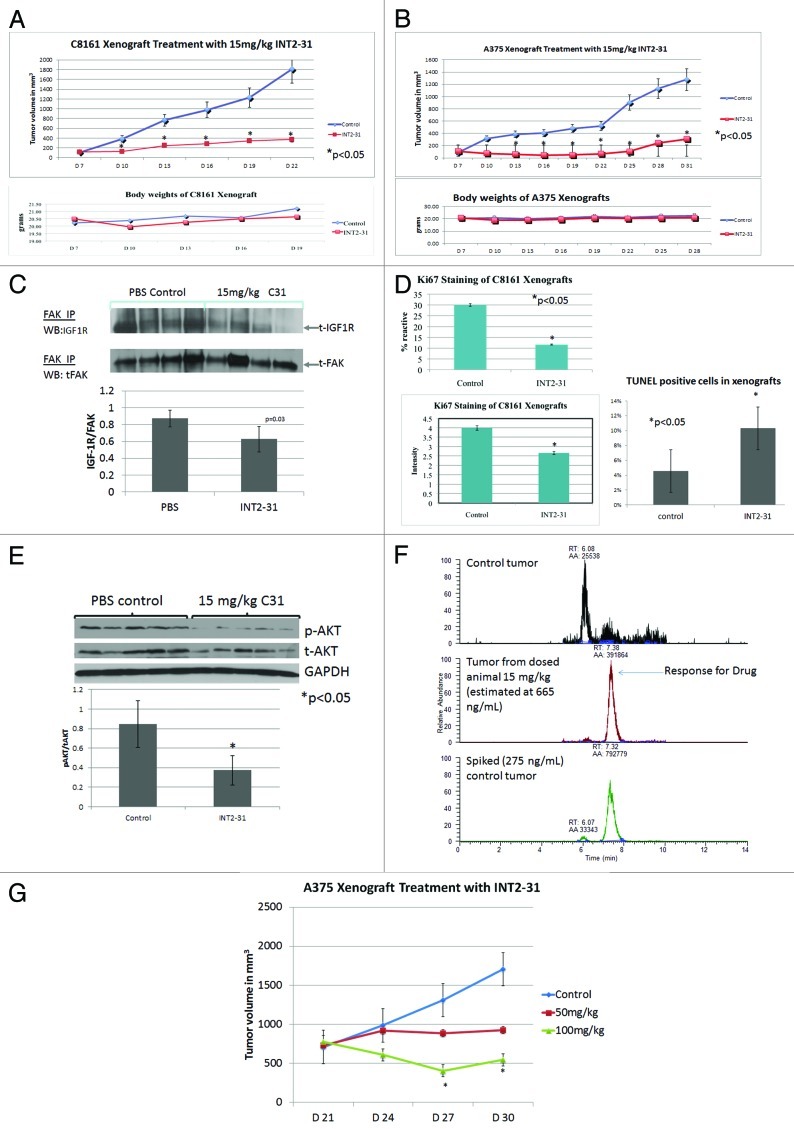
A subcutaneous melanoma xenograft model was utilized to evaluate the in vivo effects of INT2–31. As demonstrated in Figure 6A and B, daily intraperitoneal injection of 15 mg/kg of INT2–31 for 21 d resulted in a significant decrease in C8161 and A375 subcutaneous tumor growth compared with mice receiving PBS control (p < 0.05). At this concentration, the drug did not have serious toxic effects, as there was no significant difference in body weights between animals in each group. To assess the in vivo effects of INT2–31 on cell proliferation, C8161 xenografts were stained with Ki67 antibody (Fig. 6C). The percent of cells reactive to Ki67 and the intensity of Ki67 staining were significantly decreased in the tumors from mice treated with INT2–31. In addition, the percent of cells undergoing apoptosis was significantly increased in the tumors treated with INT2–31 (Fig. 6C, p < 0.05). This confirmed our in vitro data that the drug decreases proliferation and increases apoptosis of cancer cells.
Figure 6. INT2–31 decreases tumor cell proliferation and downregulates FAK-IGF-1R signaling in melanoma xenografts. Animals were inoculated with (A) C8161 or (B) A375 tumor cells and were treated with 15 mg/kg of INT2–31 vs. PBS. Animal weights are shown below growth curves (*p < 0.05). Tumor growth figures are representative of experiments performed in duplicate. (C) Ki67 staining of C8161 tumors treated with INT2–31, 15 mg/kg vs. PBS control. The percentage of reactive cells is shown in the left upper graph. The intensity of staining is shown in the lower left graph (*p < 0.05). TUNEL staining of excised tumors is shown on the right (*p < 0.05). (D) The effect of INT2–31 (15 mg/kg) on the co-IP of FAK and IGF-1R in C8161 tumors. Densitometric analysis of the ratio of IGF-1R/FAK is shown below (p = 0.03). (E) The effect of INT2–31 (15 mg/kg) on the phosphorylation of AKT in vivo. Densitometric analysis of the ratio of p-AKT/AKT/GAPDH is shown below the figure. (F) The intratumoral concentration of INT2–31 following treatment with 15 mg/kg via intraperitoneal injection (middle panel) compared with PBS treated tumor (upper panel) and PBS-treated tumor with INT2–31 added ex vivo (spiked into cell lysate). Determinations performed with laser capture mass spectrometry. (G) Effect of INT2–31 (50 mg/kg and 100 mg/kg) compared with PBS control on the growth of well-established A375 xenografts. Treatment was initiated 21 d after tumor inoculation when tumors were 750 mm3. There is a significant dose-dependent inhibition of tumor growth (*p < 0.05, all groups different from each other starting at day 27). All the data shown are from n = 5 per group except Figure 6D (n = 4/group).
The effect of INT2–31 on the in vivo interaction of FAK and IGF-1R in C8161 tumors was analyzed by immunoprecipitation (IP) of FAK from treated and untreated tumors. Western blot for IGF-1R and densitometric analysis demonstrates a significant decrease in the ratio of IGF-1R to FAK in each tumor showing a mean ratio in INT2–31 treated (0.63 +/− 0.17) compared with PBS treated (0.88 +/− 0.10, p = 0.03) tumors (Fig. 6D). In addition, we observed in tumors a decrease in p-AKT in animals treated with INT2–31 vs. PBS control (Fig. 6E). Finally, confirmation of INT2–31 accumulation in tumor cells in vivo from these treated animals was provided by mass spectrometry. From an intraperitoneal dose of 15 mg/kg, concentrations of approximately 665 ng/ml (1.8 μM) have been identified in the tumor (Fig. 6F). Therefore, in vivo effects of INT2–31 includes an increase in tumor cell apoptosis, decrease in FAK and IGF-1R protein interactions and decrease in tumor cell p-AKT. These effects are observed at concentrations near the IC50 identified from in vitro studies.
To determine if INT2–31 treatment results in an inhibition of growth of well-established tumors, mice with A375 tumors were treated with 50 mg/kg or 100 mg/kg of INT2–31. This resulted in a dose-dependent inhibition of tumor growth (Fig. 6G). Therefore, our lead compound, INT2–31, has significant effects in vivo, including disruption of the interaction of FAK and IGF-1R in tumor xenografts, resulting in a decrease in phosphorylation of AKT and a decrease in tumor growth.
Discussion
FAK and IGF-1R are tyrosine kinases that are overexpressed in cancer cells, and their interaction promotes cancer cell survival. IGF-1R-induced activation of phosphoinositide 3-kinase (PI3K) and FAK results in signaling to AKT/PKB and ERK, which prevents apoptosis and enhances cell proliferation. These molecules have been shown to undergo genomic amplification and are overexpressed in several cancer cell lines.22,23
FAK is a non-receptor tyrosine kinase that has crucial functions in many biological and pathological cellular processes. Although inhibition of FAK and IGF-1R kinase activities effectively suppresses growth of cancer cells, it may cause undesirable side effects. In this study, we demonstrate a novel therapeutic approach by utilizing a small molecule compound to interfere with the interaction of FAK and IGF-1R proteins in melanoma. We have selected our leading small molecule compound, (INT2–31, NSC 344553) via a screening technique using a structure-based in silico molecular modeling program.5 Our data demonstrated that INT2–31 effectively disrupts the interaction of FAK with IGF-1R in melanoma cells in a dose-dependent manner. Moreover, with confocal microscopy, we confirmed the intracellular effects of INT2–31 on FAK and IGF-1R interaction utilizing fluorescent staining.
INT2–31 has been identified to accumulate in melanoma cells by mass spectrometry. This small molecule inhibits FAK and IGF-1R-dependent signaling and cancer cell viability in vitro, induces apoptosis and inhibits in vivo tumor growth. The effect of INT2–31 was pronounced on cell proliferation with effects observed within 24 h of treatment (Fig. 2). Biochemical indicators of apoptosis were detected starting at 48 h after treatment with INT2–31 (Fig. 4C) with a more definitive induction at 72 h (Fig. 4A and B). Consistent with the effect of INT2–31 on cell proliferation was an accumulation of cells in the S phase of the cell cycle. However, the effect on cell cycle was small compared with the effect on cell proliferation.
Our results demonstrate that overexpression of the FAK domain that interacts with IGF-1R,5 utilized for the selection of INT2–31, also results in a similar phenotypic pattern of inhibition of IRS-1 and AKT phosphorylation compared with INT2–31 treatment. This supports the importance of this domain of FAK for the development of novel drugs that disrupt FAK and IGF-1R protein function. It remains possible that targeting of this FAK domain will disrupt the interaction of other key growth factor receptors or cytoplasmic proteins. To narrow down the exact site of binding of NSC344553 on FAK, we are currently preparing site-specific mutations for future studies.
The results from our in vitro and in vivo studies demonstrate that INT2–31 treatment increases tumor cell apoptosis, decreases FAK and IGF-1R protein interactions and decreases tumor cell p-AKT. These effects are observed with intratumoral drug concentrations near the IC50 identified from in vitro studies. In addition, with INT2–31 treatment, the IC50 for cell proliferation and apoptosis is in the low micromolar range and correlates well with the dose required for disruption of protein-protein interactions. Other studies have confirmed the ability to select small molecule compounds to disrupt FAK-protein interactions with other cell surface receptors.24 The relative importance of FAK to integrate and amplify signaling events from the cell membrane to promote survival are likely to vary by tumor type and will be the subject of ongoing studies.
In summary, a small molecule compound that disrupts FAK and IGF-1R protein-protein interactions exhibits significant antitumor effects in vitro and in vivo.
Materials and Methods
Cell lines and cell culture
A375, SK-MEL-28 cells were obtained from ATCC. The C8161, FAK +/+ and FAK −/− MEF cell lines were kindly provided by Dr. William Cance (Roswell Park Cancer Institute). IGF-1R +/+ and −/− MEFs were kindly provided by Renato Baserga (Thomas Jefferson University). Melanocytes were from Lifeline Cell Technology. All cell lines have been cytogenetically tested and authenticated before the cells were frozen. Each vial of frozen cells was thawed and maintained in culture for a maximum of eight weeks. Enough frozen cells were available for each cell line to ensure that all cell-based experiments were conducted on cells that had been tested and cultured for eight weeks or less.
Reagents and antibodies
TAE226 was obtained from Novartis. Anti-FAK (4.47) and anti-phospho-tyrosine monoclonal (4G10) antibodies from Millipore. Anti-FAK (C20), anti-IGF-1Rβ (C20) and anti-IRS-1 antibodies from Santa Cruz Biotechnology. Anti-His and anti-GST antibodies from Sigma. Anti-phospho-IGF-1R, anti-IGF-1R and anti-phospho-IRS-1 antibodies from Calbiochem. Anti-phospho-FAK (Tyr397) from Biosource. Anti-caspase 8, anti-caspase 9, anti-phospho-AKT (Ser473), anti-AKT, anti-phospho-ERK1/2, anti-ERK1/2 and anti-PARP antibodies from Cell Signaling Technology. Anti-glyceraldehyde 3-phosphate dehydrogenase (GAPDH) antibody from Advanced ImmunoChemical. Anti-p21 monoclonal was the kind gift from Dr. Brian Law (University of Florida).
Cell viability (MTT) and CFSE proliferation assay
MTT assay was performed as previously described.19 For staining with carboxyfluoresceindiacetate succinimidyl ester (CFSE, Molecular Probes), 1 × 10⁷/ml cells were suspended in PBS and incubated at 37°C for five min with the 10 μM of CFSE. Staining was terminated by adding culture medium. The cells were washed once in PBS, resuspended in culture medium and plated. Stained cells were cultured with medium alone or with compound for 24, 48 and 72 h, fixed and analyzed by a FACS Calibur cytometer (Becton Dickinson). Unstained cells were included in all experiments and were used to set the conditions for flow cytometer.
Immunoprecipitation and western blotting
These assays were performed as previously described.20
Short hairpin RNA transfection of cells
The sequences of short hairpin RNAs against human FAK were: (5′-CCGGCCGATTGGAAACCAACATATACTCGAGTATATGTTGGTTTCCAATCGTTTTG-3′; 5′-CCGGGCCCAGAAGAAGGAATCAGTTCTCGAG AACTGATTCTTCTTCTGGGCTTTTTG-3′) and control shRNA 5′-TCCGAACGTGTCACGTTCTCTTGAAACGTGACACGTTCGGAGA-3′) (Open Biosystems). Cells were transfected using Lipofectamine 2000 reagent. A lentiviral-delivery system was used to introduce IGF-1R shRNA expression with sequences as previously described.21 Briefly, for lentiviral transduction of melanoma cells, the cells were split into 24-well plate and were transduced 17 h later. The cells were infected with LV-shIGF-1R (IGF-1R target site: 592–614 - 23mer: aa-caatgagtacaactaccgctt or target site: 2350–2375 - 25mer: aa-caaggagagaactgtcatttctaa) or LV-control in 500 ml DMEM complete medium for three hours. The cells were washed and continuously cultured in DMEM complete medium at 37°C and 5% CO2. The sequences of short hairpin RNAs against human IGF-1R were: Sense: 5′ -GATCCCGcaatgagtacaactaccgcttTTCAAGAGAaagcggtagttgtactcattgTTTTTTGGAAA-3′ and Sense: 5′ -GATCCCGcaaggagagaactgtcatttctaaTTCAAGAGAttagaaatgacagttctctccttgTTTTTTGGAAA-3′.
Apoptosis assays
After treatment, cells were prepared for TUNEL assay by utilizing an APO-BRDU kit (BD PharMingen). Stained cells were analyzed with a FACSCalibur cytometer. Calculation of the percentage of apoptotic cells in the sample was completed with CellQuest software (BD Biosciences).
For detection of activated caspase 3/7 enzymes, the caspase 3 and 7 FLICA kit was utilized (ImmunoChemistry Technologies). Imaging was with a Leica TCS SP5 laser-scanning confocal microscope with LAS-AF imaging software.
Cell cycle analysis
Following treatment with compound, cells were washed with PBS and fixed in 70% ethanol for 30 min on ice. Cells were washed and stained with propidium iodide in the presence of RNAase and analyzed by flow cytometry.
Kinase profiler screening
Kinase specificity screening was performed with Millipore’s Kinase Profiling Services.25 The screening was performed with 10 μM compound, INT2–31, ATP and kinase substrates against 59 recombinant kinases.
Confocal colocalization imaging
Briefly, as previously described,20 cells were incubated overnight with primary antibody (FAK 4.47) antibody at 1:50 dilution and IGF-1R antibody (Abcam, cat#39675 at 1:20 dilution) and then incubated with 1:500 dilution of secondary antibody (goat anti-mouse IgG Alexa Fluor 488 or goat anti-rabbit Alexa Fluor 594 at room temperature). Imaging was with a Leica TCS SP5 laser-scanning confocal microscope with LAS-AF imaging software.
Tumor growth in nude mice in vivo
All experiments were performed in compliance with NIH animal-use guidelines and under an IACUC approved protocol. Melanoma cells were injected, 5 × 10⁶ cells, subcutaneously into six-week-old athymic, female nude mice (Harlan Laboratory). When the tumor size reached 100 mm3, the INT2–31 was introduced by intraperitoneal injection at a dose of 15 mg/kg daily for 21 d. Tumor volume in mm3 was calculated using the formula [(width)2 × length]/2. Additional experiments were performed on day 21 after tumor inoculation, when the tumor size reached 750 mm3. INT-31 was introduced at a dose of 50 mg/kg or 100 mg/kg.
Immunohistochemistry
For assessment of apoptotic cells, staining was performed utilizing the Dead EndTM Calorimetric TUNEL System (Promega). Percent apoptotic cells were determined from counting at least 400 cells in a high power field (HPF).
Quantifying drug concentration in cells and cancer tissue
For quantifying the drug in cancer tissue, a LC/MS/MS method was developed employing selected reaction monitoring (SRM) on a Finnigan TSQ 7000 (Finnigan, now Thermo) in positive electrospray ionization mode (ESI) with an Agilent 1100 HPLC and autosampler (Agilent).26,27 The SRM transition used for the target drug was m/z 378 to m/z 166 at a collision energy of 28 eV and collision gas pressure of 2.5 mTorr with a scan time of 0.1 sec and width of 1 amu. ESI settings were as follows: sheath gas was 70, auxillary gas was 30, voltage was 4.5 kV and source collision induced dissociation was set to 10 V. The HPLC was operated at 0.3 mL/min with gradient elution using a Betabasic C18 column 150 x 2.1 mm x 5 um (Thermo) with a 10 uL injection. The gradient was held for 1 min at 90% A, ramped to 55% A over five min, held at 55% A for 3.5 min, quickly ramped down to 90% A in 0.1 min and held for 6.4 min to equilibrate before the next injection. Solvent A was 0.1% Formic acid in water and solvent B was 0.1% formic acid in acetonitrile. All solvents used were of HPLC grade and obtained from Fisher Scientific. Calibration standards were prepared in drug free cancer tissue by spiking in known concentrations of the drug to final concentrations of 10, 20, 50, 100 and 500 ng/mL. For calibration standards and blanks, 100 uL were aliquoted, while only 50 uL were aliquoted from the target samples due to small available volumes. Two hundred uL of methanol was added to the calibration standards and blanks, while 100 uL was added to the target samples to precipitate the proteins. All samples were vortexed for one min and placed in a refrigerator for five min before spinning down in a centrifuge at 20,400 rcf. The supernatant was transferred to another tube and dried down using a SpeedVac (Thermo) at low heat for approximately 1.5 h. The dried samples were then reconstituted in mobile phase, 100 uL for calibration standards and blanks, and 50 uL for target samples and transferred to autosampler vials with a 100 uL conical insert after mixing. A suitable internal standard was not found and so care was taken to ensure accuracy in volumes used for sample preparation.
Statistical analyses
Student’s t-test was performed to determine significance (p < 0.05).
Supplementary Material
Acknowledgments
The authors gratefully acknowledge the technical assistance of Di-Hua He and Steve McClellan. This work was supported by the following NIH K-08 award: CA113766 (S.N.H.).
Disclosure of Potential Conflicts of Interest
William G. Cance and Elena Kurenova are co-founders of CureFAKtor Pharmaceutical, which are developing FAK inhibitors for clinical use.
Footnotes
Previously published online: www.landesbioscience.com/journals/cc/article/21611
References
- 1.Hochwald SN, Golubovskaya GV. FAK as a target for cancer therapy. Gene Ther Mol Biol. 2009;13:26–35. [Google Scholar]
- 2.Schlaepfer DD, Mitra SK. Multiple connections link FAK to cell motility and invasion. Curr Opin Genet Dev. 2004;14:92–101. doi: 10.1016/j.gde.2003.12.002. [DOI] [PubMed] [Google Scholar]
- 3.Cance WG, Harris JE, Iacocca MV, Roche E, Yang X, Chang J, et al. Immunohistochemical analyses of focal adhesion kinase expression in benign and malignant human breast and colon tissues: correlation with preinvasive and invasive phenotypes. Clin Cancer Res. 2000;6:2417–23. [PubMed] [Google Scholar]
- 4.McLean GW, Carragher NO, Avizienyte E, Evans J, Brunton VG, Frame MC. The role of focal-adhesion kinase in cancer - a new therapeutic opportunity. Nat Rev Cancer. 2005;5:505–15. doi: 10.1038/nrc1647. [DOI] [PubMed] [Google Scholar]
- 5.Zheng D, Kurenova E, Ucar D, Golubovskaya V, Magis A, Ostrov D, et al. Targeting of the protein interaction site between FAK and IGF-1R. Biochem Biophys Res Commun. 2009;388:301–5. doi: 10.1016/j.bbrc.2009.07.156. [DOI] [PMC free article] [PubMed] [Google Scholar]
- 6.Corsi JM, Rouer E, Girault JA, Enslen H. Organization and post-transcriptional processing of focal adhesion kinase gene. BMC Genomics. 2006;7:198–204. doi: 10.1186/1471-2164-7-198. [DOI] [PMC free article] [PubMed] [Google Scholar]
- 7.Frame MC, Patel H, Serrels B, Lietha D, Eck MJ. The FERM domain: organizing the structure and function of FAK. Nat Rev Mol Cell Biol. 2010;11:802–14. doi: 10.1038/nrm2996. [DOI] [PubMed] [Google Scholar]
- 8.Schaller MD. Biochemical signals and biological responses elicited by the focal adhesion kinase. Biochim Biophys Acta. 2001;1540:1–21. doi: 10.1016/S0167-4889(01)00123-9. [DOI] [PubMed] [Google Scholar]
- 9.Dews M, Prisco M, Peruzzi F, Romano G, Morrione A, Baserga R. Domains of the insulin-like growth factor I receptor required for the activation of extracellular signal-regulated kinases. Endocrinology. 2000;141:1289–300. doi: 10.1210/en.141.4.1289. [DOI] [PubMed] [Google Scholar]
- 10.Vincent AM, Feldman EL. Control of cell survival by IGF signaling pathways. Growth Horm IGF Res. 2002;12:193–7. doi: 10.1016/S1096-6374(02)00017-5. [DOI] [PubMed] [Google Scholar]
- 11.Valentinis B, Morrione A, Peruzzi F, Prisco M, Reiss K, Baserga R. Anti-apoptotic signaling of the IGF-I receptor in fibroblasts following loss of matrix adhesion. Oncogene. 1999;18:1827–36. doi: 10.1038/sj.onc.1202471. [DOI] [PubMed] [Google Scholar]
- 12.Pollak M. Insulin and insulin-like growth factor signalling in neoplasia. Nat Rev Cancer. 2008;8:915–28. doi: 10.1038/nrc2536. [DOI] [PubMed] [Google Scholar]
- 13.Eggermont AM, Testori A, Marsden J, Hersey P, Quirt I, Petrella T, et al. Utility of adjuvant systemic therapy in melanoma. Ann Oncol. 2009;20(Suppl 6):vi30–4. doi: 10.1093/annonc/mdp250. [DOI] [PMC free article] [PubMed] [Google Scholar]
- 14.Kahana O, Micksche M, Witz IP, Yron I. The focal adhesion kinase (P125FAK) is constitutively active in human malignant melanoma. Oncogene. 2002;21:3969–77. doi: 10.1038/sj.onc.1205472. [DOI] [PubMed] [Google Scholar]
- 15.Kanter-Lewensohn L, Dricu A, Girnita L, Wejde J, Larsson O. Expression of insulin-like growth factor-1 receptor (IGF-1R) and p27Kip1 in melanocytic tumors: a potential regulatory role of IGF-1 pathway in distribution of p27Kip1 between different cyclins. Growth Factors. 2000;17:193–202. doi: 10.3109/08977190009001068. [DOI] [PubMed] [Google Scholar]
- 16.Kanter-Lewensohn L, Dricu A, Wang M, Wejde J, Kiessling R, Larsson O. Expression of the insulin-like growth factor-1 receptor and its anti-apoptotic effect in malignant melanoma: a potential therapeutic target. Melanoma Res. 1998;8:389–97. doi: 10.1097/00008390-199810000-00002. [DOI] [PubMed] [Google Scholar]
- 17.Jaiswal BS, Janakiraman V, Kljavin NM, Eastham-Anderson J, Cupp JE, Liang Y, et al. Combined targeting of BRAF and CRAF or BRAF and PI3K effector pathways is required for efficacy in NRAS mutant tumors. PLoS ONE. 2009;4:e5717. doi: 10.1371/journal.pone.0005717. [DOI] [PMC free article] [PubMed] [Google Scholar]
- 18.Smalley KS, Haass NK, Brafford PA, Lioni M, Flaherty KT, Herlyn M. Multiple signaling pathways must be targeted to overcome drug resistance in cell lines derived from melanoma metastases. Mol Cancer Ther. 2006;5:1136–44. doi: 10.1158/1535-7163.MCT-06-0084. [DOI] [PubMed] [Google Scholar]
- 19.Hochwald SN, Nyberg C, Zheng M, Zheng D, Wood C, Massoll NA, et al. A novel small molecule inhibitor of FAK decreases growth of human pancreatic cancer. Cell Cycle. 2009;8:2435–43. doi: 10.4161/cc.8.15.9145. [DOI] [PMC free article] [PubMed] [Google Scholar]
- 20.Liu W, Bloom DA, Cance WG, Kurenova EV, Golubovskaya VM, Hochwald SN. FAK and IGF-IR interact to provide survival signals in human pancreatic adenocarcinoma cells. Carcinogenesis. 2008;29:1096–107. doi: 10.1093/carcin/bgn026. [DOI] [PMC free article] [PubMed] [Google Scholar]
- 21.Zheng D, Golubovskaya V, Kurenova E, Wood C, Massoll NA, Ostrov D, et al. A novel strategy to inhibit FAK and IGF-1R decreases growth of pancreatic cancer xenografts. Mol Carcinog. 2010;49:200–9. doi: 10.1002/mc.20590. [DOI] [PMC free article] [PubMed] [Google Scholar]
- 22.Ruggeri BA, Huang L, Wood M, Cheng JQ, Testa JR. Amplification and overexpression of the AKT2 oncogene in a subset of human pancreatic ductal adenocarcinomas. Mol Carcinog. 1998;21:81–6. doi: 10.1002/(SICI)1098-2744(199802)21:2<81::AID-MC1>3.0.CO;2-R. [DOI] [PubMed] [Google Scholar]
- 23.Staal SP. Molecular cloning of the akt oncogene and its human homologues AKT1 and AKT2: amplification of AKT1 in a primary human gastric adenocarcinoma. Proc Natl Acad Sci USA. 1987;84:5034–7. doi: 10.1073/pnas.84.14.5034. [DOI] [PMC free article] [PubMed] [Google Scholar]
- 24.Kurenova EV, Hunt DL, He D, Magis AT, Ostrov DA, Cance WG. Small molecule chloropyramine hydrochloride (C4) targets the binding site of focal adhesion kinase and vascular endothelial growth factor receptor 3 and suppresses breast cancer growth in vivo. J Med Chem. 2009;52:4716–24. doi: 10.1021/jm900159g. [DOI] [PMC free article] [PubMed] [Google Scholar]
- 25.Millipore.com http://www.millipore.com/drugdiscovery/dd3/KinaseProfiler Billerica, MA, 2010.
- 26.Drexler DM, Garrett TJ, Cantone JL, Diters RW, Mitroka JG, Prieto Conaway MC, et al. Utility of imaging mass spectrometry (IMS) by matrix-assisted laser desorption ionization (MALDI) on an ion trap mass spectrometer in the analysis of drugs and metabolites in biological tissues. J Pharmacol Toxicol Methods. 2007;55:279–88. doi: 10.1016/j.vascn.2006.11.004. [DOI] [PubMed] [Google Scholar]
- 27.Garrett TJ, Yost RA. Analysis of intact tissue by intermediate-pressure MALDI on a linear ion trap mass spectrometer. Anal Chem. 2006;78:2465–9. doi: 10.1021/ac0522761. [DOI] [PubMed] [Google Scholar]
Associated Data
This section collects any data citations, data availability statements, or supplementary materials included in this article.


