Abstract
Objectives:
Obstructive sleep apnea (OSA) is common and treatable among the elderly. Yet, few older adults seek evaluation for OSA at sleep disorders centers. The authors assessed the feasibility of a two-stage screening procedure for obstructive sleep apnea syndrome (OSAS) in a community-based sample of older adults.
Design:
Prospective cohort study.
Setting:
Participants' domicile (in-home) and academic sleep research center.
Participants:
There were 452 Medicare recipients residing in the greater Philadelphia metropolitan area with the complaint of daytime sleepiness.
Interventions:
None.
Measurements and Results:
All participants underwent in-home unattended sleep studies that recorded airflow, and standard in-laboratory polysomnography. Additional measures included symptoms of sleep apnea, body mass index, neck circumference, age, and sex. When comparing diagnostic approaches, the best-performing single-stage model was one that combined apnea symptoms with age and neck circumference. This model had an area under the receiver operating characteristic curve (AUC) of 0.774 and negative posttest probability of 1.2%. The best-performing two-stage model combined symptoms, neck circumference, age, and sex in the first stage, followed by an unattended portable study with a corresponding AUC of 0.85 and negative posttest probability of 0.5%.
Conclusions:
Unattended, self-assembled, in-home sleep studies recording airflow and respiratory effort are most useful if applied in tandem with clinical data, including a carefully obtained sleep history. This two-stage model is accurate in identifying severe OSAS in older adults and represents a practical diagnostic approach for older adults. Incorporating clinical data was vital and increased accuracy well above that of unattended studies of airflow and effort alone.
Citation:
Morales CR; Hurley S; Wick LC; Staley B; Pack FM; Gooneratne NS; Maislin G; Pack A; Gurubhagavatula I. In-home, self-assembled sleep studies are useful in diagnosing sleep apnea in the elderly. SLEEP 2012;35(11):1491-1501.
Keywords: Aged adults, obstructive sleep apnea, portable sleep studies, screening
INTRODUCTION
Obstructive sleep apnea (OSA) has the characteristics of a disorder that should be targeted for screening: it is common, has a long latency between symptom onset and the occurrence of adverse events, is identifiable in this latent stage, and is amenable to treatment in the form of continuous positive airway pressure (CPAP).1 Among older adults, OSA has widely ranging prevalence rates of approximately 15–60%,2–6 a level that is higher than in middle-aged adults. Full polysomnography (PSG), the standard tool for diagnosing OSA, is expensive and requires travel to and from the sleep center. It is technically demanding and requires that the patient sleep in an unfamiliar laboratory environment. Unattended studies performed in the patient's home alternatively may be less likely to disturb sleep than in-laboratory studies.7 Novel, home-based approaches for case identification for older adults who reside in the community deserve investigation. However, most prior research examining screening approaches have focused on younger cohorts8 and may not be directly applicable to older individuals.
In previous studies, we developed and validated a two-stage approach for OSA among patients at sleep disorders centers and among a community-based sample of truck drivers.9,10 In the first stage, we developed a relative risk score for apnea. Data for this score are derived from self-reported symptoms of apnea, body mass index (BMI) (obesity is a major risk factor for the disorder),5,11 age, and sex.12 In some patients, the risk score will be high enough that the second-stage test is unwarranted, and in others, the risk of apnea is low enough that apnea can be excluded. In a third subset of patients in that study who were at intermediate risk, however, we administered a second stage test, finger oximetry, a simple, unattended study that counted the number of hourly desaturations. Because hypopneas may occur with little desaturation, use of airflow recording may be more sensitive in detecting events in some persons. The use of airflow to detect hypopneas/apneas improves the detection of sleep apnea with the sensitivity, as compared with oximetry alone, increasing from 75% to 100% and specificity from 85% to 92%.13
Currently we do not know how well this two-stage strategy will work in elderly individuals, but its simplicity and utility in other groups warranted an evaluation of its usefulness in the elderly. In the elderly, the association between obesity and sleep disordered breathing is less than in middle-aged individuals.2 Our specific hypothesis was that a two-stage screening procedure can reliably identify obstructive sleep apnea syndrome (OSAS) in an elderly cohort. To test this hypothesis, we conducted a prospective cohort study in a community-based sample of older adults who complained of sleepiness and assessed how well a two-stage screening procedure for OSAS works. We used the risk score described previously in the first stage and overnight assessment of airflow as the second stage test.
METHODS
Subject Selection
This study was part of a larger study evaluating sleep apnea case identification and outcomes of CPAP treatment in older adults with and without sleepiness. We obtained a list of study participants from Penn Partners in Healthy Living (PPHL), a consumer membership program for older adults. This list contained the name, age, race, and sex of Medicare recipients who reside near the University of Pennsylvania Health System (greater Philadelphia metropolitan region). Two thousand recipients who lived in ZIP codes adjacent to the University of Pennsylvania were mailed letters by PPHL, inviting them to participate. The letters were followed by a phone call or, for those without telephones or without listed telephone numbers, by a personal visit. PPHL then provided us with the list of 556 individuals who were willing to be screened. We then determined their eligibility to enroll using a questionnaire. We asked whether individuals had a problem staying awake during the day. If they answered “Yes” to this question, they were asked about the frequency of occurrence of this problem. For our larger study, an individual was identified as a potential case if he or she indicated that the frequency of sleepiness was every day or several (≥ 3) days per wk, or as a potential control if he or she reported that the frequency of sleepiness was never or rarely (once or twice per month). For the purpose of this current substudy analysis, we did not distinguish between cases and controls to avoid selection bias. Potentially eligible individuals were then contacted by the research coordinator, who conducted a second screening interview and invited potential participants to an in-person orientation. Individuals were encouraged to bring family members with them and were provided with transportation to and from the orientation session. Individuals willing and eligible to participate then provided written informed consent. Recruitment of these community-dwelling older adults occurred between 2001 and 2005. The Institutional Review Board of the University of Pennsylvania Medical Center approved the study protocol.
Eligibility
To determine eligibility, individuals were first administered the Multivariable Apnea Prediction (MAP) instrument.10,12,14 The formula used for the MAP instrument12 has been validated as a screening tool in an elderly population.14 This formula consisted of three questions about the frequency of symptoms of sleep apnea. We asked: During the past month, have you had, or have you been told about, the following symptoms: (1) snorting or gasping, (2) loud snoring, and (3) breathing stops, choking, or struggling for breath. Individuals rated symptom occurrence as: Never (0); Rarely, less than once/wk (1); Once or twice/wk (2); Three or four times/wk (3); Five to seven times/wk (4); Don't know (missing). The apnea symptom frequency score was computed as the mean of the nonmissing items, with a possible range of 0 to 4. Therefore, missing responses were imputed as the mean of the non-missing responses. We calculated the relative likelihood of apnea using this symptom score along with body mass index (BMI),15 age, and sex, using a published formula.12,14 Potential MAP values ranged from 0 to 1, with 1 representing the highest likelihood of sleep apnea.12 Values greater than 0.5 have been associated with an increased risk of OSA, defined as an apnea-hypopnea index (AHI) ≥ 20/h.10
We sought to recruit an equal number of study participants for each decile of the MAP between 0.0 and 1.0, in order of appearance, until we reached 40 in each decile. If the target number was reached within each decile, we ceased recruitment of individuals with that value of MAP but continued to recruit in the others. Individuals with extreme scores were rare, hence the decile 0.0–0.1 had only 20 individuals, and 0.9–1.0 decile had 15 individuals. This design was chosen to ensure heterogeneity in apnea risk in the sample, so that more precise estimates could be obtained for optimal cut-points in our prediction models. Study participants also completed an 8-item self-rated scale to determine the degree of excessive daytime sleepiness,16 the Epworth Sleepiness Scale (ESS, range 0–24). An ESS score > 10 indicates pathologic sleepiness.16,17
We excluded individuals who: (1) were unable to speak English; (2) had cognitive impairment (scored ≤ 20 on the Mini-Mental Status Examination (MMSE)18; (3) screened positive for alcoholism via the CAGE questionnaire19; (4) reported use of sedative/hypnotic agents ≥ 3 nights/wk; (5) had medical conditions that would alter their breathing pattern during sleep or limit their ability to travel to the Sleep Center at the Hospital of the University of Pennsylvania, such as stroke or heart failure; (6) already had received a diagnosis of OSA; (7) had Cheyne-Stokes respiration or primarily central (≥ 25% central rather than obstructive) sleep apnea documented during a previous sleep study. The recruitment flow diagram is outlined in Figure 1.
Figure 1.
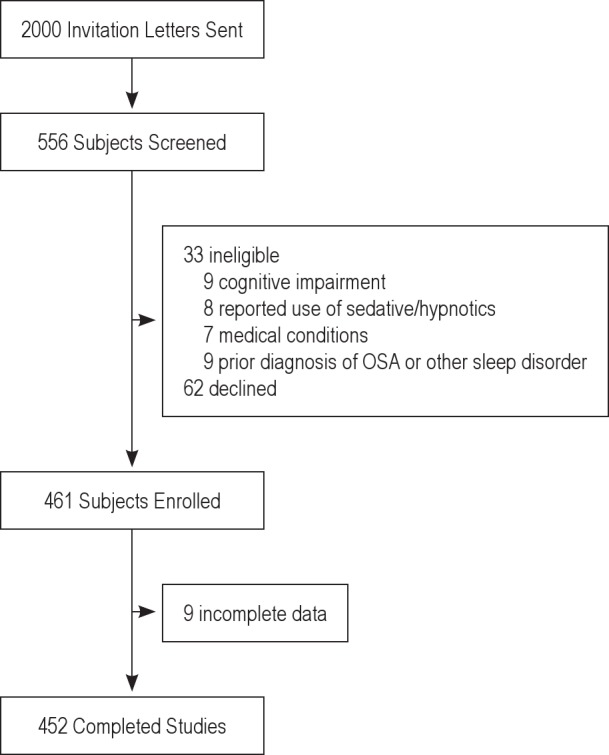
Enrollment diagram.
Home Sleep Studies
The home sleep study was performed using the ResCare AutoSet™ set to diagnostic mode (ResMed, Sydney, Australia).13,20,21 This device has been tested in comparison with in-laboratory PSG and found to have a sensitivity of 92% and specificity of 79% in middle-aged patients for detection of sleep apnea.20 All unattended studies were done within 2 mo before PSG; 99% were done within 1 day of PSG. The unit was delivered to the home and study participants were provided instruction and assistance regarding assembly on the night of the study. Study participants wore a nasal cannula to detect nasal pressure as a proxy for airflow. The studies were scored using the automated, internal algorithm of the device,21 and manually reviewed by a trained technician to compute an estimated unattended apnea-hypopnea index (uAHI, events/h). The ResCare AutoSet version 3.03 software counted apneas as 75% reductions in flow, whereas a separate sensor computed the sum of apneas plus hypopneas, using the algorithm described previously.21 Flow was compared with the average flow using the recent, preceding baseline (time constant 100 s). Sleep time was based on test time combined with a sleep diary, in which study participants recorded sleep onset, awakenings, and wakeup times. In the four study participants for whom sleep diary data were not available or incomplete, sleep times were determined based on examining regularity of respirations, movement, and airflow patterns. Although oximetry was used procedurally, it was not used in any of the home sleep study analyses reported in this paper.
Nocturnal PSG
We invited all study participants to undergo in-laboratory sleep recordings on a separate night, attended by a technician, using the Sandman (Embla® Systems Inc, Broomfield, CO). We applied the following leads: two electroencephalographic leads (C3/A2, O2/A1, with C4/A1 and O1/A2 as backups); two electrooculogram leads to the right and left outer canthi, referenced to the opposite-side mastoid; two submental (chin) and leg (tibialis) electromyograms; nasal pressure transducer22,23 and oral thermistor to assess airflow; chest and abdominal piezo belts to measure respiratory effort; and a finger oximeter (Nellcor™, Covidien, Boulder, CO) to measure oxyhemoglobin saturation. Blinded to questionnaire results, experienced sleep technicians and physicians scored polysomnograms24 and computed AHI as the number of apneas plus hypopneas divided by hours of sleep time. An apnea was 10 sec or more of airflow cessation, and a hypopnea was at least 50% airflow reduction for 10 sec or more, associated with a ≥ 3 % fall in oxyhemoglobin saturation or an arousal.
Case Definition
After data were collected, we defined a case as AHI ≥ 30/h combined with ESS > 10. We chose a cut-point of 30/h because others have noted that higher AHI values, such as ≥ 30/h, are most strongly associated with mortality in older adults.25 We included sleepiness as a criterion based on data from the Sleep Heart Health Study,26 where self-reported sleepiness (ESS > 10) denoted increased susceptibility to cardiovascular sequelae of OSA, particularly in patients with severe OSA (AHI ≥ 30/h).
Development of Two-Stage Models and Identification of the Optimal Parameter Set
The proposed two-stage algorithm had three parameters requiring estimation: (1) the MAP lower bound below which sleep apnea could be excluded, (2) the MAP upper bound above which study participants can be assessed to have OSA; and (3) the home study AHI cut-point (to be used in study participants with intermediate MAP values) above which study participants can be assessed to have OSA. The enumeration algorithm involved three components: (1) searching over MAP lower bound values from 0.1 to 0.9 in increments of 0.1; (2) searching over MAP upper bounds from each evaluated potential lower bound to 1.0 in increments of 0.1; and (3) searching over AHI cut-points estimated from a simple home study starting at 5 events per hour and increments of five until 30 events per hour is reached for each potential pair of MAP upper and lower bounds. Therefore, we explored 9 × 9 × 6 = 486 possible parameter sets. Different models would be expected to have different optimal parameter sets, so the optimal cut-point on the unattended sleep study would not necessarily be the same from one two-stage model to the next.
We defined the optimal parameter set as the one that minimized total prediction errors, computed as the sum of false-positive and false-negative predictions. We defined the base-case solution as the one that minimized overall error rate. We undertook sensitivity analyses to determine how the solution changed as a function of weighting the relative cost of missed cases to false-positive predictions and selected an “optimum weight” = 1.2, for weights larger than this value did not lower overall error rate significantly.
Additionally, we constructed 95% confidence intervals by using percentile-based bootstrapping methodology.10,27,28 For each of 1,000 bootstrap resamples, we determined the area under the receiver operating characteristic curve (AUC) value and standard error (SE). We selected the 2.5th and 97.5th percentile values of AUC as defining the 95% confidence interval. All statistical analyses were performed using SAS, version 9.1 (Cary, NC).
Model Development and Validation
We selected a subset randomly of 80% of study participants from the sample as a whole for model development. In this sample, we computed the AUC80% and, using the optimal parameter sets that minimized total error as defined previously, computed sensitivity, specificity, negative likelihood, and posttest probability.
Selection of the “Best” Model Using AUC
We calculated AUC in the remaining 20% validation subset (AUC20%), using the optimal model identified in the 80% estimation sample. We determined whether this was significantly different from AUC80%, to evaluate the generalizability of our findings to other populations of elderly individuals. We defined percent change as (AUC20% – AUC80%) / AUC80%. We classified the models into two categories, based on the magnitude of percent change: those with no or little percent change (−5% or higher) and those with moderate to high (≤ −5% or less) percent change. In the models with little or no percent change, we rank-ordered the models by descending order of AUC80% and selected the model with the highest AUC80% as the model of choice. We did this separately for single-stage and two-stage models separately.
RESULTS
Subject Characteristics
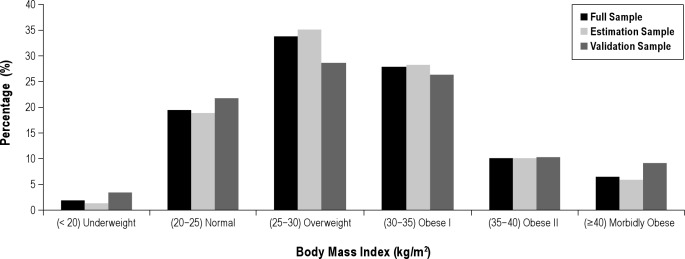
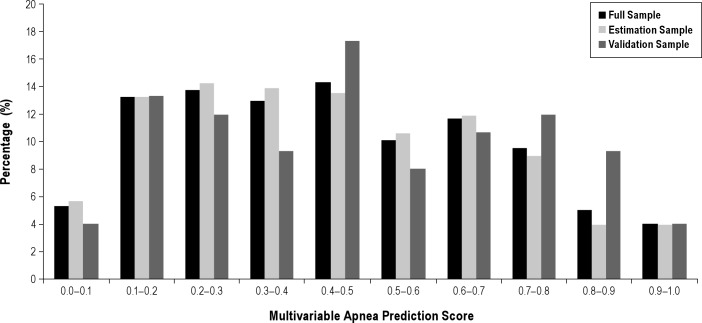
Table 1 shows that of the 452 study participants enrolled, 30% were male, with average (SD) age 71.4 (5.4) years, 251 (61%) were African-Americans, and 146 (36%) were Caucasians. The average neck circumference (NC) ± SD was 38.1 ± 3.87 cm. Obesity was prevalent, with an average ± SD BMI of 29.9 ± 6.2 kg/m2. The percentage of study participants in six BMI categories is shown in Figure 2 for all study participants and then in the estimation and validation subsamples. Alcohol consumption was common, with 42% reporting having at least one drink per week. For the group as a whole, mean ± SD MAP score was 0.45 ± 0.24; 67.6% had scores ≥ 0.3, and 18.6% had high scores ≥ 0.7. The distribution of MAP values in the estimation and validation subsample is essentially identical (Figure 3). Scores in extreme ranges were relatively uncommon. The estimation and validation subsamples had no statistically significant differences in demographic, anthropometric, clinical, and sleep study data (Table 1).
Table 1.
Patient characteristics
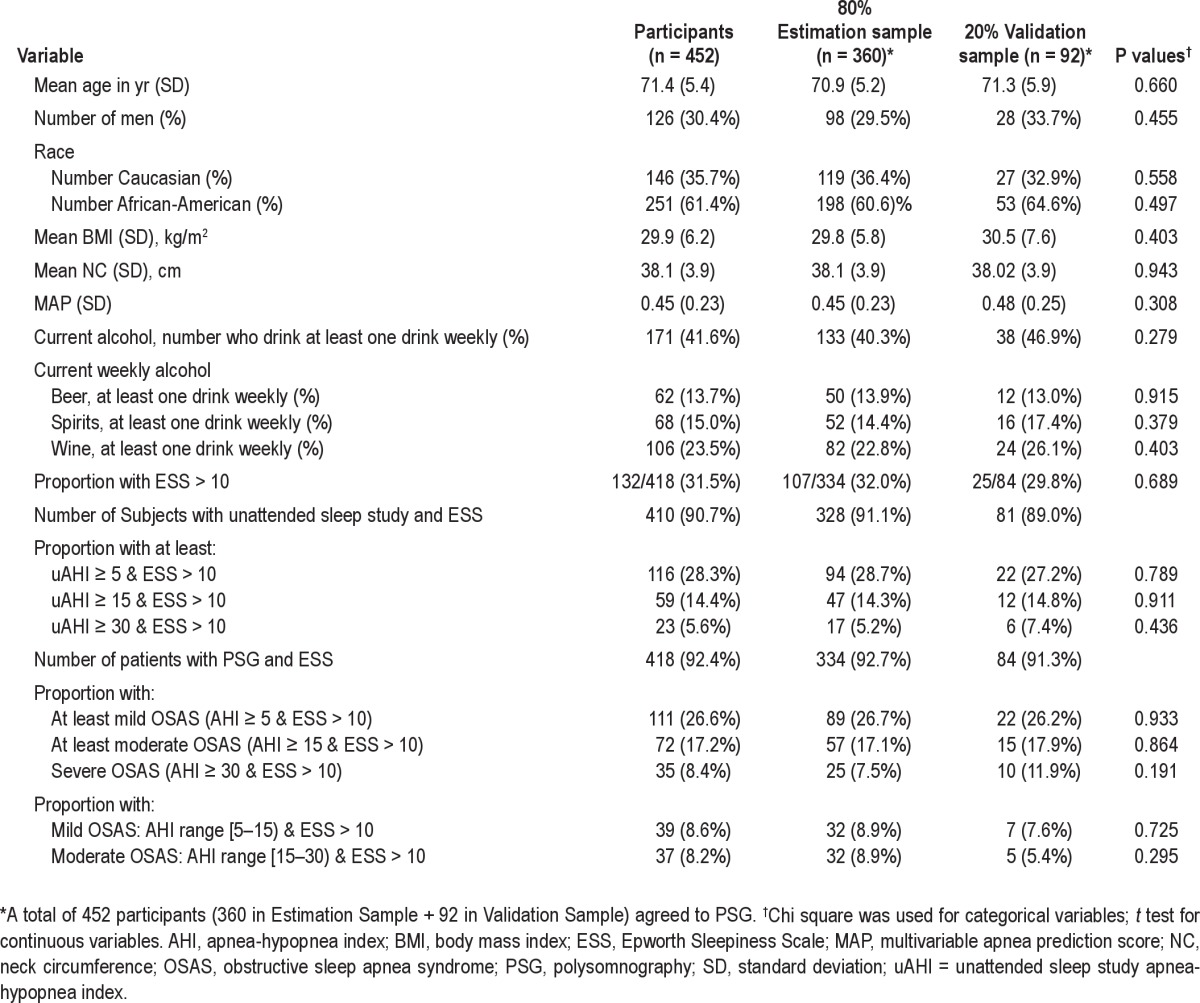
Figure 2.
Distribution of BMI in complete sample (dark gray bars) and separately in 80% estimation sample (light gray bars) and 20% validation sample (medium gray bars) among 447 older adults with available data. A high proportion of the population were obese; a total of 352 patients (78.7%) were at least overweight, 200 (44.7%) had some degree of obesity, and 29 (6.5%) had extreme obesity, with BMI ≥ 40 kg/m2.
Figure 3.
Distribution of multivariable apnea prediction scores (MAP) (range 0–1) among 384 older adults with available data. Data are shown for complete sample (dark gray bars) and separately in 80% estimation sample (light gray bars) and 20% validation sample (medium gray bars). A total of 67.53% had scores ≥ 0.3, and 18.5% had high scores ≥ 0.7.
Excessive Sleepiness Prevalence
In the group as a whole, 418 (92%) completed the ESS questionnaire, and 132 (32%) had pathologic sleepiness,16,17 defined by an ESS score of > 10. A similar proportion was found in the estimation and validation groups.
Prevalence of Sleep Apnea
Based on in-laboratory sleep studies, a total of 111 study participants (26.6%) had at least mild OSAS, defined as AHI ≥ 5/h and ESS > 10; 72 (17.2%) had at least moderate OSAS, with AHI ≥ 15/h and ESS > 10; and 35 (8.4%) had severe OSAS, with an AHI ≥ 30/h and ESS > 10 (Table 1). A similar prevalence of sleep apnea was found in the estimation and validation groups.
Unattended Sleep Studies
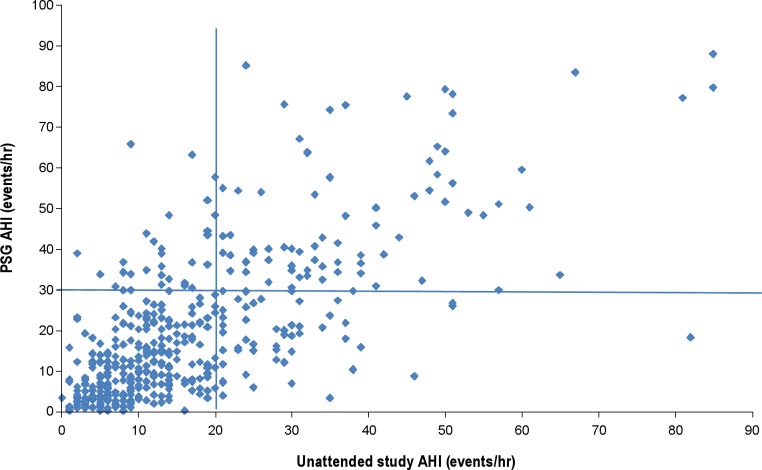
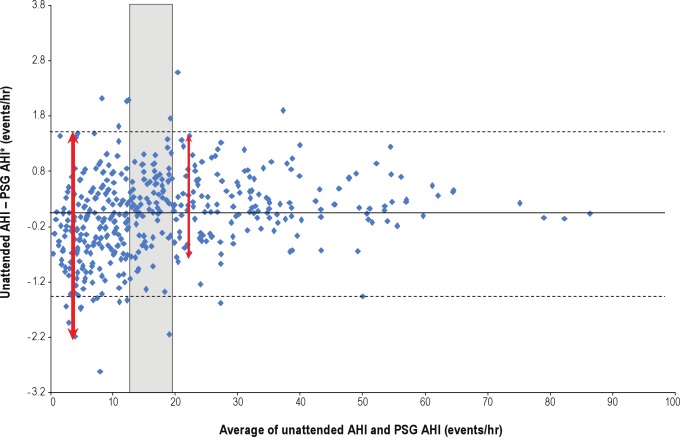
We had complete data on 442 of 452 (98%) unattended studies, and no studies were repeated. When evaluating prevalence of OSAS using the unattended study, a total of 116 (28.3%) had at least mild OSAS, with AHI ≥ 5/h and ESS > 10; 59 (14.4%) had at least moderate OSAS, with AHI ≥ 15/h and ESS > 10; and 23 (5.6%) had severe OSAS, with an AHI ≥ 30/h and ESS > 10 (Table 1). Similar values were found in the estimation and validation subsets. Figure 4 shows the level of agreement between PSG (AHI) and in-home, unattended sleep studies (uAHI, linear scale). Although most values were in agreement (note clustering of points in bottom left and top right groups), there were instances of underestimation, (top left) or overestimation (bottom right) by the unattended study. Figure 5 shows the Bland-Altman curve for the difference in AHI (In-laboratory) – uAHI (home) versus the average of (AHI + uAHI) in log units. We used log transformation in our prediction models to reduce the undue influence of large values. The difference is centered around zero, suggesting an absence of systematic bias. However, the greatest degree of vertical scatter occurs when AHI is below approximately 13–20/h, suggesting that in the elderly, unattended sleep studies are more accurate for AHI values above this range.
Figure 4.
Degree of agreement between unattended and full sleep studies. The apnea-hypopnea index (AHI) calculated by polysomnography (PSG) and unattended sleep study (uAHI) were in agreement in the bottom left of the figure and on the top right. In some studies, the unattended sleep study underestimated (top left) and overestimated (bottom right) AHI. The optimal cut-point for identifying cases in the unattended sleep studies was 20.9/h and is indicated on the figure.
Figure 5.
Bland-Altman analysis showing the difference in apnea-hypopnea index (AHI) (in-laboratory) – uAHI (unattended) as a function of the average, i.e., (AHI + uAHI) / 2. The difference is centered around zero, indicating an absence of systematic bias. The accuracy of portable, unattended sleep studies in this population is greatest for approximate AHI values above the range of 13–20/h (shaded box). The thick arrow shows area of greatest degree of vertical scatter compared to less vertical scatter above (thin arrow) AHI of 13–20/h. *Natural log values used for portable AHI and polysomnography (PSG) AHI.
Selection of the Optimum Weight for the Error Function
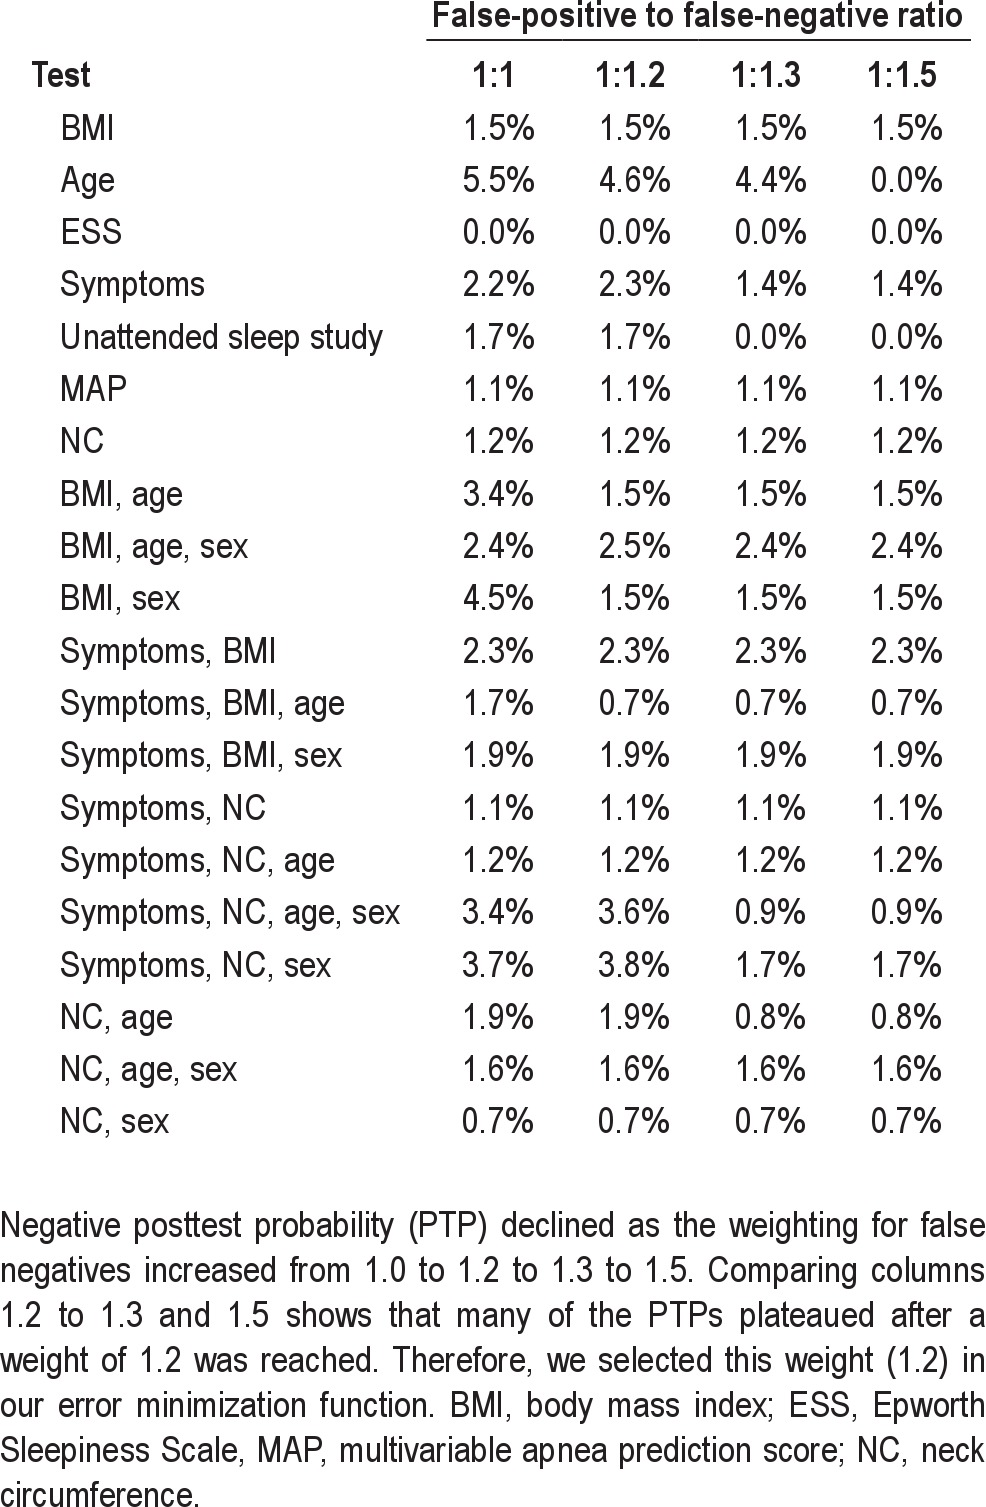
False negatives (missed cases) were weighted at 1.2 times the false positives. To arrive at 1.2, we reviewed a sensitivity analysis, which used a range of weights, from 1 to 2.0, in 0.1-unit increments. Table 2 summarizes the optimal negative likelihood for each weight for our single stage models, and shows that weights larger than 1.2 did not change negative likelihood or posttest probability. Thus, we found 1.2 as the weight in our error function: (FP + 1.2 × FN).
Table 2.
Posttest probabilities for varying ratios of false-positive to false-negative predictions
Single-Stage Models
Table 3 shows the single-stage models rank-ordered by discriminatory power (percent change). The top three rows show models whose AUC in the 20% validation subset have little or no percent change, compared with the AUC in the 80% subset (i.e., values > −5%). Within this subset, the models are rank-ordered in descending values of AUC, with the best performers listed on top. The best performing single-stage model was one that combined symptoms with neck circumference and age. The AUC (SE) was 0.774 (0.037), with little percent change (4.3%). Thus, if the score for a given patient, using this model, is below the cut-point of 0.676, then the negative posttest probability of still having apnea would only be 1.2% for that patient. Symptoms and NC (without age) performed similarly well, with AUC (SE) 0.762 (0.045), with small percent change (approximately −5%), and a negative posttest probability of 2.4%. This is not surprising, because the age range in this study is limited to elderly individuals (age > 65 yr). Symptoms alone also worked quite well, with AUC (SE) of 0.719 (0.043), with negligible percent change (−1.1%) and a negative posttest probability of 2.2%. Neck circumference alone resulted in an AUC (SE) of 0.735 (0.024) and a negative posttest probability of 0.7%. However, its larger percent change in the validation subset (−15.9%) suggests that this model may not produce robust predictions in other populations of elderly. Similarly, unattended sleep studies alone had a high AUC (SE) value of 0.791 (0.039), but was not selected as the best-performing single-stage model because of high percent change (−13.1%). The negative posttest probability, however, was low at 1.7%. The optimal cut-point on the unattended sleep study to identify individuals with severe OSA was 20.9/h.
Table 3.
Discriminatory power of top three best-performing single-stage models, compared with alternatives

Two-Stage Models
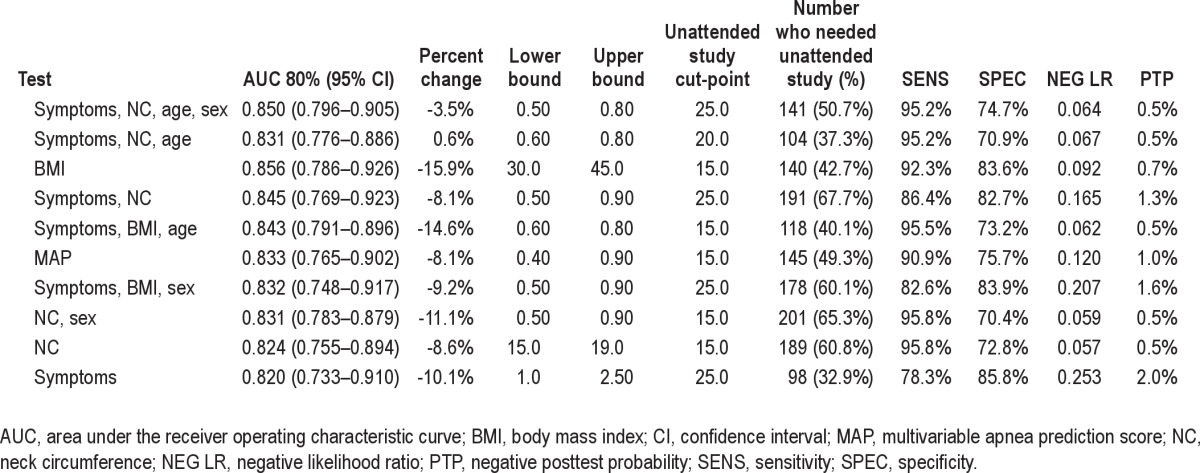
Not surprisingly, two-stage models performed better than one-stage models. We outline the best-performing two-stage models in Table 4. The top two rows show models for which percent change was small (> −5%). The best model combined symptoms, neck circumference, age, and sex in the first stage, followed by unattended recordings of airflow in the second stage; the AUC (SE) was 0.85 (0.028) with percent change of −3.5% and a very low negative posttest probability of only 0.5%. Symptoms, neck circumference, and age performed similarly well in the two-stage algorithm, with an AUC (SE) of 0.831 (0.028) and a negative posttest probability of 0.5%. BMI alone, with a lower bound of 30 kg/m2 and an upper bound of 45 kg/m2, followed by an unattended sleep study, resulted in a high AUC (SE) of 0.856 (0.035) and a negative posttest probability of 0.7%. A total of 140 study participants (42.7%) required unattended sleep studies because they had intermediate risk for apnea with BMI of 30–45 kg/m2. However, this model suffered from substantial percent change (AUC = 0.720, percent change = −15.9%), which prevented BMI from becoming the most accurate first stage for a two-stage model, although perhaps it was simplest. MAP also performed well as the first stage (AUC = 0.833. SE = 0.035), but was associated with a moderate percent change of −8.1%. We also considered the potential influence of race in the accuracy of the best performing single- and two-stage models and found no significant changes (data not shown).
Table 4.
Percent change and discriminatory power of top two best-performing two-stage models
DISCUSSION
Sleep apnea may affect up to 15–60% of older adults, yet many do not undergo a sleep evaluation due in part to the difficulty and expense associated with a standard clinical assessment, which includes an overnight in-laboratory sleep study. Medicare has recently made CPAP treatment available to elderly individuals based on the results of an in-home study.29 But how well in-home studies work in diagnosing sleep apnea in elderly populations is unknown. Developing effective screening paradigms for sleep apnea in older adults that can be applied in clinical settings is thus of public health importance. The current study examined the potential utility of various screening approaches for OSA in older adults with complaints of daytime sleepiness, a population at particularly high risk of mortality from sleep apnea.30 We found that combining age, neck circumference, and three brief apnea symptom questions led to an AUC of 0.774 and negative posttest probability of 1.2% for identifying severe OSAS in a single-stage approach. When considering two-stage approaches, the best performing model combined three apnea symptoms, neck circumference, age, and sex in the first stage, followed by unattended recording of airflow and respiratory effort, with a corresponding AUC of 0.85 and a negative posttest probability of 0.5%. This approach will allow healthcare providers to rule out sleep apnea with a relatively high degree of certainty and with minimal patient burden.
In-Home, Self-Assembled Sleep Studies Are Most Useful if Applied in Tandem With Clinical Data
When used in tandem fashion, we found that unattended, self-assembled, in-home recordings of airflow and respiratory effort during sleep enhanced the performance of simple clinical tools in identifying severe OSAS, defined as AHI ≥ 30/h and accompanied by daytime sleepiness (ESS > 10) in elderly individuals. The simple clinical tools were combinations of symptom frequency, age, sex, and either BMI or neck circumference. However, unattended sleep studies used alone, in the absence of clinical data, had more limited discriminatory power in finding cases of severe OSAS. Although the AUC value was relatively high at 0.791 in the model development cohort, the AUC in the validation cohort was only 0.688. Because of the large degree of percent change (−13.1%), our data do not support systematic application of these monitors in the absence of suggestive clinical data. The percent change in AUC is a function of the degree of robustness of a given model; a high percent change implies that the model may not perform as well in other groups. Reasons for high percent change in the validation subset may include statistical imprecision due to the small size of the validation sample, differences in the variance of the variables of interest in the validation subset, or estimation sample model overfit or misspecification. Small values of percent change provide some confidence that predictions may be generalizable to other elderly populations.
Similar to unattended recordings of airflow and respiratory effort used alone, BMI alone had limited predictive power (AUC = 0.581) in the validation cohort. BMI used in tandem with unattended sleep studies, however, was considerably more useful, with a much higher AUC value of 0.856 and a negative posttest probability of only 0.7%; however, this model still suffered from substantial percent change with AUC in the validation sample only equal to 0.720. Similarly, neck circumference and multivariable apnea prediction (which combines symptoms with BMI, age, and sex) predicted well in the validation sample but was unable to maintain its predictive value upon cross-validation. Therefore BMI, neck circumference, and multivariable apnea prediction were not among the best performing models, unless combined with unattended sleep studies. Given the relatively large decline in the performance of these prediction models upon cross-validation, our study does not support their use on their own as screening strategies for OSA in older adults.
Symptom Frequency, Neck Circumference, Age, and Sex Used in Tandem With Unattended, In-Home Sleep Recordings was Most Accurate in Case-Finding
In this cohort of elderly Medicare recipients, we found that the best method for identifying OSAS was the one that operated in two stages. The first stage combines apnea symptom frequency, neck circumference, and age, with or without sex as a variable. These data are used in tandem with a second-stage test, the unattended sleep recording of airflow and respiratory effort. Using a lower and upper bound values of 0.5 and 0.8 in the first stage and an uAHI cut-point of 25/h (if sex is included) or 20/h (if sex is left out of the model), the negative posttest probability of having OSAS was only 0.5% if the two-stage screening results were negative. The associated AUC values were 0.85 for symptoms, NC, age, and sex, and 0.831 for symptoms, neck circumference, and age without the inclusion of sex.
The finding that BMI was not among the best-performing models in this cohort of elderly patients contrasts with our previous findings in commercial truck drivers,10 in whom BMI was associated with an AUC of 0.802, considerably higher than the AUC of 0.757 in this elderly group. Others have also noted that the association of sleep apnea with BMI becomes attenuated with advancing age,2,6 which may be due to differences in pathophysiology related to aging.6,31 BMI is a proxy variable for obesity, a major risk factor for OSA. In the current study, it is possible that BMI may be a weaker proxy variable for obesity, because among older adults, for a given body mass, they will have less lean muscle mass compared with younger adults.32 If an older adult has less lean muscle mass and relatively greater adipose tissue, or more centrally distributed fat stores (considered a greater risk for OSA than peripherally distributed fat stores33), then a relatively lower BMI level may carry greater apnea risk in the elderly than in a younger adult. Indeed, in the older population studied here, the optimal cut-point of 30.4 kg/m2 to discriminate those at risk for severe OSAS is lower than the optimal cut-point of 32.7 kg/m2 in a younger cohort of commercial drivers.10 Because body fat in the abdominal cavity increases with aging, BMI becomes a poorer indicator of both overall and central fat stores in older men and women; with aging, growth hormone and testosterone levels decrease, which results in lower muscle mass and increased body fat.34 Estrogen also affects body fat distribution. Estrogen promotes the accumulation of gluteofemoral fat (peripheral body fat)35 and the loss of estrogen with menopause is associated with an increase in central fat.36 These findings emphasize that screening strategies developed in middle-aged populations cannot always be extrapolated to the elderly.
OSA has been considered underdiagnosed in the elderly due to atypical presentation, revealed by data from a convenience sample.37 Although some may debate whether OSA in elderly people represents a specific entity with distinctive features or the same disease as in younger individuals,38 healthcare utilization and morbidity is higher in elderly populations with OSA.39 A study comparing the healthcare utilization and morbidity of the elderly population with OSA with that of elderly patients without OSA found that elderly patients with OSA have high healthcare utilization due to associated cardiovascular morbidity and more use of psychoactive medications.39 Hence, a rationale exists for developing new screening methods for diagnosis of OSA in the elderly population. Furthermore, the prevalence of OSA in older adults is approximately 15–60%, a range for which even moderately precise screening tests can significantly affect the posttest probability, as compared with extremely rare or extremely common conditions, where only an extremely accurate test can change posttest probabilities.
We used a desaturation magnitude of 3% desaturation to define a hypopnea on in-laboratory studies, as this was conventional at the time the study was conducted. Currently, The Centers for Medicare and Medicaid Services (CMS) requires at least a 4% desaturation for a hypopnea to be scored. Had we used the 4% definition, our models would have yielded lower posttest probability values. This is because prevalence values using the more stringent 4% criterion would be lower, and a lower prevalence (i.e., pretest probability) would yield a proportionately lower post-test.40 Therefore, our use of 3% desaturation would be expected to bias the results in a conservative direction.
To our knowledge, this is the first study of screening for OSAS among community-dwelling older adults. Its strengths include: (1) prospective application of unattended and full sleep studies, after administration of first-stage screening tools; (2) blinding of scorers; (3) recruitment from the community rather than hospital or clinic-based population for model development and validation; and (4) inclusion of individuals with a broad range of preexisting risk, as determined by presence or absence of sleepiness. This inclusion of individuals is distinct from studies that recruit from specialized sleep centers, where patients often report preexisting sleepiness.
As Figure 4 suggests, a limitation of the AutoSet™ is that the device may underidentify hypopneas or misclassify events that occur during wakefulness as pathologic.41 This may be of particular concern in older adults, as they have more wakefulness after sleep onset than younger subjects.42 The ResCare AutoSet™, now known as the ResMed S9 AutoSet™, also uses a proprietary algorithm. Whether alternate systems have similar performance characteristics is not clear, and needs to be evaluated.
It is important to take into account the implications of our study design. The sample in this study was not a random sample but rather a sample chosen to recruit individuals across the range of MAP scores. This study design ensures that we have variance in OSAS risk, and therefore, in the severity of OSAS, so that a variety of prediction models could be evaluated. Despite our intention to recruit an equal number of study participants for each decile of the MAP we were not able to do so because scores in the extreme ranges were relatively uncommon. In addition, prevalence cannot be extrapolated from this artificially constructed sample. Another limitation is the use of self-report measures of sleepiness (ESS). However, such a measure is highly relevant to clinical practice, as currently available objective measures (i.e., multiple sleep latency or maintenance of wakefulness testing) are too expensive and burdensome to be practical for the routine clinical assessment of sleepiness in patients with OSA.
The association of OSA with excess daytime sleepiness (measured by ESS) among community-dwelling older adults has been described6,43; the Sleep Heart Health Study showed significant correlation between degree of OSA and ESS in the elderly, not limited to those with clinically apparent sleep apnea.43 Interestingly, despite the main inclusion criteria in this study of recruiting older adults with complaints of daily or frequent (≥ 3 days) daytime sleepiness, only 132 individuals (32%) had pathologic sleepiness (ESS score of > 10). This suggests that a response to a general question about sleepiness may not be equivalent to ESS score > 10, and that the ESS, therefore, may not be an ideal instrument for use in the elderly because it was developed for and validated in a predominantly middle-aged group (average age of experimental subgroups was 36–52 yr). These results, however, contrast with those in older males participating in the MrOs study, who had a 50% greater odds of sleepiness if they had sleep disordered breathing.6 The utility of the ESS in an older population deserves further study.
In conclusion, these results indicate a role for the use of clinical data in conjunction with unattended (type IV) recordings of airflow during sleep in identifying cases of severe OSAS among older adults. Granted that type IV monitors have not been approved by CMS, this method of diagnosis nonetheless may result in higher levels of OSAS diagnosis and treatment, ultimately leading to greater utilization of sleep health resources by older adults. There is a paucity of data regarding the efficacy of CPAP treatment in older adults with OSA.44 Future studies in elderly patients should address how utilization of in-home sleep recordings for identification of severe OSA among the elderly affect their cognitive and cardiovascular morbidity, quality of life, and mortality. Furthermore, studies are needed to define the specific characteristics of patients in whom unattended monitoring is likely to have the greatest effect on quality and duration of life. Finally, because our data relied on airflow rather than oximetry, novel diagnostic algorithms deserve exploration, in which a PAP device set in diagnostic mode for the first night is switched to therapeutic mode the following night using wireless technology. Future studies should assess whether such an approach may shorten time to treatment, lower costs, increase patient acceptance, and still offer favorable health outcomes.
DISCLOSURE STATEMENT
This was not an industry supported study; however, ResMed, Inc. provided an unrestricted loan for use of portable diagnostic sleep study equipment (AutoSet™) and had no role in protocol development, data collection, storage, analysis, or manuscript preparation. Dr. Gooneratne has received research grants from Takeda Pharmaceuticals and Respironics. Dr. Gurubhagavatula has been loaned equipment for research purposes from Embla, Inc. Dr. Maislin is the principal biostatistician of Biomedical Statistical Consulting (BSC). Dr. Pack has been endowed with funds provided by the Phillips/Respironics Foundation. The other authors have indicated no financial conflicts of interest.
ACKNOWLEDGMENTS
This work was performed at the University of Pennsylvania and supported by NIH T32 HL07713, R01-HL060756, K23 RR16068, and R01-OH009149. ResMed, Inc. provided an unrestricted loan for use of portable diagnostic sleep study equipment (AutoSet™) and had no role in protocol development, data collection, storage, analysis, or manuscript preparation.
ABBREVIATIONS
- OSA
obstructive sleep apnea
- CPAP
continuous positive airway pressure
- BMI
body mass index
- OSAS
obstructive sleep apnea syndrome
- PPHL
Penn Partners in Healthy Living
- MAP
multivariable apnea prediction score
- RDI
respiratory disturbance index
- AUC
area under the receiver operating characteristic curve
- SE
standard error
- MMSE
Mini Mental Status Examination
- ESS
Epworth Sleepiness Scale
- PSG
polysomnography
- EEG
electroencephalographic
- EOG
electrooculogram
- EMG
electromyograms
- AHI
apnea-hypopnea index
- SD
standard deviation
- NC
neck circumference
- CI
confidence interval
- SENS
sensitivity
- SPEC
specificity
- NEG LR
negative likelihood ratio
- PTP
negative post test probability
Footnotes
A commentary on this article appears in this issue on page 1445.
REFERENCES
- 1.Baumel MJ, Maislin G, Pack AI. Population and occupational screening for obstructive sleep apnea: are we there yet? Am J Respir Crit Care Med. 1997;155:9–14. doi: 10.1164/ajrccm.155.1.9001281. [DOI] [PubMed] [Google Scholar]
- 2.Young T, Shahar E, Nieto FJ, Redline S, Newman AB, Gottlieb DJ, et al. Predictors of sleep-disordered breathing in community-dwelling adults: the Sleep Heart Health Study. Arch Intern Med. 2002;162:893–900. doi: 10.1001/archinte.162.8.893. [DOI] [PubMed] [Google Scholar]
- 3.Ancoli-Israel S, Kripke DF, Klauber MR, Mason WJ, Fell R, Kaplan O. Sleep-disordered breathing in community-dwelling elderly. Sleep. 1991;14:486–95. doi: 10.1093/sleep/14.6.486. [DOI] [PMC free article] [PubMed] [Google Scholar]
- 4.Ancoli-Israel S, Klauber MR, Stepnowsky C, Estline E, Chin A, Fell R. Sleep-disordered breathing in African-American elderly. Am J Respir Crit Care Med. 1995;152:1946–9. doi: 10.1164/ajrccm.152.6.8520760. [DOI] [PubMed] [Google Scholar]
- 5.Young T, Palta M, Dempsey J, Skatrud J, Weber S, Badr S. The occurrence of sleep-disordered breathing among middle-age adults. N Engl J Med. 1993;328:1230–5. doi: 10.1056/NEJM199304293281704. [DOI] [PubMed] [Google Scholar]
- 6.Mehra R, Stone KL, Blackwell T, Ancoli Israel S, Dam TT, Stefanick ML, et al. Prevalence and correlates of sleep-disordered breathing in older men: osteoporotic fractures in men sleep study. J Am Geriatr Soc. 2007;55:1356–64. doi: 10.1111/j.1532-5415.2007.01290.x. [DOI] [PMC free article] [PubMed] [Google Scholar]
- 7.Ancoli-Israel S, Kripke DF, Mason W, Messin S. Comparisons of home sleep recordings and polysomnograms in older adults with sleep disorders. Sleep. 1981;4:283–91. doi: 10.1093/sleep/4.3.283. [DOI] [PubMed] [Google Scholar]
- 8.Abrishami A, Khajehdehi A, Chung F. A systematic review of screening questionnaires for obstructive sleep apnea. Can J Anaesth. 2010;57:423–38. doi: 10.1007/s12630-010-9280-x. [DOI] [PubMed] [Google Scholar]
- 9.Gurubhagavatula I, Maislin G, Pack AI. An algorithm to stratify sleep apnea risk in a sleep disorders clinic population. Am J Respir Crit Care Med. 2001;164:1904–9. doi: 10.1164/ajrccm.164.10.2103039. [DOI] [PubMed] [Google Scholar]
- 10.Gurubhagavatula I, Maislin G, Nkwuo JE, Pack AI. Occupational screening for obstructive sleep apnea in commercial drivers. Am J Respir Crit Care Med. 2004;170:371–6. doi: 10.1164/rccm.200307-968OC. [DOI] [PubMed] [Google Scholar]
- 11.Pack AI. Obstructive sleep apnea. Adv Intern Med. 1994;39:517–67. [PubMed] [Google Scholar]
- 12.Maislin G, Pack AI, Kribbs NB, Smith PL, Schwartz AR, Kline LR, et al. A survey screen for prediction of apnea. Sleep. 1995;18:158–66. doi: 10.1093/sleep/18.3.158. [DOI] [PubMed] [Google Scholar]
- 13.Bradley PA, Mortimore IL, Douglas NJ. Comparison of polysomnography with ResCare Autoset in the diagnosis of the sleep apnoea/hypopnoea syndrome. Thorax. 1995;50:1201–3. doi: 10.1136/thx.50.11.1201. [DOI] [PMC free article] [PubMed] [Google Scholar]
- 14.Maislin G, Dinges D, Pack F, Pack A. Validity study of the multivariable apnea index (MAP) in an elderly population. Sleep Res. 1996;25:288. [Google Scholar]
- 15.Garrow JS, Webseter J. Quetelet's index (W/H2) as a measure of fatness. Intl J Obesity. 1984;9:147–53. [PubMed] [Google Scholar]
- 16.Johns MW. A new method for measuring daytime sleepiness: the Epworth sleepiness scale. Sleep. 1991;14:540–5. doi: 10.1093/sleep/14.6.540. [DOI] [PubMed] [Google Scholar]
- 17.Johns MW. Daytime sleepiness, snoring, and obstructive sleep apnea: the Epworth sleepiness scale. Chest. 1993;103:30–6. doi: 10.1378/chest.103.1.30. [DOI] [PubMed] [Google Scholar]
- 18.Folstein MF, Folstein SE, McHugh PR. “Mini-Mental State:” a practical method for grading the cognitive state of patients for the clinician. J Psychiat Res. 1975;12:189–98. doi: 10.1016/0022-3956(75)90026-6. [DOI] [PubMed] [Google Scholar]
- 19.Mayfield D, McLeod G, Hall P. The CAGE questionnaire: validation of a new alcoholism screening instrument. Am J Psychiatry. 1974;131:1121–3. doi: 10.1176/ajp.131.10.1121. [DOI] [PubMed] [Google Scholar]
- 20.Mayer P, Meurice JC, Philip-Joet F, Cornette A, Rakotonanahary D, Meslier N, et al. Simultaneous laboratory-based comparison of ResMed Autoset with polysomnography in the diagnosis of sleep apnoea/hypopnoea syndrome. Eur Respir J. 1998;12:770–5. doi: 10.1183/09031936.98.12040770. [DOI] [PubMed] [Google Scholar]
- 21.Kiely JL, Delahunty C, Matthews S, McNicholas WT. Comparison of a limited computerized diagnostic system (ResCare Autoset) with polysomnography in the diagnosis of obstructive sleep apnoea syndrome. Eur Respir J. 1996;9:2360–4. doi: 10.1183/09031936.96.09112360. [DOI] [PubMed] [Google Scholar]
- 22.Condos R, Norman RG, Krishnasomy I, Peduzzi N, Goldring RM, Rapoport DM. Flow limitation as a non invasive assessment of residual upper airway resistance during continuous positive airway pressure therapy of obstructive sleep apnea. Am J Respir Crit Care Med. 1994;150:475–80. doi: 10.1164/ajrccm.150.2.8049832. [DOI] [PubMed] [Google Scholar]
- 23.Montserrat JM, Farre R, Ballester E, Felez MA, Pasto M, Navajas D. Evaluation of nasal prongs for estimating nasal flow. Am J Respir Crit Care Med. 1997;155:211–15. doi: 10.1164/ajrccm.155.1.9001314. [DOI] [PubMed] [Google Scholar]
- 24.Rechtschaffen A, Kales A, editors. Brain Information Services/Brain Research Institute, University of California, Los Angeles: Brain Information Services/Brain Research Institute; 1968. A manual of standardized terminology: techniques of scoring system for sleep stages of human subjects. [Google Scholar]
- 25.Ancoli-Israel S, Kripke DF, Klauber MR, Fell R, Stepnowsky C, Estline E, et al. Morbidity, mortality and sleep-disordered breathing in community dwelling elderly. Sleep. 1996;19:277–82. doi: 10.1093/sleep/19.4.277. [DOI] [PubMed] [Google Scholar]
- 26.Kapur VK, Resnick HE, Gottlieb DJ Sleep Heart Health Study Group. Sleep disordered breathing and hypertension: does self-reported sleepiness modify the association? Sleep. 2008;31:1127–32. [PMC free article] [PubMed] [Google Scholar]
- 27.Efron B, Tibshirani RJ. New York: Chapman and Hall; 1993. An introduction to the bootstrap, [Google Scholar]
- 28.Efron B, Tibshriani RJ. Bootstrap methods for standard errors, confidence intervals, and other measures of statistical accuracy. Statist Sci. 1986;1:54–75. [Google Scholar]
- 29.Department of Health and Human Services; Center for Medicare and Medicaid Services. Decision Memo for Continuous Positive Airway Pressure (CPAP) Therapy for Obstructive Sleep Apnea (OSA) CAG#0093R. March 13, 2008.
- 30.Gooneratne NS, Richards KC, Joffe M, Lam RW, Pack F, Staley B, et al. Sleep disordered breathing with excessive daytime sleepiness is a risk factor for mortality in older adults. Sleep. 2011;34:435–42. doi: 10.1093/sleep/34.4.435. [DOI] [PMC free article] [PubMed] [Google Scholar]
- 31.Kapur VK, Baldwin CM, Resnick HE, Gottlieb DJ, Nieto FJ. Sleepiness in patients with moderate to severe sleep-disordered breathing. Sleep. 2005;28:472–7. doi: 10.1093/sleep/28.4.472. [DOI] [PubMed] [Google Scholar]
- 32.Prentice AM, Jebb SA. Beyond body mass index. Obes Rev. 2001;2:141–7. doi: 10.1046/j.1467-789x.2001.00031.x. [DOI] [PubMed] [Google Scholar]
- 33.Schäfer H, Pauleit D, Sudhop T, Gouni-Berthold I, Ewig S, Berthold HK. Body fat distribution, serum leptin, and cardiovascular risk factors in men with obstructive sleep apnea. Chest. 2002;122:829–39. doi: 10.1378/chest.122.3.829. [DOI] [PubMed] [Google Scholar]
- 34.Schmidt Luggen A, Callen BL, Bernstein M. Weight loss and obesity in older adults. In: Bernstein M, Schmidt Luggen A, editors. Nutrition for the older adult. Sudbury, MA: Jones and Bartlett Publishers; 2010. pp. 247–61. [Google Scholar]
- 35.Krotkiewski M, Björntorp P, Sjöström L, Smith U. Impact of obesity on metabolism in men and women: importance of regional adipose tissue distribution. J Clin Invest. 1983;72:1150–62. doi: 10.1172/JCI111040. [DOI] [PMC free article] [PubMed] [Google Scholar]
- 36.Poehlman ET, Toth MJ, Gardner AW. Changes in energy balance and body composition at menopause: a controlled longitudinal study. Ann Intern Med. 1995;123:673–5. doi: 10.7326/0003-4819-123-9-199511010-00005. [DOI] [PubMed] [Google Scholar]
- 37.Endeshaw Y. Clinical characteristics of obstructive sleep apnea in community-dwelling older adults. J Am Geriatr Soc. 2006;54:1740–4. doi: 10.1111/j.1532-5415.2006.00924.x. [DOI] [PubMed] [Google Scholar]
- 38.Launois SH, Pépin JL, Lévy P. Sleep apnea in the elderly: a specific entity? Sleep Med Rev. 2007;11:87–97. doi: 10.1016/j.smrv.2006.08.005. [DOI] [PubMed] [Google Scholar]
- 39.Tarasiuk A, Greenberg-Dotan S, Simon-Tuval T, Oksenberg A, Reuveni H. The effect of obstructive sleep apnea on morbidity and health care utilization of middle-aged and older adults. J Am Geriatr Soc. 2008;56:247–54. doi: 10.1111/j.1532-5415.2007.01544.x. [DOI] [PubMed] [Google Scholar]
- 40.Fagan TJ. Letter: Nomogram for Bayes theorem. N Engl J Med. 1975;293:257. doi: 10.1056/NEJM197507312930513. [DOI] [PubMed] [Google Scholar]
- 41.Rees K, Wraith PK, Berthon-Jones M, Douglas NJ. Detection of apnoeas, hypopnoeas and arousals by the AutoSet in the sleep apnoea/hypopnoea syndrome. Eur Respir J. 1998;12:764–9. doi: 10.1183/09031936.98.12040764. [DOI] [PubMed] [Google Scholar]
- 42.Ohayon MM, Carskadon MA, Guilleminault C, Vitiello MV. Meta-analysis of quantitative sleep parameters from childhood to old age in healthy individuals: developing normative sleep values across the human lifespan. Sleep. 2004;27:1255–73. doi: 10.1093/sleep/27.7.1255. [DOI] [PubMed] [Google Scholar]
- 43.Gottlieb DJ, Whitney CW, Bonekat WH, et al. Relation of sleepiness to respiratory disturbance index: the Sleep Heart Health Study. Am J Respir Crit Care Med. 1999;159:502–7. doi: 10.1164/ajrccm.159.2.9804051. [DOI] [PubMed] [Google Scholar]
- 44.Weaver TE, Chasens ER. Continuous positive airway pressure treatment for sleep apnea in older adults. Sleep Med Rev. 2007;11:99–111. doi: 10.1016/j.smrv.2006.08.001. [DOI] [PMC free article] [PubMed] [Google Scholar]


