Abstract
Cell migration is a dynamic process, which is important for embryonic development, tissue repair, immune system function, and tumor invasion 1, 2. During directional migration, cells move rapidly in response to an extracellular chemotactic signal, or in response to intrinsic cues 3 provided by the basic motility machinery. Random migration occurs when a cell possesses low intrinsic directionality, allowing the cells to explore their local environment.
Cell migration is a complex process, in the initial response cell undergoes polarization and extends protrusions in the direction of migration 2. Traditional methods to measure migration such as the Boyden chamber migration assay is an easy method to measure chemotaxis in vitro, which allows measuring migration as an end point result. However, this approach neither allows measurement of individual migration parameters, nor does it allow to visualization of morphological changes that cell undergoes during migration.
Here, we present a method that allows us to monitor migrating cells in real time using video - time lapse microscopy. Since cell migration and invasion are hallmarks of cancer, this method will be applicable in studying cancer cell migration and invasion in vitro. Random migration of platelets has been considered as one of the parameters of platelet function 4, hence this method could also be helpful in studying platelet functions. This assay has the advantage of being rapid, reliable, reproducible, and does not require optimization of cell numbers. In order to maintain physiologically suitable conditions for cells, the microscope is equipped with CO2 supply and temperature thermostat. Cell movement is monitored by taking pictures using a camera fitted to the microscope at regular intervals. Cell migration can be calculated by measuring average speed and average displacement, which is calculated by Slidebook software.
Keywords: Cellular Biology, Issue 63, migration, real time, time lapse, video microscopy
Protocol
1. Preparation of Plate Coated with Collagen
Dilute collagen to a final concentration of 10 μg/ml in Opti-Mem media.
Coat 6 well plates with collagen, by adding 1.5 ml from step 1 to each well. Incubate overnight at 4 °C.
On the following day, wash the plate 2 times with 1x Phosphate Buffered Saline (PBS) and store them in PBS.
2. Cell Preparation and Seeding on a 6-well Plate
Note: Use warm media and PBS to ensure optimal conditions for cell movement
Grow MDA-MB-231 (an invasive breast cancer cell line) sparsely in Dulbecco's Modified Eagle Medium (DMEM) with 10% Fetal Bovine Serum (FBS). In this example, we use the MDA-MB-231; however, this method can be applied to any adherent cancerous and non cancerous cell lines.
Wash cells twice with warm 1x PBS and collect by trypsinization. Check cells under a microscope to make sure that the cells are properly detached by trypsin treatment.
Collect the cells by adding DMEM medium with 10% FBS, gently spin down the cells at 1000 g for 5 minutes. Resuspend the cell pellet gently in DMEM medium with 10% FBS.
Break the cell pellet by pipetting up and down gently. It is important to break down cell clusters into individual cells as much as possible.
Count the cells and dilute to a final concentration of 50,000 cells/ml in DMEM media with 10% FBS. Dispense 2 ml into each well.
Incubate the plate at 37 °C in a tissue culture incubator overnight, until starting the time-lapse microscopy.
To ensure ample space for migration, create a wound using a pipette tip, wash the plate with 1X PBS to remove debris (formed as a result of wound) and add DMEM with 10% FBS. Check under the microscope for floating cells. If large numbers of cells are floating, repeat the washing procedure. Now, the plate is ready to be setup on the microscope for image acquisition.
3. Microscope Setup and Automated Image Acquisition
There are several imaging software packages that control the microscope for automated image acquisition. Here, we use Slidebook 5.0 imaging software and automatic acquisitions are performed on a Olympus microscope (Olympus IX81), coupled to an EM-Hamamatsu C9100 camera, which is excellent for live-cell applications where speed of acquisition and minimal phototoxicity is paramount. The system includes a stage top environmental control chamber (Neue Live Cell) and an automated XY stage controller (Prior Proscan). Images are acquired with a 10X UPLANFL Ph1/0.30 objective, in bright field mode, using a defined time interval. The following protocol describes the image acquisition.
Turn on the microscope, camera, and live cell imaging apparatus. Position the plate over the microscopic stage. Cover the plate by the Neue Live Cell environmental control chamber, which is connected with a CO2 supply and temperature sensors. Set the thermostat at 37°C and CO2 at 5%.
- SlideBook software allows fully automated objective selection, wavelength selection and easy switching between fluorescent and bright field techniques. In order to set up different parameters of focus control, open SlideBook software >go to the menu bar > select focus control, by clicking >
 and select following parameters:
- In the "Objective box," define the objective by selection from drop down window. Note that we are using a phase objective and have manually selected the appropriate phase ring in the condenser. If using a system with an automated condenser, this will be automatically set through the software program. Alternatively, if neither objective turret nor condenser are automated these should each be selected manually.
- In the "Filter Set" box:
- Select settings to direct the light path to either the eyepiece or camera from the drop down box to see available filters ("Live" for eyepiece, "Widefield" for Camera in our system).
- Select the appropriate filter for brightfield illumination (in our set up, this option is labeled "DIC" which represents an open position for the brightfield light path).
- Select the light source by clicking on "Open Bright" to open the bright field shutter.
To view the sample under the eye piece, select the bright field filter (position "6" in our system) on the turret. After initially viewing the sample through the eyepiece to find appropriate fields and bring the sample into focus (steps 3.2.1 to 3.2.2.3). Move the filter turret to change the light path to the camera for image capture (position "1" in our system).
The automated stage allows the selection of different XY coordinates to capture multiple fields of interest during image acquisition. In SlideBook software, go to the focus control, select "XY", select different positions though the eye piece, then click "set point" lock in each location for image capture (Figure 1).
Fine tune the focus of the camera image that is viewed on the screen. This may be accomplished by either using the manual controls on the microscope or the computer controls, which can adjust the focus in much finer increments.
Using the controls in the "Focus Controls" window, adjust the z position of the stage. For best results, focus on flat cellular protrusions near the contact with the plate.
To aid with focusing use the slider to adjust the exposure times to be in an appropriate range for focusing. If multiple XY positions have been selected, adjust the focus for each individual position: Under focus control > XY> visit point. Note: this is done to make sure, that fields are correctly focused for an optimal snapshot.
- Use the software to set up capture window parameters. In SlideBook, open the capture by selecting
 from the menu bar. See Figure 2. We then check the following parameters.
- Check Capture type > as time lapse.
- Check Filter set: Wide field: DIC (for bright field image).
- "Time lapse capture" is the number of time points that will be captured (it can vary, depending on the cell type). Duration is the total length of time for the experiment. Units of time [in milliseconds (ms), seconds (s), minutes (m) or hours (h)] can be selected from the dropdown menu.
- "Interval" is the delay between the beginning of one timepoint and the beginning of the next timepoint. As you type in two of these values, the third field will be calculated automatically.
- Multiple XY capture: select "multipoint list" for more than 1 XY position.
- Name the file. In the given example, we have named it '231'.
To avoid unexpected shut down of computer due to multiple images, use the "spool option" to save the file. It is optional, however it is highly recommended. For this purpose, under capture control> select Advanced> Spool>Capture to memory and save to spool file after each time points. Browse the location to save the slide book file (Figure 3). The generated movie can be imported later from the designated location. Steps of microscope setup has been summarized in file 3.1.
4. Image Processing and Analysis of Migration: Calculation of Speed and Displacement
In this example, image processing is done by SlideBook5, 6 5.0 software. There are various other programs such as ImageJ7 for the image processing and analysis.
Import the SlideBook files generated from images of different fields at various time points. Go to menu bar> under Image> Import>Slide book spool>select the desired file (Figure 4a).
Here our goal is to track the movement of individual cells. It can be done using automated tracking or individual tracking. In the example, we have used manual tracking, since this facilitates ruling out artifacts easily, which is more difficult with automated tracking.
Open the SlideBook file, in which we have to perform tracking. Under menu: Select Mask > Particle Tracking Protocol > Manual Particle Tracking Protocol (Figure 4b). A window will appear with start and end time points (Figure 4c).
Begin to track movement of individual cells by clicking the center of each cell (nucleus). Track approximately 10 cells from each movie and at least three different movies should be selected from different locations so that approximately 30 cells will be analyzed from one experiment. Each experiment should be repeated three times. To allow an unbiased approach, select cells from different locations such as some cells from front, middle, corners etc. Click "OK", once tracking is done.
- Random migration can be analyzed by measuring changes in speed, velocity or displacement etc. To analyze the data, under menu > select mask > particle tracking>particle tracking protocol. Select tracking parameters as described, below: (Figure 5a):
- Track with - Select the parameter that you wish to track from the dropdown list. In this example, we have used, Center of Area (the coordinates of the center of the Object).
- Click "track and continue". Once tracking is complete, this will automatically advance to the next step.
- Choose desired statistics for each path, such as displacement and average speed (see Figure 5b):
- Average Speed - the total distance traveled divided by the time required to travel that distance.
- Total Displacement - the total distance traveled by the object.
- Click "Calculate and Continue" if you wish to progress to the next step, or simply select "Calculate" if you wish to view your statistics without going to the next step. A file will be generated which can be saved as text file and can later be exported to Excel.
- In order to track objects using automated tracking protocol, first a Mask has to be created.
- Select Mask > Segment Image> a segment window would appear >select until threshold is achieved such that separating one object from others> click apply> ok (see Figure 5c). Step 4.5.1 is the same.
- Remove Objects smaller than- Check this box to selectively remove objects smaller than a given size. Enter the size in the edit field and choose either microns or pixels as the unit. This is used to remove artifacts frequently caused by debris.
- Minimum movement - enter the minimum number of time points that must be tracked in order to determine a path.
- Maximum Movement- enter the maximum movement that you expect from any given object from one time point to the next.
- Steps to analyze the data are the same as manual tracking (see the steps 4.5.2 to 4.6.2).
5. Representative Results
An example of a random migration analysis as quantified in terms of speed and displacement (Figure 6). After exporting the file to excel, data is plotted using a box and whiskers plot. Statistical analysis comparing total displacement and average speed between test and control is performed using Mann- Whitney test. The test sample shows an increase in average speed as compared to the control. The test sample shows an increase in total displacement as compared to the control.
Movie of control and test: Control MDA- MB-231 and test MDA-MB-231 cells were seeded on collagen overnight. Time- lapse video microscopy was performed by Olympus microscope, coupled to an EM-Hamamatsu camera. Images are taken at an interval of 1 hour for a total of 18 hours during random migration. Please see Movie 1 and Movie 2 of random migration for control and test samples.
Microscope setup:
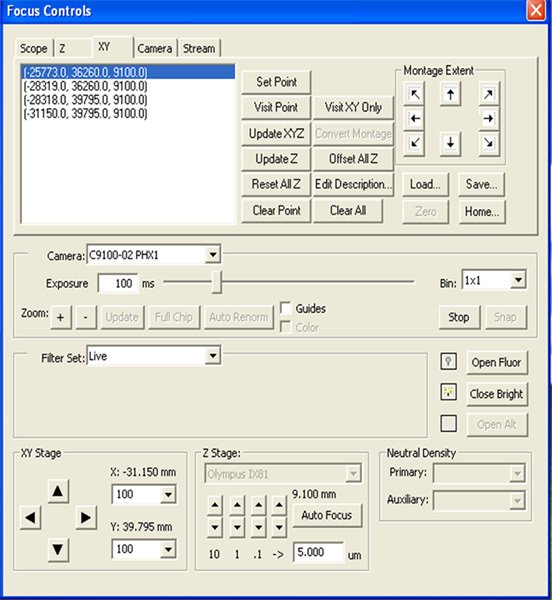 Figure 1. Setting up multiple points for image capture.
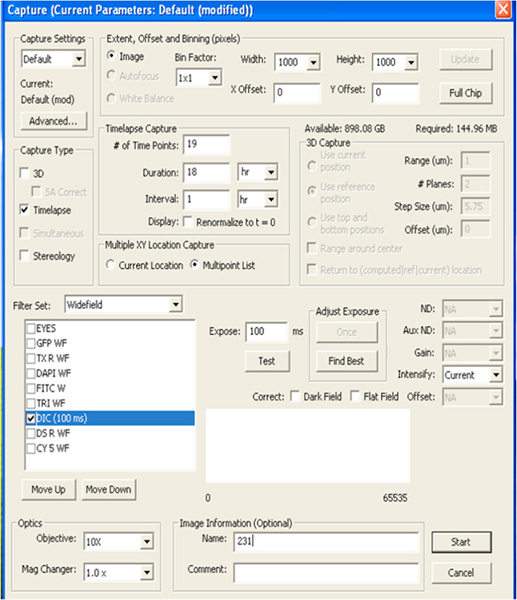 Figure 2. Steps depicting capture control. Click here to view larger figure.
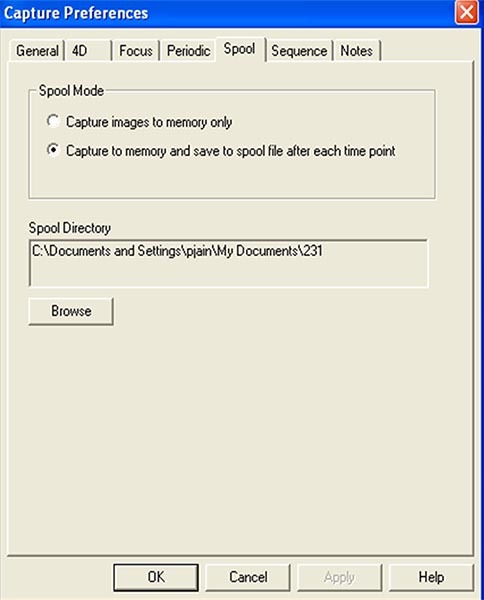 Figure 3. How to save multiple images.
Image processing and analysis of migration.
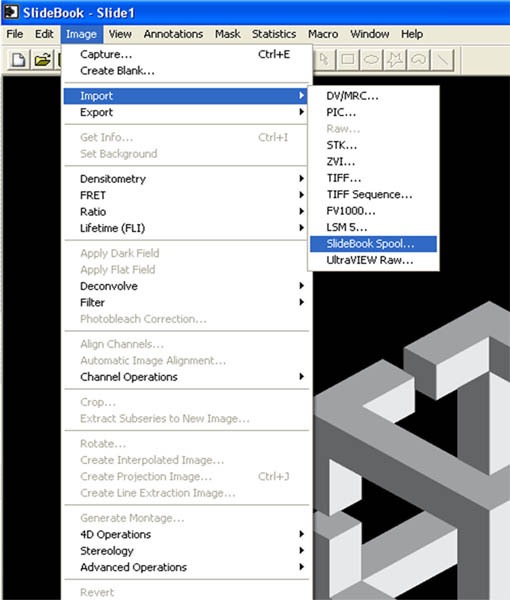 Figure 4a. Steps to import image for data analysis.
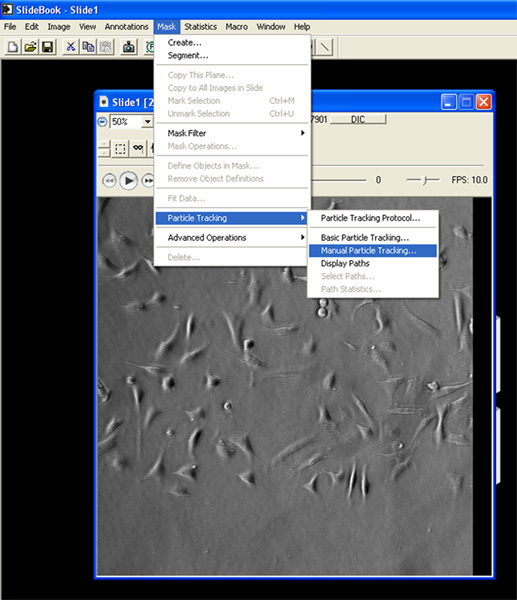 Figure 4b. Steps to analyze data using particle tracking protocol.
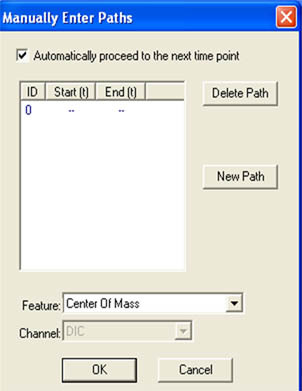 Figure 4c. Window depicting path length of tracked particles.
Steps of data analysis.
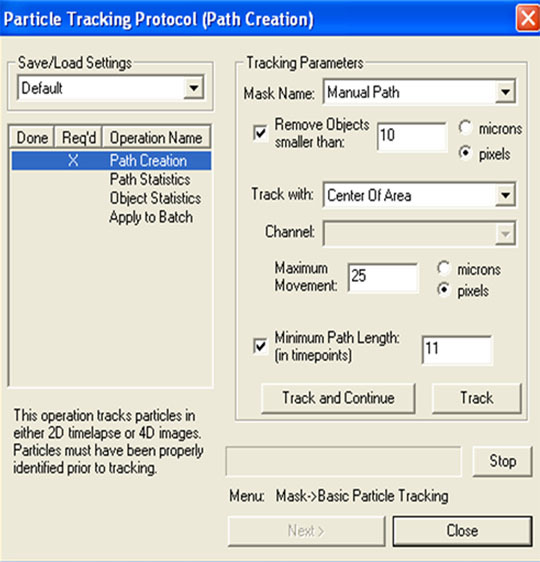 Figure 5a. Steps depicting parameters of particle tracking protocol.
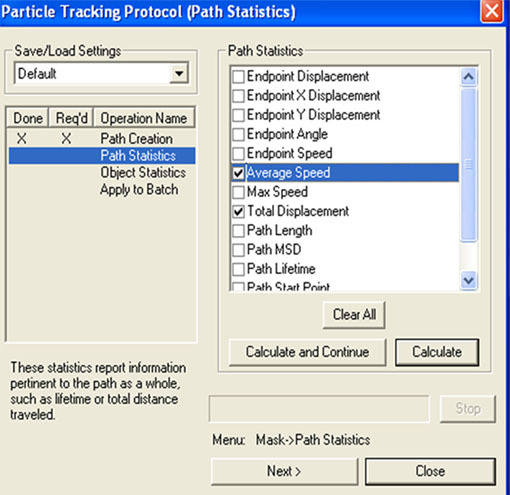 Figure 5b. Selection of path statistics to be analyzed.
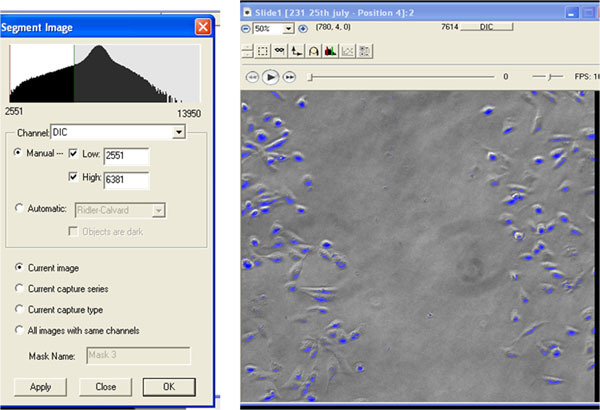 Figure 5c. Steps to create mask for automated tracking protocol.
 Figure 6. Average speed (Figure 6a) and displacement (Figure 6b) is plotted in a whiskers plot. The test sample shows an increase of speed and displacement as compare to control.
Movies
Movie 1. Migration of control cells. Click here to view the movie.
Movie 2. Migration of test cells. Click here to view the movie.
Control MDA- MB-231 and test MDA-MB-231 cells were seeded sparsely on collagen for overnight. Time- lapse video microscopy was performed by Olympus microscope, coupled to an EM-Hamamatsu camera. Images are taken at an interval of 1hour for 18 hours during random migration. Please see the movies of random migration for control and test.
Discussion
The real time random migration assay enables accurate, sensitive, analysis of cell migration parameters such as speed and displacement. This method is not restricted to end point measurement value, hence it is more quantitative. Since, cells are monitored in normal DMEM medium with serum; it reduces the deleterious effect of longer incubation in serum free media. It has been shown that the migration of cells depends on the formatting and breaking cell contacts with the substratum8, thus, this method could be used to study effect of different substrata on migration.
One of the critical steps involves proper control of temperature to 37°C and CO2 at 5% to ensure optimum migration. The assay permits flexibility to monitor migratory responses at desired time points; however, it may require optimizing the number of time points. For example, some cells having lower migration rates may have to be monitored for a longer time as compared to cells having higher migration rates.
The microenvironment of the tumor is one of the crucial factors in carcinogenesis. Cancer results from interaction of tumor cells with surrounding cells such as endothelial cells, stromal and inflammatory cells 9. This assay can be modified to study how migration of tumor cells are influenced by the microenvironment. One of the ways in which it can be achieved is by studying the migration of fluorescently labeled tumor cells grown in a mixed population of different cells such as stoma and endothelial cells. This method can also be used to study wound healing in real time.
Time-lapse microscopy could be modified to monitor cell invasion, cell division, apoptosis and lamellipodial dynamics and focal adhesion dynamics using higher resolution lenses.
One of the limitations of this method is that it does not allow monitoring of migration in vivo. Since there is no equipment available that can measure real time migration in the body, this type of assay is not suitable for in vivo migration. It also does not allow us to elucidate the biochemical machinery and signaling components that are important in cell migration. In order to address the signaling pathways, it is essential to perform biochemical experiments. See references for groups that have used this method for random migration 6, 10-14.
Disclosures
We have nothing to disclose.
Acknowledgments
The authors would like to thank Amanda Struckhoff for the initial help with the experiment. This work was supported by a grant from NIH 5RO1CA115706.
References
- Lauffenburger DA, Horwitz AF. Cell migration: a physically integrated molecular process. Cell. 1996;84:359–369. doi: 10.1016/s0092-8674(00)81280-5. [DOI] [PubMed] [Google Scholar]
- Ridley AJ. Cell migration: integrating signals from front to back. Science. 2003;302:1704–1709. doi: 10.1126/science.1092053. [DOI] [PubMed] [Google Scholar]
- Petrie RJ, Doyle AD, Yamada KM. Random versus directionally persistent cell migration. Nat. Rev. Mol. Cell Biol. 2009;10:538–549. doi: 10.1038/nrm2729. [DOI] [PMC free article] [PubMed] [Google Scholar]
- Valone FH, Austen KF, Goetzl EJ. Modulation of the random migration of human platelets. J. Clin. Invest. 1974;54:1100–1106. doi: 10.1172/JCI107854. [DOI] [PMC free article] [PubMed] [Google Scholar]
- Biehlmaier O, Hehl J, Csucs G. Acquisition speed comparison of microscope software programs. Microsc. Res. Tech. 2011;74:539–545. doi: 10.1002/jemt.20944. [DOI] [PubMed] [Google Scholar]
- Struckhoff AP. Dynamic regulation of ROCK in tumor cells controls CXCR4-driven adhesion events. J. Cell. Sci. 2010;123:401–412. doi: 10.1242/jcs.052167. [DOI] [PMC free article] [PubMed] [Google Scholar]
- Abramoff MD, Magelhaes PJ, Ram SJ. Image Processing with ImageJ. Biophoton. Internat. 2004;11:36–42. [Google Scholar]
- Greenberg JH, Seppa S, Seppa H, Tyl Hewitt A. Role of collagen and fibronectin in neural crest cell adhesion and migration. Dev. Biol. 1981;87:259–266. doi: 10.1016/0012-1606(81)90149-4. [DOI] [PubMed] [Google Scholar]
- Albini A, Sporn MB. The tumour microenvironment as a target for chemoprevention. Nat. Rev. Cancer. 2007;7:139–147. doi: 10.1038/nrc2067. [DOI] [PubMed] [Google Scholar]
- Yu YP, Luo JH. Myopodin-mediated suppression of prostate cancer cell migration involves interaction with zyxin. Cancer. Res. 2006;66:7414–7419. doi: 10.1158/0008-5472.CAN-06-0227. [DOI] [PubMed] [Google Scholar]
- Teng TS, Lin B, Manser E, Ng DC, Cao X. Stat3 promotes directional cell migration by regulating Rac1 activity via its activator betaPIX. J. Cell. Sci. 2009;122:4150–4159. doi: 10.1242/jcs.057109. [DOI] [PubMed] [Google Scholar]
- Wozniak MA, Kwong L, Chodniewicz D, Klemke RL, Keely PJ. R-Ras controls membrane protrusion and cell migration through the spatial regulation of Rac and Rho. Mol. Biol. Cell. 2005;16:84–96. doi: 10.1091/mbc.E04-04-0277. [DOI] [PMC free article] [PubMed] [Google Scholar]
- Orr AW, Elzie CA, Kucik DF, Murphy-Ullrich JE. Thrombospondin signaling through the calreticulin/LDL receptor-related protein co-complex stimulates random and directed cell migration. J. Cell Sci. 2003;116:2917–2927. doi: 10.1242/jcs.00600. [DOI] [PubMed] [Google Scholar]
- Smith A, Bracke M, Leitinger B, Porter JC, Hogg N. LFA-1-induced T cell migration on ICAM-1 involves regulation of MLCK-mediated attachment and ROCK-dependent detachment. J. Cell Sci. 2003;116:3123–3133. doi: 10.1242/jcs.00606. [DOI] [PubMed] [Google Scholar]


