Abstract
Estimates of islet area and numbers and endocrine cell composition in the adult human pancreas vary from several hundred thousand to several million and beta mass ranges from 500 to 1500 mg 1-3. With this known heterogeneity, a standard processing and staining procedure was developed so that pancreatic regions were clearly defined and islets characterized using rigorous histopathology and immunolocalization examinations.
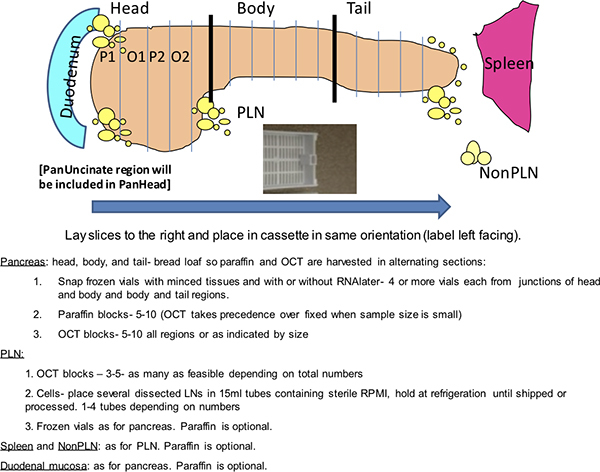
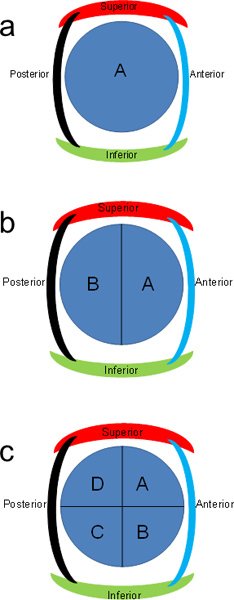
Standardized procedures for processing human pancreas recovered from organ donors are described in part 1 of this series. The pancreas is processed into 3 main regions (head, body, tail) followed by transverse sections. Transverse sections from the pancreas head are further divided, as indicated based on size, and numbered alphabetically to denote subsections. This standardization allows for a complete cross sectional analysis of the head region including the uncinate region which contains islets composed primarily of pancreatic polypeptide cells to the tail region.
The current report comprises part 2 of this series and describes the procedures used for serial sectioning and histopathological characterization of the pancreatic paraffin sections with an emphasis on islet endocrine cells, replication, and T-cell infiltrates. Pathology of pancreatic sections is intended to characterize both exocrine, ductular, and endocrine components. The exocrine compartment is evaluated for the presence of pancreatitis (active or chronic), atrophy, fibrosis, and fat, as well as the duct system, particularly in relationship to the presence of pancreatic intraductal neoplasia4. Islets are evaluated for morphology, size, and density, endocrine cells, inflammation, fibrosis, amyloid, and the presence of replicating or apoptotic cells using H&E and IHC stains.
The final component described in part 2 is the provision of the stained slides as digitized whole slide images. The digitized slides are organized by case and pancreas region in an online pathology database creating a virtual biobank. Access to this online collection is currently provided to over 200 clinicians and scientists involved in type 1 diabetes research. The online database provides a means for rapid and complete data sharing and for investigators to select blocks for paraffin or frozen serial sections.
Keywords: Medicine, Issue 63, Physiology, type 1 diabetes, histology, H&E, immunohistochemistry, insulin, beta-cells, glucagon, alpha-cells, pancreatic polypeptide, islet, pancreas, spleen, organ donor
Protocol
1. Microtomy for Unstained Sections
Set up water bath and microtome as for standard paraffin microtomy. Use positively charged slides and pre-label with case number, pancreas region (sample) and slide number. Place paraffin block in the microtome chuck with the cassette label on the left side.
Follow normal microtomy procedures, section into block until tissue is uniformly encountered. Produce a ribbon of serial sections (4 μm thick, 3-6 depending on number of initial required stains (See Case Submission Form, Appendix 1)). Separate sections in the ribbon, pick up each in order, and place on slides with order numbered with pencil. Denote if a section is unused by numbering sections in exact order. Maintain the same orientation on the slide as found in the cassette with the slide label oriented to the left. Dry overnight at room temperature then proceed with staining or distribution to investigators.
Reseal surface of paraffin block with thin layer of paraffin to preserve tissue and archive at room temperature or -20 °C.
For subsequent microtomy, maintain numbering for serial sections at each level as above. Obtain 1 additional slide and stain by H&E slide for each ~100 μM level within each block.
2. H&E Staining
Place the first serial sectioned slide from each block in a slide rack then in the first tray on the autostainer.
Select the standard H&E stain program and proceed as usual.
When finished staining, remove the slides from autostainer and place in hood for coverslipping.
Coverslip using standard technique. Dry thoroughly and label with a printed label (see section 12).
3. IHC Set-up
Select the Dako program for double stains and input numbers of slides. Prepare TBST and citrate buffers, antibodies, and other reagents according to specified volumes (Table 1). Load the reagent tray and slides. Rotation of clean and waste lines are programmed according to manufacturer's recommendations.
If performing these assays manually, prepare estimated volumes. Incubate slides in a humidified chamber to avoid slides drying out at any step. Follow the same procedure for each reagents as when used for the autostainer.
4. IHC Deparaffinization and Antigen Retrieval
Put slides in xylene for 5 minutes. Repeat once. Do not allow the slides to dry out at any subsequent point until indicated as this will result in excessive background and poor staining.
Transfer slides to 100% ethanol for 2 minutes. Repeat once.
Put slides in freshly prepared 3% H2O2 in methanol for 10 minutes.
Dip slides in 90% Ethanol and then place in 90% Ethanol for 3 minutes.
Transfer slides to 70% Ethanol for 1 minute.
Rinse slides in de-ionized water.
Preheat steamer and citrate buffer in steamer for 5 minutes.
Add slides to citrate buffer in the steamer and steam for 30 minutes.
Immediately transfer slides to water and hold until slides cool to room temperature (~20 minutes).
Transfer slides to the Dako autostainer racks according to stain sequence (Figure 1) and run the double staining program. The major steps of the autostainer program are listed so that manual runs can duplicate.
5. First Primary Antibodies (Ki-67, CD3, Pancreatic Polypeptide)
Block slides with Sniper solution for 15 minutes. Wash twice with TBST.
Incubate slides in primary antibody for 30 minutes. Wash twice with TBST.
Incubate with Mach2 goat anti-mouse (Ki-67) or anti-rabbit (CD3, pancreatic polypeptide) horse radish peroxidase (HRP) polymer for 30 minutes. Wash twice with TBST.
Apply 3,3 -diaminobenzidine tetrahydrochloride (DAB) to slides for 4 minutes. Wash twice with water.
Slides incubated with pancreatic polypeptide are held on the Dako when being assayed concurrently and TBST used for all subsequent steps while the remaining slides are incubated with the second set of primary antibodies. Alternatively, for manual assays, proceed to section 6.
6. Second Primary Antibodies (Insulin, Glucagon)
Incubate slides in DEEB for 20 minutes. Wash twice with TBST.
Block with 10% normal goat serum in 20% avidin blocker in TBST (insulin) or Sniper (glucagon) in TBST for 20 minutes. Wash twice with TBST.
Incubate with insulin or glucagon primary antibody for 15 minutes. Wash twice with TBST.
Insulin: Incubate slides in biotinylated goat anti-guinea pig at 1:300 dilution for 30 minutes. Wash twice with TBST. Incubate with standard vector ABC-AP reagent for 30 minutes. Wash twice with TBST.
Glucagon: Incubate slides in buffer during for 30 minutes followed by goat anti-mouse alkaline phosphatase (AP) polymer for 30 minutes. Wash twice with TBST.
While slides are incubated in conjugates, warm the LPR buffer to room temperature. Add 1 drop of liquid permanent red (LPR) per 3 mL buffer immediate before use and place in Dako reagent rack. Incubate slides in LPC for 4 minutes. Wash twice with water.
Incubate slides in hematoxylin for 1 minute. Rinse twice with water.
Incubate slides in TBS pH 7.6 for 1 minute. Rinse twice with water.
Unload slides from DAKO Autostainer.
Immediately dehydrate slides stained for pancreatic polypeptide. For all double stained slides, dry for at least 1 hour then dehydrate.
7. Dehydration
Place slides in 80% ethanol for 1 minute.
Dip slides in 95% ethanol.
Hold slides in 95% ethanol for 30 seconds.
Transfer slides to 100% ethanol and hold 1 minute. Repeat.
Dip slides in xylene.
Hold slides in xylene for 1 minute. Repeat.
Immediately mount coverslips on slides using cytoseal.
8. Slide Labeling
Enter the case identification information including organ and block number, stain, and date and print. Serial section number is optional for the first slide stains of each block. Subsequent levels are denoted by numbering.
Place labels on slides.
9. Slide Scanning
Place stained slides in scanner tray and scan according to instrumentation.
Organize slides by donor and tissue type (pancreas head, body, tail, spleen).
Archive stained slides at room temperature and any remaining unstained slides at -20 °C until used.
10. Representative Results
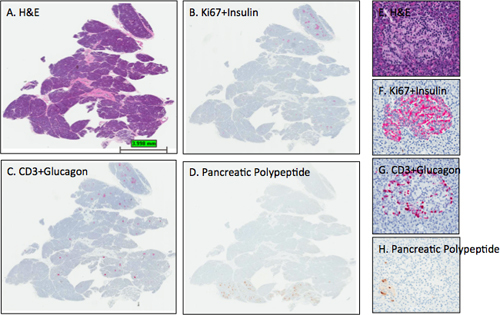
These staining procedures were developed for the JDRF Network for Pancreatic Organ donors with Diabetes (nPOD) to provide baseline characterization of paraffin and fresh frozen blocks. Each donor has a baseline characterization performed comprised of staining 2 blocks from each pancreas region (head, body, and tail) and the spleen (Figure 1, see also case submission form, Appendix 1). The H&E staining is conducted using an autostainer programmed as for a clinical facility with clinical-grade solutions used throughout. As additional donor blocks are sectioned, each has a slide taken for H&E to show tissue morphology. When blocks are sectioned again, as for distribution to investigators, deeper levels will also have slides taken for representative H&E slides to document the entire block's tissue morphology as well as numbering serial sections at each level. Stained slides are labeled with case identification, pancreas region, block number, stain and date (Figure 2) and scanned into the online pathology information management system. Representative images from a control donor are shown in Figure 3 at both low and high magnifications to show expected results following this procedure. The slide stained with pancreatic polypeptide (D,H) was assayed on a different day with the assay performed manually and shows reduced staining intensity of the hematoxylin counterstain. Differences in staining intensity of primary antibodies or counterstain between assays is to be avoided particularly if using image analysis otherwise slides with require individual color correction to achieve the same cell areas or counts.
Each laboratory should expect to optimize antibody concentrations as lot-to-lot variation and other reagents and conditions can impact staining intensity and specificity. With acquisition of new reagents, staining procedures are validated with known positive and negative control samples to achieve the same degree of stain intensity as with former reagents. Additional antibodies optimized in the nPOD pathology core are provided in Table 2 as a reference source and have been used for multilabeling immunofluorescence assays for confocal microscopy.
 Figure 1. Dako staining grid. This schematic depicts a routine analysis from a nPOD donor pancreas performed on a Dako autostainer. The nPOD donors are coded with a 4-digit identification number. Two slide trays are shown with slides organized by stain. Alternate slide configurations are expected depending on numbers of donor slides. Positive controls include inclusion of a known positive donor for the two double stains and donor spleen for Ki-67 and CD3. Negative controls are twofold and include two slides from one donor pancreas block incubated with immunoglobulin (Ig) from the host species of the primary antibodies and two slides from donor spleen for insulin and glucagon.
 Figure 2. Representative double stained slide. A typical finished slide is shown with slide labeling parameters and tissue placement before digital scanning is performed.
 Figure 3. Representative H&E and IHC stains in pancreatic sections. Sections from the pancreas of an adult female organ donor (6096-04 PanHead) were stained and digital scans performed as described in the protocol. Images were obtained using the ImageScope viewing program of the entire section (A-D) and from one islet (E-H). The expected islet stain intensities for insulin, glucagon, and pancreatic polypeptide are observed for sections B-D as section D delineates that this pancreas head block contains a small portion of the uncinate region or ventral pancreatic lobe as all islets contain mainly pancreatic polypeptide-positive cells. Note that the hematoxylin counterstain in panel D is too light while the hematoxylin counterstain intensities in B and C are optimal. Panels E-H show an islet from the dorsal lobe with the expected distribution of β-cells and α-cells. A few pancreatic polypeptide cells are found in the lower left portion of the islet (H). A, E- H&E; B, F- Ki67+Insulin; C, G- CD3+Glucagon; D, H- Pancreatic polypeptide. A-D, 0.2x, E-H- 12.8x.
Discussion
Standardization of IHC procedures is critical for image analysis, particularly when using computer-based algorithms across large numbers of slides over time. The IHC staining procedure described in this report will allow batch analysis of a given donor's samples using an autostainer within an 8-hour work day and are modified from a previous report 5. Digitized whole slide images of each stained slide made available to nPOD-affiliated investigators through the web-based online pathology system. Investigators can review donor demographics, laboratory data, and other pertinent clinical history along with the slides and are able to choose blocks most suitable for their studies (see http://www.jdrfnpod.org/online-pathology.php for more information). Such an online pathology system serves as a "virtual biobank". A further improvement to this system will be implemented whereby slide labels incorporate a bar code to track serial sections and levels for each block with an eventual goal of 3-D reconstruction of the pancreas.
The two double staining procedures were primarily chosen to determine islet β-cell composition (insulin) in concert with cellular replication (Ki-67) given the importance of understanding mechanisms for adult β-cell regeneration in type 1 diabetes 5,6. As the second double IHC assay is performed on serial sections to the first, each islet is characterized for both β-cell (insulin) and α-cell composition (glucagon). In addition, the presence of T-lymphocytes (CD3) is determined in conjunction with α-cell staining for two main reasons. The basis of T-cell mediated autoimmunity in progression of type 1 diabetes has been clearly appreciated yet the nature of the initiating agents (viral, bacterial, inflammatory cells) or the composition of the chronic infiltrate with resultant β-cell dysfunction and demise are yet to be defined (reviewed in 7,8). Second, donors with type 1 diabetes have a well characterized deficiency of β-cells so that combination of the CD3 and glucagon stains ensures identification of islets even when β-cell loss is severe9.
Disclosures
No conflicts of interest declared.
Acknowledgments
The authors thank the donors' families and the Organ Procurement Organizations involved in this research and Emily Montgomery, Robert Pietras, Ann Fu, Mitali Agarwal, and Roshan Agarwal for their expert assistance. This work was funded by the Juvenile Diabetes Research Foundation (M.C-T.) in support of the Network for Pancreatic Organ Donors with Diabetes.
References
- In't Veld P, Marichal M. Microscopic anatomy of the human islet of Langerhans. Adv. Exp. Med. Biol. 2010;654:1–19. doi: 10.1007/978-90-481-3271-3_1. [DOI] [PubMed] [Google Scholar]
- Matveyenko AV, Butler PC. Relationship between beta-cell mass and diabetes onset. Diabetes Obes. Metab. 2008;10(Suppl. 4):23–31. doi: 10.1111/j.1463-1326.2008.00939.x. [DOI] [PMC free article] [PubMed] [Google Scholar]
- Saisho Y. Pancreas volumes in humans from birth to age one hundred taking into account sex, obesity, and presence of type-2 diabetes. Clin. Anat. 2007;20:933–942. doi: 10.1002/ca.20543. [DOI] [PMC free article] [PubMed] [Google Scholar]
- Hruban RH. Pancreatic intraepithelial neoplasia: a new nomenclature and classification system for pancreatic duct lesions. Am. J. Surg. Pathol. 2001;25:579–586. doi: 10.1097/00000478-200105000-00003. [DOI] [PubMed] [Google Scholar]
- Campbell-Thompson M. Pancreatic adenocarcinoma patients with localised chronic severe pancreatitis show an increased number of single beta cells, without alterations in fractional insulin area. Diabetologia. 2009;52:262–270. doi: 10.1007/s00125-008-1200-z. [DOI] [PMC free article] [PubMed] [Google Scholar]
- Meier J. Beta-cell replication is the primary mechanism subserving the postnatal expansion of beta-cell mass in humans. Diabetes. 2008;57:1584–1594. doi: 10.2337/db07-1369. [DOI] [PMC free article] [PubMed] [Google Scholar]
- Rowe PA, Campbell-Thompson ML, Schatz DA, Atkinson MA. The pancreas in human type 1 diabetes. Semin. Immunopathol. 2011;33:29–43. doi: 10.1007/s00281-010-0208-x. [DOI] [PMC free article] [PubMed] [Google Scholar]
- Veld In't, P Insulitis in human type 1 diabetes: The quest for an elusive lesion. Islets. 2011;3:131–138. doi: 10.4161/isl.3.4.15728. [DOI] [PMC free article] [PubMed] [Google Scholar]
- van Belle TL, Coppieters KT, von Herrath MG. Type 1 diabetes: etiology, immunology, and therapeutic strategies. Physiol Rev. 2011;91:79–118. doi: 10.1152/physrev.00003.2010. [DOI] [PubMed] [Google Scholar]


