Abstract
Background
While minimizing hyperglycemia in critically injured patients improves outcomes, it is debatable whether postinjury glucose control should aim for conventional (CGC≤180mg/dL) or tight levels (TGC=81–108mg/dL). Thus, we queried our 17-year prospective database of patients at risk for postinjury multiple organ failure to examine the association between glucose levels and adverse outcomes.
Methods
Acutely injured patients admitted to a Level I trauma center intensive care unit from 1992 to 2008 with age>15, injury severity score (ISS)>15, and survival>48hrs were eligible for the study. Multiple logistic regression was used to determine the independent association of glucose control with adverse outcomes (death, ventilator free days, ICU free days, and major infections), adjusted for ISS, age, and red blood cell transfusion in the first 12 hours (RBC/12hrs).
Results
Overall, 2231 patients were eligible, of whom 153 (6.9%) died. Mean age was 37.8±0.4 years and median ISS was 27 (IQR:21–35). The majority (77%) of these patients maintained mean glucose within CGC and only 10% achieved mean glucose levels within TGC. Non-survivors required higher doses of insulin to control glucose levels, showing higher mean insulin:glucose ratios (t-test, p=0.025). After adjusting for confounders, mean glucose remained significantly associated with the studied adverse outcomes. Age significantly modified all these associations, with older patients, seeming to benefit more from TGC than their younger counterparts.
Conclusions
Age is an effect modifier of the association between glucose levels and adverse outcomes. Future studies including larger samples of elderly trauma patients are needed to determine the ideal levels for glucose control in this growing population.
Keywords: hyperglycemia, critical care, geriatric, elderly, glucose control
Introduction
Hyperglycemia is common in critically ill patients and has been shown to be associated with worse outcomes.1 In the first major randomized controlled trial (RCT) studying glycemic control of critically ill patients, Van den Berghe et al. concluded that patients treated with tight glucose control levels (TGC=80–110 mg/dL) had significantly lower rates of infections, renal impairment, and mortality than patients treated with conventional glucose control levels (CGC≤180mg/dL).2,6 In the burn population, TGC has been shown to reduce mortality and the number of septic and infectious complications.3,4 Specifically in the trauma population, hyperglycemia has been shown to correlate with increased infection, multiple organ failure, and mortality.5–8 Subsequent prospective non-blinded RCTs in mixed medical surgical intensive care units (ICUs) found no significant difference in ICU mortality and rate of major infections, and TGC subjects had significantly more hypoglycemic episodes than CGC patients.9,10 In addition, evaluations of neurologic and neurosurgical patients showed similar or worse outcomes with TGC than CGC.11,12 In an attempt to settle the debate, a large international RCT (NICE SUGAR trial), found that TGC actually increased mortality compared to CGC.13
Inclusion of mixed populations of medical, surgical and postinjury patients led to these conflicting results. Indeed, after the NICE-SUGAR study, Gunst and Van den Berghe from Leuven reported that certain subgroups, such as cardiac surgery and pediatric patients seemed to benefit from TGC while other groups such as non-surgical patients had diminished benefit and greater risk of hypoglycemia.14 Recent retrospective large studies limited to trauma suggested that mortality, length of stay, ventilator days, and infections were significantly lower after the implementation of intensive glucose protocols.15–16 Collectively, the existing evidence suggest a benefit from more intense glucose control among trauma patients.
The purpose of this study is to evaluate the association between TGC and CGC with adverse outcomes within specific subpopulations of critically injured patients using our 17-year prospectively collected database of patients at risk for multiple organ failure.
Methods
Study population and data collection
Acutely injured patients admitted to the Rocky Mountain Regional Trauma Center surgical ICU at Denver Health Medical Center (DHMC) were prospectively studied from 1992 to 2008. DHMC is a state designated Level I trauma center verified by the American College of Surgeons Committee on Trauma. Inclusion criteria were age older than 15 years, Injury Severity Score (ISS) greater than 15, survival greater than 48 hours from injury, and admission to the surgical ICU within 24 hours of injury. Patients with isolated head injuries (head injuries with extra-cranial Abbreviated Injury Scale less than 2), burn or hanging injuries were excluded. Forty-six patients (2%) with documented diabetes were also excluded from the study.
Patient characteristics were recorded at the time of hospital admission, according to previously published definitions.17 Daily physiologic and laboratory data were collected through ICU day 28. Subsequent clinical events were recorded on all patients until death or hospital discharge. In our institution, intensive insulin protocols started in 2002 and were fully implemented in 2004.18 Daily insulin-dose and body mass index (BMI) data were available only after 2004, thus analyses of insulin levels and obesity (defined as BMI ≥ 30 kilogram/meter2) were limited to the more recent 2005 to 2008 study period. At our institution, insulin infusion is commenced in critically ill patients with persistent blood glucose >110 mg/dL. Initiation and continuation insulin rates and bolus doses are based on serum glucose level, seen in Table 1 and 2. Blood glucose levels are monitored every 2 hours and if needed, every 1 hour. If enteral nutrition, parenteral nutrition, or intravenous fluids with dextrose are stopped, the insulin infusion rate is decreased by 50% and blood glucose is closely monitored every hour. Data collection and storage are in compliance with the Health Insurance Portability and Accountability Act regulations and have been approved by our Institutional Review Board.
Table 1.
Initiation of intravenous insulin bolus doses and infusion rates
| Blood glucose (mg/dL) | Bolus IV push (units) | Infusion rate (units/hour) |
|---|---|---|
| 111–150 | 2 | 1 |
| 151–200 | 2 | 2 |
| 201–250 | 4 | 2 |
| 251–300 | 6 | 4 |
| 301–350 | 8 | 4 |
| >350 | 10 | 4 |
Table 2.
Continuation of intravenous insulin bolus doses and infusion rates
| Blood glucose (mg/dL) | Bolus IV Push (units) | Infusion rate (units/hour) |
|---|---|---|
| <60 | 0 | Stop infusion; give 1 ampule of 50% dextrose; recheck glucose in 30 minutes. If glucose>80, resume insulin infusion at 50% of previous rate. |
| 60–79 | 0 | Stop infusion; recheck glucose in 30 minutes. If glucose>80, resume insulin infusion at 50% of previous rate. |
| 80–110 | 0 | No change; if blood glucose continues to decrease over 4 hours, decrease rate by 20% |
| 111–150 | 0 | Increase rate by 20% |
| 151–200 | 2 | Increase rate by 20% |
| 201–250 | 4 | Increase rate by 20% |
| 251–300 | 6 | Increase rate by 20% |
| 301–350 | 8 | Increase rate by 20% |
| >350 | 10 | Increase rate by 20% |
Adverse outcomes included mortality, multiple organ failure, ICU free days (IFD), ventilator free days (VFD), and major infections. Multiple organ failure (MOF) was defined by a Denver MOF score17 greater than 3.19 ICU free days and ventilator free days were determined according to the method proposed by Schoenfeld and Bernard.20 Infections were defined by previously published criteria and included: lung infection (pneumonia, empyema, lung abscess), meningitis, sepsis or septic shock, intra-abdominal / pelvic abscess requiring drainage, and major wound infections requiring debridement.21
Statistical Analysis
Statistical analyses were performed using SAS for Windows version 9.3 (SAS Institute, Cary, NC). Categorical variables were compared using the Chi-square test with Yates correction for continuity or the Fisher’s exact test for when expected cell values were < 5. Analysis of variance or t-tests were used for continuous variables with normal distributions (with appropriate modification when the assumption of equal variances did not hold) while continuous variables without a normal distribution were analyzed using the Wilcoxon Two-Sample Test. P<0.05 was considered significant. Continuous data were expressed as mean ± standard error of the mean (SEM) or as median and interquartile range (IQR) and categorical data as percentages. We used multiple logistic regression to determine the independent effect of mean glucose levels on adverse outcomes after adjusting for potential confounding variables [age, ISS, red blood cells units transfused in the first 12 hours postinjury (RBC/12 hrs)]. In addition to the required daily dose of insulin, we evaluated a composite index calculated as mean insulin units/glucose levels x1000. Regression models’ goodness of fit was assessed using the C-statistic, reflecting the area under the receiver–operating characteristic curves.
Results
Total enrollment from 1992 to 2008 included 2231 eligible patients, whose characteristics are shown in Table 3. Average age was 37.8 ± 0.4, 82% were male, and the majority (96%) were victims of blunt injury. Mortality was 6.9% and the MOF rate was 18.3%. Our patient population had 15% comorbidity prevalence: substance abuse was the most common, followed by chronic cardiac and pulmonary diseases. Median ISS was 27 (IQR 21–35) and 41% received RBC/12 hrs (median: 6 units, IQR: 2–11 units). Only 42 patients (1.9%) developed severe hypoglycemia (<40 mg/dL), and none of these patients died. Obesity prevalence (data from 2005–2008 only) was 22%.
Table 3.
Characteristics of the study population
| Variables | |
|---|---|
| N | 2231 |
| Demographics | |
| Age, Mean±SEM* | 37.8±0.4 |
| Male, % | 1822 (81.7%) |
| Injury Severity | |
| ISS†, Median (IQR‡) | 27 (21–35) |
| Blunt, n (%) | 2141 (96%) |
| Required RBC§/12hrs, n (%) | 915 (41%) |
| Median Units RBC/12hrs (IQR) | 6 (2–11) |
| Comorbidities | |
| Total patients | 315 (15%) |
| Total conditions∥ | 402 |
| Substance abuse | 147(36.6%) |
| Cardiac | 65 (16.2%) |
| Pulmonary | 51 (12.7%) |
| Neurologic | 22 (5.5%) |
| Immunological | 13 (3.2%) |
| Neoplasia | 9 (2.2%) |
| Liver | 8 (2.0%) |
| Renal | 4 (1.0%) |
| Other | 83 (20.6%) |
| Outcomes | |
| Mortality, n (%) | 153 (6.9%) |
| MOF¶,n (%) | 409 (18.3%) |
| IFD#, Median (IQR‡) | 18 (5–24) |
| VFD**, Median (IQR‡) | 24 (12–27) |
SEM=standard error of the mean,
ISS=Injury Severity Score,
IQR=interquartile range,
RBC/12hrs=red blood cell units transfused in the first 12 hours postinjury,
Patients may have more than one comorbidity,
MOF=multiple organ failure,
IFD=ICU free days,
VFD=ventilator free days
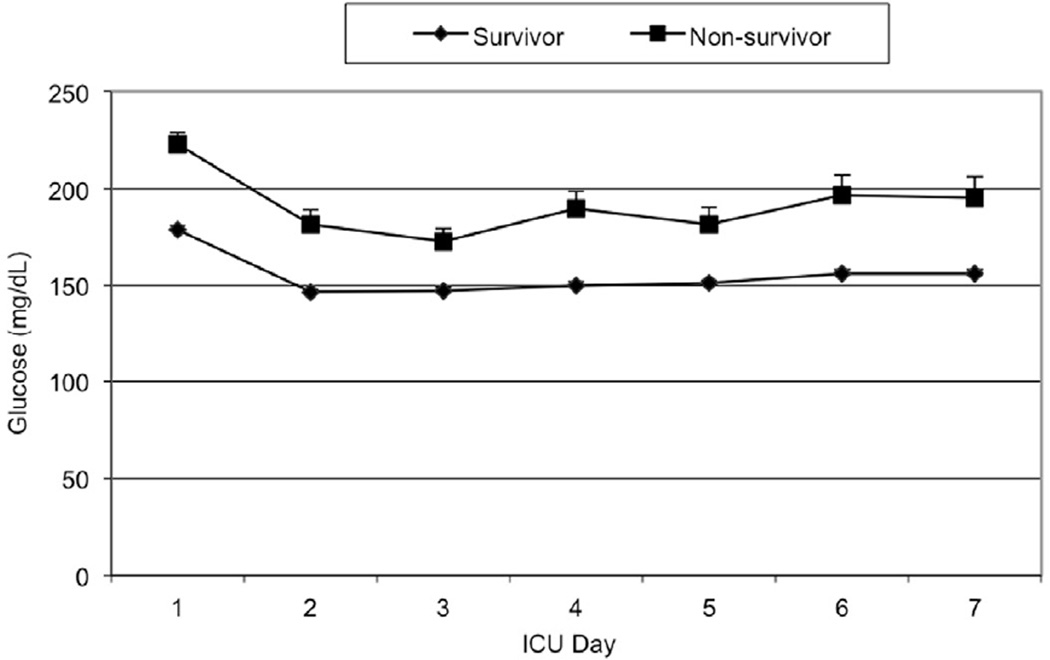
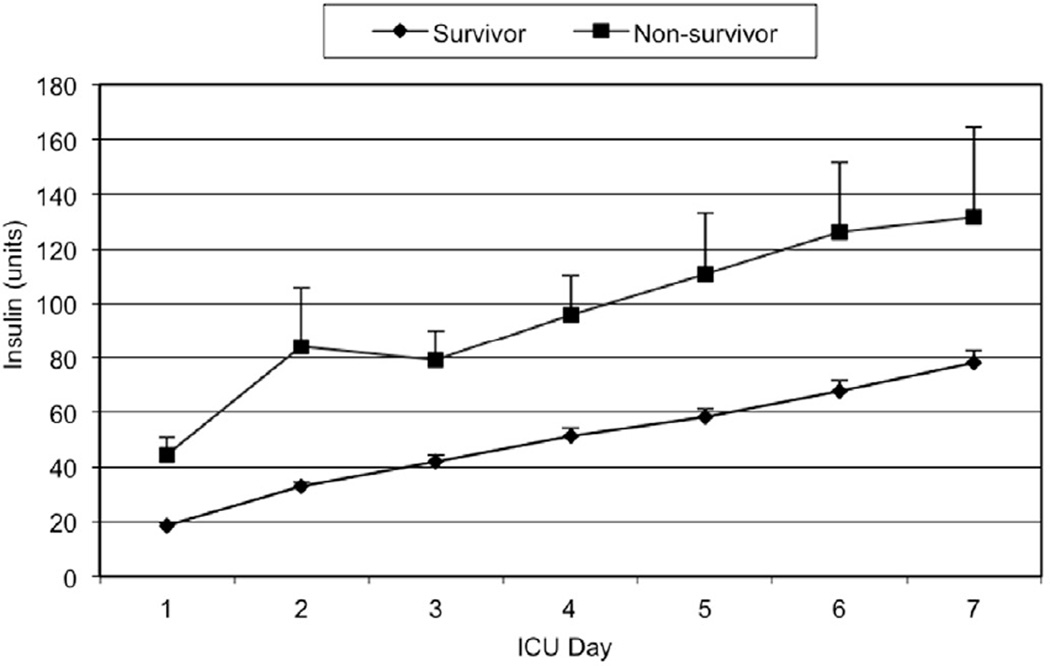
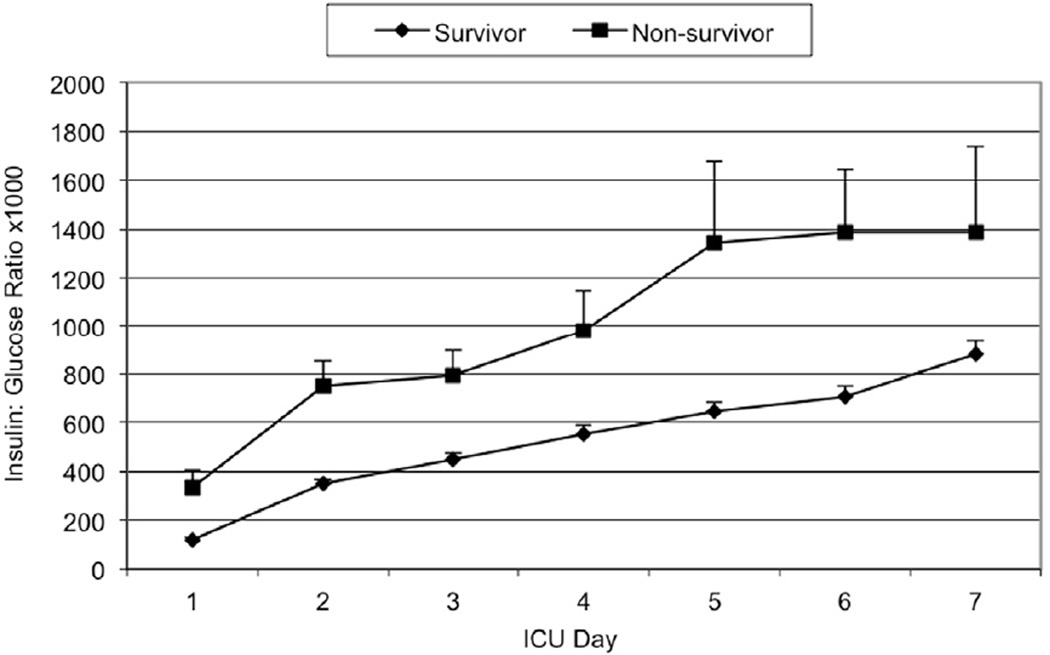
Mean daily glucose levels steadily declined throughout the study period until 2004–2005, when they dropped dramatically with the adoption of the TGC policy. As illustrated in Figure 1, the mean daily glucose levels for non-survivors were consistently higher than those of survivors in the first post-injury week (147 to 179 mg/dL vs. 173 to 222 mg/dL, p<0.0001). Figures 2 and 3 illustrate the smaller insulin requirements of survivors compared to non-survivors (30.4 ± 1.4 units vs. 82.4 ± 9.8 units, p=0.0073). Moreover, non-survivors required a higher ratio of mean insulin units to glucose level (index insulin: glucose=832 ± 99.9 vs. 337 ± 15.9, p=0.025). Survivors were able to achieve both CGC and TGC for a significantly larger proportion of their ICU stay than non-survivors (CGC: 47.6% vs. 28.8%, Wilcoxon p=0.003; TGC: 11.7% vs. 5.6%, Wilcoxon p<0.0001, respectively).
Figure 1.
Mean daily glucose level
Figure 2.
Mean daily insulin units
Figure 3.
Mean daily insulin: glucose ratio × 1000
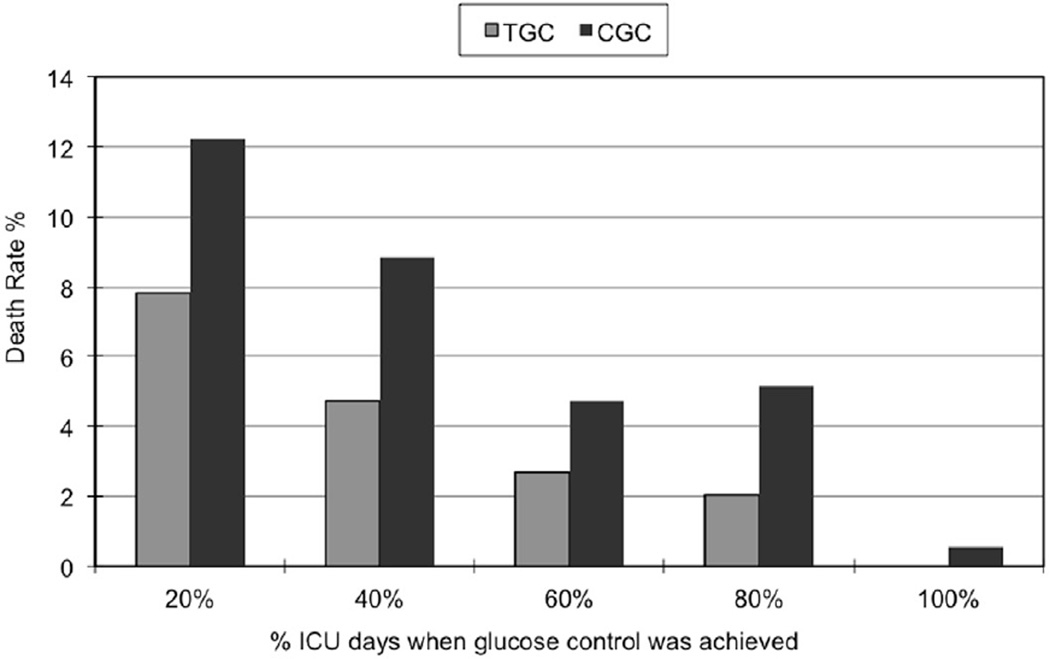
Overall, majority (77%) of the patients were able to achieve mean CGC levels but only 20% were able to achieve mean TGC levels. After implementation of the intensive insulin protocol, more patients were able to achieve TGC and CGC levels for at least half of their ICU stay (22% and 66%, respectively), compared to the previous period (0.08% for TGC levels and 28% for CGC), yet achieving TGC remained a challenge in this population. Figure 4 depicts death rates stratified by proportion of ICU stay during when TGC and CGC control were achieved. Patients who achieved glucose control (at either TGC or CGC levels) for most of their ICU stay had lower mortalities.
Figure 4.
Death rate and proportion of ICU stay during when tight glucose control (TGC) or conventional glucose control (CGC) levels were achieved
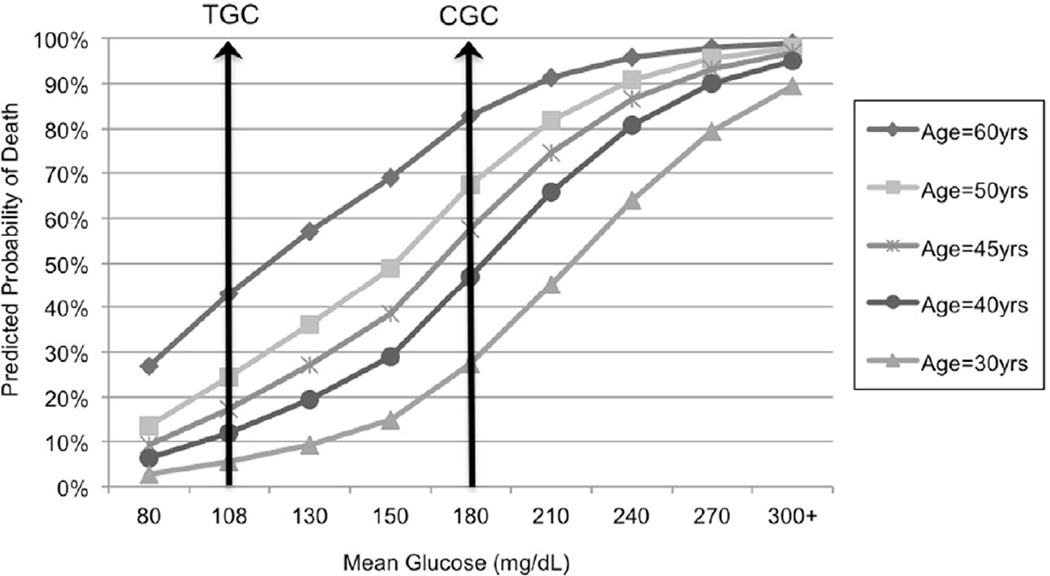
Multiple regression analysis for probability of death by mean glucose levels, adjusting for age, ISS, and RBC/12hrs revealed a significant interaction between age and mean glucose levels (p=0.0074). The model had a C-statistic of 0.82, indicating a good fit. Figure 5 illustrates the interaction between mean glucose level and age. For example, patients aged 60 years who maintained a mean glucose level of 108 mg/dL had a 43% predicted probability of dying, compared to an 83% predicted death rate for those with a mean glucose level of 180mg/dL, resulting in an absolute risk difference of 40%. On the other hand, a 30-year old patient with a mean glucose level of 108 mg/dL had a predicted mortality of 5.5% vs. 27% associated with levels of 180mg/dL, resulting in a 21.5% absolute risk difference. Obesity was added to the 2005–2008 model and found not to be associated with death (p=0.6446) in this population.
Figure 5.
Predicted probability of death in trauma patients by adjusted for age, Injury Severity Score (ISS), and red blood cell units transfused in the first 12 hours postinjury (RBC/12hrs), and mean glucose level (TGC=tight glucose control level; CGC=conventional glucose control level)
After adjusting for ISS and RBC/12hrs, age significantly modified the effect of mean glucose levels on VFD (interaction age×mean glucose, p=0.036), but just marginally for IFD (interaction age×mean glucose, p=0.08). C-statistic was 0.79 for both models.
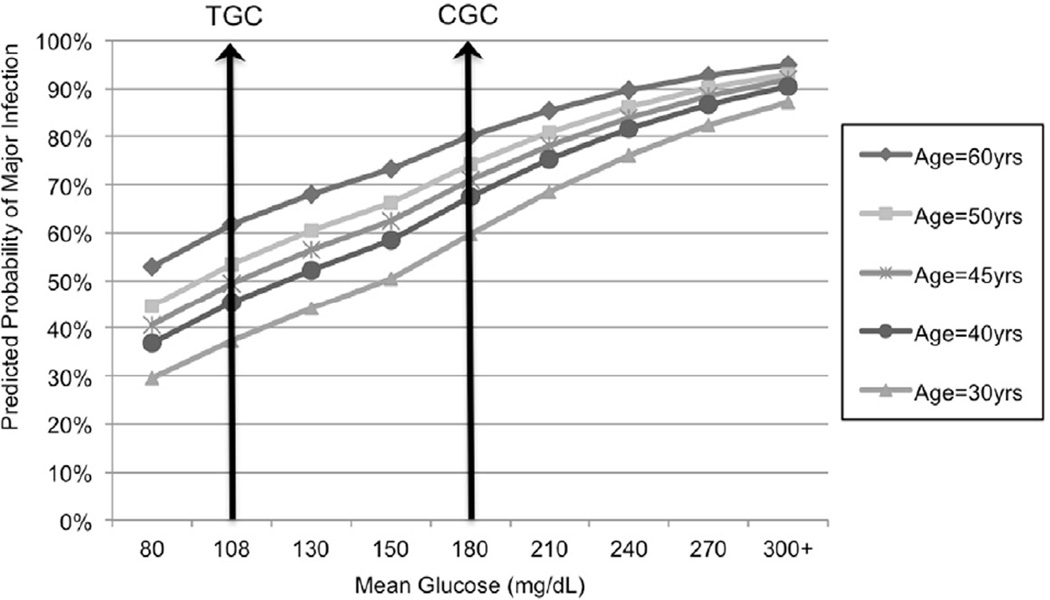
Of 2231 total patients, 42% has at least one major infection with lung infections being the most frequent type of infection. While major infection was not associated with death after adjustment for age, ISS, RBC/12 hrs, and hyperglycemia (p=0.2796), these patients had significantly higher mean glucose levels than patients without major infections (164 mg/dL versus 152 mg/dL, p<0.0001). Once again, mean glucose and age interacted (p=0.0074), indicating that age modified the association of mean glucose and major infection (Figure 6). A mean glucose level of 108 mg/dL was associated with 39.4% absolute risk reduction for patients aged 60 years and for 22.5% for those aged 30 years.
Figure 6.
Predicted probability of a major infection in trauma patients adjusted for age, Injury Severity Score (ISS), red blood cell units transfused in the first 12 hours postinjury (RBC/12hrs), and mean glucose level (TGC=tight glucose control level; CGC=conventional glucose control level)
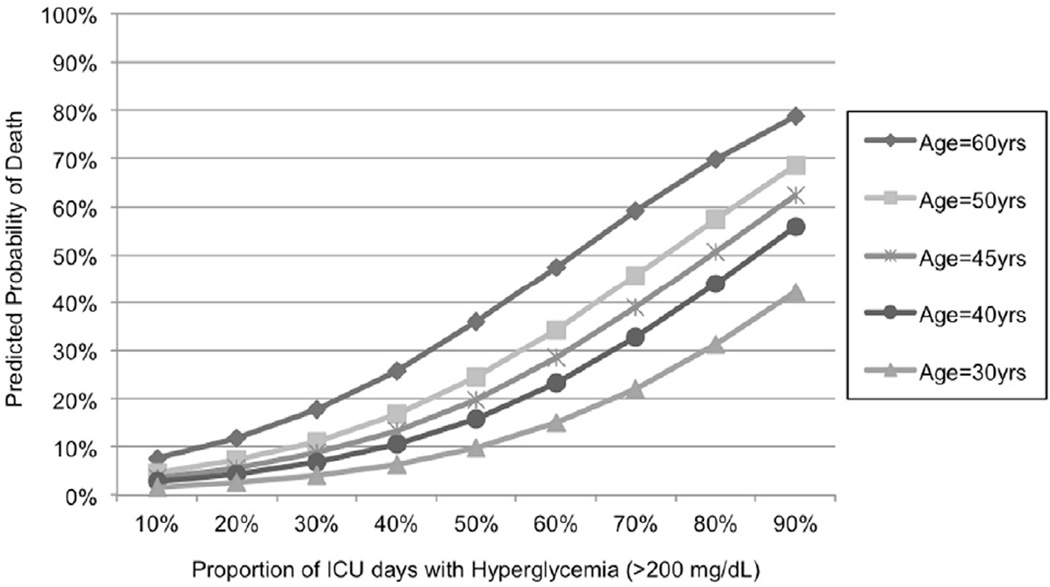
The proportion of ICU days with hyperglycemia (glucose levels > 200 mg/dL) was strongly associated with death, and this association was also modified by age, with older patients being more at risk compared to their younger counterparts (Figure 7; interaction between age and hyperglycemia, p=0.004). During the time period of 2005– 2008, after the implementation of the TGC protocol, hyperglycemia was avoided more effectively than the previous period: only 15% of the patients presented hyperglycemia over half their ICU stay versus 34% of the patients in the previous period (p<0.001). The hyperglycemia incidence reduction remained significant after adjustment for ISS, age and RBC/12hrs (p<0.0001).
Figure 7.
Predicted probability of death in trauma patients adjusted for age, Injury Severity Score (ISS), red blood cell units transfused in the first 12 hours postinjury (RBC/12hrs) and proportion of ICU days with hyperglycemia (glucose>200mg/dL)
Discussion
We identified a lower probability of mortality and other adverse outcomes with TGC levels compared to CGC levels, especially among elderly patients. This finding further supports the subgroup analyses of the NICE SUGAR trial that indicated a possible trend toward subgroup-specific TGC treatment effects for patients with trauma as compared with those without trauma (p=0.07 for the interaction term).13
A large proportion of these patients were unable to reach TGC levels for more than half of their ICU stay despite an intensive insulin protocol, suggesting injury was associated with some level of insulin resistance. Our protocol is relatively similar to that used in the Leuven study22, and likely to be aggressive enough to reach glucose control. Thus, it is conceivable that the hyperglycemia is due to trauma-related systemic inflammation. This is further supported by higher insulin requirements in non-survivors to achieve similar glucose levels compared to patients with more favorable outcomes. A recent study of critical trauma patients on computerized insulin protocols found that patients, who did not normalize their glucose levels rapidly, required significantly higher insulin doses, also suggesting insulin resistance.23 This pattern of insulin resistance may be a marker of the severity of the postinjury inflammatory response. Alternatively, it is conceivable that trauma patients may require a more aggressive protocol than other populations, a question that could only be answered in a prospective trial.
Critically injured elderly patients are particularly susceptible to insulin resistance, which has been attributed to an age-related, less efficient metabolic response after trauma involving more norepinephrine and decreased insulin growth factor.24,25 Other investigators have reported an age effect on glucose levels of trauma patients. Shin et al.26 found that younger trauma patients were able to normalize glucose levels within 24 hours of admission more frequently than their older counterparts, and Bochicchio et al.27 observed that adult trauma patients with glucose levels > 140 mg/dL were older and had significantly worse outcomes compared to patients with glucose levels less than 139 mg/dL.
Our findings are limited because we did not include data on steroid use and enteral feeding, however the timing of the start of the protocols on cortisol replacement and early enteral nutritional support did not coincide with changes in mean glucose levels. The adrenal insufficiency screening and treatment protocol was implemented in our ICU in 200218, two years before the full implementation of the TGC protocol. Similarly, we do not believe that the described association of glucose control and adverse outcomes was affected by nutrition route (enteral versus parenteral) since our early enteral support protocols for torso trauma management were implemented in the 1980’s.28–30
In conclusion, elderly trauma patients represent a distinct population who may benefit from TGC. The design of future RCTs investigating the appropriate target level of glucose control must use appropriate sampling of trauma patients, and within the injured, adequate sample size of those in advanced age groups, in order to tailor current guidelines of glucose control to the underlying disease and age group.
Acknowledgments
This study was performed at University of Colorado Denver and Denver Health Medical Center.
This study was supported in part by National Institute of General Medical Sciences grants: P50 GM049222. The content is solely the responsibility of the authors and does not necessarily represent the official views of the NIGMS or National Institutes of Health.
Abbreviations
- BMI
body mass index
- CGC
conventional glucose control level
- DHMC
Denver Health Medical Center
- ICU
intensive care unit
- IFD
ICU free days
- IQR
interquartile range
- mg/dL
milligrams per deciliter
- MOF
multiple organ failure
- RBC/12hours
red blood cell units transfused in the first 12 hours postinjury
- RCT
randomized controlled trial
- SEM
standard error of the mean
- TGC
tight glucose control level
- VFD
ventilator free day
Footnotes
Publisher's Disclaimer: This is a PDF file of an unedited manuscript that has been accepted for publication. As a service to our customers we are providing this early version of the manuscript. The manuscript will undergo copyediting, typesetting, and review of the resulting proof before it is published in its final citable form. Please note that during the production process errors may be discovered which could affect the content, and all legal disclaimers that apply to the journal pertain.
References
- 1.McCowen KC, Malhotra A, Bistrian BR. Stress-induced hyperglycemia. Crit Care Clin. 2001;17:107–124. doi: 10.1016/s0749-0704(05)70154-8. [DOI] [PubMed] [Google Scholar]
- 2.van den Berghe G, Wouters P, Weekers F, et al. Intensive insulin therapy in the critically ill patients. N Engl J Med. 2001;345:1359–1367. doi: 10.1056/NEJMoa011300. [DOI] [PubMed] [Google Scholar]
- 3.Hemmila MR, Taddonio MA, Arbabi S, Maggio PM, Wahl WL. Intensive insulin therapy is associated with reduced infectious complications in burn patients. Surgery. 2008;144:629–635. doi: 10.1016/j.surg.2008.07.001. discussion 35-7. [DOI] [PMC free article] [PubMed] [Google Scholar]
- 4.Gibson BR, Galiatsatos P, Rabiee A, et al. Intensive insulin therapy confers a similar survival benefit in the burn intensive care unit to the surgical intensive care unit. Surgery. 2009;146:922–930. doi: 10.1016/j.surg.2009.04.035. [DOI] [PubMed] [Google Scholar]
- 5.Sperry JL, Frankel HL, Vanek SL, et al. Early hyperglycemia predicts multiple organ failure and mortality but not infection. J Trauma. 2007;63:487–493. doi: 10.1097/TA.0b013e31812e51fc. discussion 93-4. [DOI] [PubMed] [Google Scholar]
- 6.Wahl WL, Taddonio M, Maggio PM, Arbabi S, Hemmila MR. Mean glucose values predict trauma patient mortality. J Trauma. 2008;65:42–47. doi: 10.1097/TA.0b013e318176c54e. discussion 7-8. [DOI] [PubMed] [Google Scholar]
- 7.Kreutziger J, Schlaepfer J, Wenzel V, Constantinescu MA. The role of admission blood glucose in outcome prediction of surviving patients with multiple injuries. J Trauma. 2009;67:704–708. doi: 10.1097/TA.0b013e3181b22e37. [DOI] [PubMed] [Google Scholar]
- 8.Bochicchio GV, Sung J, Joshi M, et al. Persistent hyperglycemia is predictive of outcome in critically ill trauma patients. J Trauma. 2005;58:921–924. doi: 10.1097/01.ta.0000162141.26392.07. [DOI] [PubMed] [Google Scholar]
- 9.Arabi YM, Dabbagh OC, Tamim HM, et al. Intensive versus conventional insulin therapy: a randomized controlled trial in medical and surgical critically ill patients. Crit Care Med. 2008;36:3190–3197. doi: 10.1097/CCM.0b013e31818f21aa. [DOI] [PubMed] [Google Scholar]
- 10.De La Rosa Gdel C, Donado JH, Restrepo AH, et al. Strict glycaemic control in patients hospitalised in a mixed medical and surgical intensive care unit: a randomised clinical trial. Crit Care. 2008;12:R120. doi: 10.1186/cc7017. [DOI] [PMC free article] [PubMed] [Google Scholar]
- 11.Graffagnino C, Gurram AR, Kolls B, Olson DM. Intensive insulin therapy in the neurocritical care setting is associated with poor clinical outcomes. Neurocrit Care. 2010;13:307–312. doi: 10.1007/s12028-010-9469-4. [DOI] [PubMed] [Google Scholar]
- 12.Green DM, O'Phelan KH, Bassin SL, Chang CW, Stern TS, Asai SM. Intensive versus conventional insulin therapy in critically ill neurologic patients. Neurocrit Care. 2010;13:299–306. doi: 10.1007/s12028-010-9417-3. [DOI] [PubMed] [Google Scholar]
- 13.Finfer S, Chittock DR, Su SY, et al. Intensive versus conventional glucose control in critically ill patients. N Engl J Med. 2009;360:1283–1297. doi: 10.1056/NEJMoa0810625. [DOI] [PubMed] [Google Scholar]
- 14.Gunst J, Van den Berghe G. Blood glucose control in the intensive care unit: benefits and risks. Semin Dial. 2010;23:157–162. doi: 10.1111/j.1525-139X.2010.00702.x. [DOI] [PubMed] [Google Scholar]
- 15.Scalea TM, Bochicchio GV, Bochicchio KM, Johnson SB, Joshi M, Pyle A. Tight glycemic control in critically injured trauma patients. Ann Surg. 2007;246:605–610. doi: 10.1097/SLA.0b013e318155a789. discussion 10-2. [DOI] [PubMed] [Google Scholar]
- 16.Eriksson EACD, Vanderkolk WE, Bonnell BW, Hoogeboom JE, Ott MM. Tight blood glucose control in trauma patients: Who really benefits? J Emerg Trauma Shock. 2011;4:359–364. doi: 10.4103/0974-2700.83864. [DOI] [PMC free article] [PubMed] [Google Scholar]
- 17.Moore FA, Sauaia A, Moore EE, Haenel JB, Burch JM, Lezotte DC. Postinjury multiple organ failure: a bimodal phenomenon. J Trauma. 1996;40:501–510. doi: 10.1097/00005373-199604000-00001. discussion 10-2. [DOI] [PubMed] [Google Scholar]
- 18.Ciesla DJ, Moore EE, Johnson JL, et al. Decreased progression of postinjury lung dysfunction to the acute respiratory distress syndrome and multiple organ failure. Surgery. 2006;140:640–647. doi: 10.1016/j.surg.2006.06.015. discussion 7-8. [DOI] [PubMed] [Google Scholar]
- 19.Sauaia A, Moore EE, Johnson JL, Ciesla DJ, Biffl WL, Banerjee A. Validation of postinjury multiple organ failure scores. Shock. 2009;31:438–447. doi: 10.1097/SHK.0b013e31818ba4c6. [DOI] [PMC free article] [PubMed] [Google Scholar]
- 20.Schoenfeld DA, Bernard GR. Statistical evaluation of ventilator-free days as an efficacy measure in clinical trials of treatments for acute respiratory distress syndrome. Crit Care Med. 2002;30:1772–1777. doi: 10.1097/00003246-200208000-00016. [DOI] [PubMed] [Google Scholar]
- 21.Sauaia A, Moore FA, Moore EE, Haenel JB, Read RA. Pneumonia: cause or symptom of postinjury multiple organ failure? Am J Surg. 1993;166:606–610. doi: 10.1016/s0002-9610(05)80664-6. discussion 10-1. [DOI] [PubMed] [Google Scholar]
- 22.Van den Berghe G, Wouters PJ, Bouillon R, et al. Outcome benefit of intensive insulin therapy in the critically ill: Insulin dose versus glycemic control. Crit Care Med. 2003;31:359–366. doi: 10.1097/01.CCM.0000045568.12881.10. [DOI] [PubMed] [Google Scholar]
- 23.Mowery NT, Gunter OL, Dossett LA, et al. Failure to achieve euglycemia despite aggressive insulin control signals abnormal physiologic response to trauma. J Crit Care. 2011;26:295–302. doi: 10.1016/j.jcrc.2010.10.015. [DOI] [PubMed] [Google Scholar]
- 24.Frankenfield D, Cooney RN, Smith JS, Rowe WA. Age-related differences in the metabolic response to injury. J Trauma. 2000;48:49–56. doi: 10.1097/00005373-200001000-00009. discussion-7. [DOI] [PubMed] [Google Scholar]
- 25.Jeevanandam M, Petersen SR, Shamos RF. Protein and glucose fuel kinetics and hormonal changes in elderly trauma patients. Metabolism. 1993;42:1255–1262. doi: 10.1016/0026-0495(93)90122-5. [DOI] [PubMed] [Google Scholar]
- 26.Shin S, Britt RC, Reed SF, Collins J, Weireter LJ, Britt LD. Early glucose normalization does not improve outcome in the critically ill trauma population. Am Surg. 2007;73:769–772. discussion 72. [PubMed] [Google Scholar]
- 27.Bochicchio GV, Joshi M, Bochicchio KM, et al. Early hyperglycemic control is important in critically injured trauma patients. J Trauma. 2007;63:1353–1358. doi: 10.1097/TA.0b013e31815b83c4. discussion 8-9. [DOI] [PubMed] [Google Scholar]
- 28.Biffl WL, Moore EE, Haenel JB. Nutrition support of the trauma patient. Nutrition. 2002;18:960–965. doi: 10.1016/s0899-9007(02)00987-5. [DOI] [PubMed] [Google Scholar]
- 29.Moore EE, Dunn EL, Jones TN. Immediate jejunostomy feeding. Its use after major abdominal trauma. Arch Surg. 1981;116:681–684. doi: 10.1001/archsurg.1981.01380170153027. [DOI] [PubMed] [Google Scholar]
- 30.Moore EE, Jones TN. Benefits of immediate jejunostomy feeding after major abdominal trauma--a prospective, randomized study. J Trauma. 1986;26:874–881. doi: 10.1097/00005373-198610000-00003. [DOI] [PubMed] [Google Scholar]


