


Abstract
Acute leukemias are characterized by deregulation of transcriptional networks that control the lineage specificity of gene expression. The aberrant overexpression of the Spi-1/PU.1 transcription factor leads to erythroleukemia. To determine how Spi-1 mechanistically influences the transcriptional program, we combined a ChIP-seq analysis with transcriptional profiling in cells from an erythroleukemic mouse model. We show that Spi-1 displays a selective DNA-binding that does not often cause transcriptional modulation. We report that Spi-1 controls transcriptional activation and repression partially through distinct Spi-1 recruitment to chromatin. We revealed several parameters impacting on Spi-1-mediated transcriptional activation. Gene activation is facilitated by Spi-1 occupancy close to transcriptional starting site of genes devoid of CGIs. Moreover, in those regions Spi-1 acts by binding to multiple motifs tightly clustered and with similar orientation. Finally, in contrast to the myeloid and lymphoid B cells in which Spi-1 exerts a physiological activity, in the erythroleukemic cells, lineage-specific cooperating factors do not play a prevalent role in Spi-1-mediated transcriptional activation. Thus, our work describes a new mechanism of gene activation through clustered site occupancy of Spi-1 particularly relevant in regard to the strong expression of Spi-1 in the erythroleukemic cells.
INTRODUCTION
A finely regulated network of transcription factors (TFs) and cooperating factors controls hematopoietic development and homeostasis by activating or repressing lineage-specific genes. Genetic alterations, such as mutations and chromosomal translocations that target TFs, are largely implicated in the progression of acute myeloid leukemia (AML). These alterations lead to the deregulation of the TF network and impair the normal process of differentiation from stem or progenitor cells. For example, the aberrant overexpression of the TF Spi-1/PU.1 resulting from Friend-virus insertional mutagenesis or transgenesis in mice blocks the differentiation of erythroid progenitors and induces erythroleukemia (1,2). Although it is clear that alterations of the transcriptional program of erythroid cells are expected in such a murine model, the mechanisms of transcriptional reprogramming are not clear.
The Spi-1/PU.1 TF is a major regulator of developmental processes that functions in hematopoietic stem cell and progenitor cell self-renewal as well as in the commitment and/or maturation of the myeloid and B-lymphoid cell lineages (3–5). Spi-1/PU.1 belongs to the ETS family of TFs, which includes many proteins with developmental and differentiation functions. These ETS TFs share a conserved winged helix-turn-helix DNA-binding domain (DBD) and bind to DNA consensus sequences containing a core 5′-GGA(A/T)-3′ motif. The ETS family has been subdivided into 12 classes based on phylogenetic analyses of their DBDs (6,7) and, more recently, into 4 classes based on their DNA-binding specificities (8). Spi-1 belongs to class III of the ETS family according to the latest classification. This class exhibits the most divergent consensus sequences upstream of 5′-GGA-3′ compared with the three other classes of the ETS family members. This class includes only two other factors: Spi-B and Spi-C (8).
The demonstration that ETS-family TFs have distinct functions (9) even though they share the same DNA recognition motifs raised an important question about what determines the specificity of TF-mediated transcriptional activity. The expression pattern of the ETS factors and the tissue-specific expression of cooperating factors (6,10) contribute to this specificity. It has been shown that distinct cooperative partnership dictates the specificity of the transcriptional regulation by two different ETS TFs, ETS1 and GABPα, expressed in the same cell type (11,12). In lymphoid cells and macrophages in which Spi-1 is necessary for differentiation, the lineage specificity of Spi-1 target genes has been linked to the presence of lineage-specific cofactors at the enhancers of those genes (13,14).
Spi-1 is expressed at low level in erythroid progenitors and downregulated upon terminal differentiation (15,16). Its expression beyond physiological expression levels promotes oncogenesis in erythroid lineage as evidenced by the development of erythroleukemia due to Friend virus (MEL) or to Spi-1 transgenesis in mice (2,17). Spi-1 stimulates oncogenesis by blocking erythroid differentiation (2). Also, we have recently shown that Spi-1 induces resistance to apoptosis (18) and accelerates gene elongation during replication (19). In MEL cells, Spi-1 has been shown to block erythroid differentiation through the repression of GATA-1 transcriptional activity during erythropoiesis (20–22). However, recent data indicate that Spi-1 also acts through a GATA-1-independent mechanism (23).
Given the function of Spi-1 as a TF, a deregulation of transcriptional networks is expected in erythroleukemic progenitors. In order to further understand how Spi-1 when overexpressed, mechanistically controls transcription in the erythroleukemic cells, we combined a chromatin immunoprecipitation followed by massive sequencing of Spi-1-enriched DNA fragments (ChIP-seq) with gene expression profiling. Here, we describe the distinct parameters that control Spi-1 DNA-binding and Spi-1-mediated transcriptional activity. We reveal distinct properties of Spi-1 genomic occupancy associated with transcriptional activation or repression by Spi-1. Moreover, we provide evidence for a mechanism of transcriptional activation involving the recruitment of multiple Spi-1 molecules in orientated manner and in close proximity to the transcriptional start site (TSS).
MATERIALS AND METHODS
Cells and tissues
Cell suspensions from enlarged spleen of spi-1 transgenic mice that developed an erythroleukemia have been cultured in α-MEM supplemented with 5% FBS and erythropoietin (Epo) (1 U/ml) (2). The erythroleukemic cells were engineered to express anti-spi-1 shRNAs (shSpi-1-A2B and shSpi-1-A2C) or control shRNA with scrambled sequence (control cells) in the presence of doxycycline (dox, 100 ng/ml) as previously described (18). Experiments in mice were performed in accordance with relevant institutional guidelines from The Direction départementale des Services vétérinaires de Paris (Approval 16 August 2004).
Gene expression analysis by microarrays or RT-qPCR and statistical analysis
For the transcriptome experiments, 104 cells/ml were grown with or without dox for 26 h or 44 h. Total RNA from the shSpi-1-A2B, shSpi-1-A2C and control cells cultured with or without dox was extracted using the RNeasy Mini kit (Qiagen). Microarray experiments were performed according to the Affymetrix protocol to quantify the expression of more than 39 000 transcripts with 45 000 probe sets (based on the UniGene database, Build 107, June 2002). The microarrays were normalized using GC-RMA with the EMA R package (24). The distribution of the fluorescence intensity of the probe sets measured using the MOE430v2 Affymetrix microarrays follows a bimodal curve with one group corresponding to non-expressed genes (fluorescence <20) and another group corresponding to expressed genes (fluorescence >20) (24). We applied a first ANOVA model to analyse the effects to be considered and constitute the groups of samples. According to the ANOVA results, all of the following samples were pooled to constitute the Spi-1+ control group: control cells cultured with and without dox and ShSpi-1-A2B and ShSpi-1-A2C cells without dox cultured for 26 h and 44 h (23 microarrays). The Spi-1− cells that expressed anti-spi-1 shRNAs were: shSpi-1-A2B and shSpi-1-A2C cells treated with dox for 44 h (8 microarrays). The probesets corresponding to genes that were differentially expressed between the Spi-1-overexpressing and Spi-1-knockdown cells were determined by applying ANOVA with an adjusted P < 0.01 (the Benjamini and Hochberg method). The FC was calculated as the ratio of the normalized fluorescence intensity in the Spi-1− samples to that of the Spi-1+ samples. More details are reported in the Supplementary Methods. Expression data are available from the database of Institut Curie (http://microarrays.curie.fr/publications/U830-gene-bio-cancer/Spi-1_PU.1).
For RT-qPCR, 1 μg of total RNA was reverse transcribed using an iScript Reverse Transcription Kit (Bio-Rad, Hercules, CA, USA). RT-qPCR was performed using TaqMan Expression Assays and Taqman Master Mix (Applied Biosystems, Foster City, CA, USA) on a Chromo4 System (Bio-Rad). Data were analyzed using an Opticon Monitor (Bio-Rad) and normalized to GAPDH mRNA level. Fold changes (FCs) were calculated from enrichment between dox treated and untreated cells using the 2−ΔΔCt method.
ChIP assay
For erythroleukemic cell lines, 104 cells/ml were maintained in culture for 3 days. For in vivo ChIP-seq, we used freshly isolated spleen cells from spi-1 transgenic mice that developed an erythroleukemia. A total of 8 × 10⁶ cells were used per ChIP assay using the ChIP assay kit (Millipore) following the manufacturer’s protocol. ChIP assays were repeated at least three times. The DNA precipitated from the different experiments performed using antibodies with the same specificity in the same cells was combined after verification of the quality of each ChIP on positive targets by quantitative PCR (see Supplementary Methods).
ChIP-seq library and SOLiD sequencing
The SOLiD System 2.0 workflow for the Lower Input/Lower Complexity DNA fragment library preparation kit was used following the manufacturers’ instructions (Applied Biosystems) starting with 100 ng of ChIP (or input) DNA.
SOLiD ChIP-seq DNA fragment libraries were sequenced using SOLiD system 2.0 and SOLiD system 3.0 chemistries to produce DNA sequences with reads of 35 and 50 nucleotides, respectively. The ChIP-seq experiment comprised three SOLiD runs. The first run (SOLiD system 2.0) included sequencing of immunoprecipitated DNA fragments for the TF Spi-1 (1/4 slides), H3K36me3 (1/2 slides), RNA pol II (1/4 slides), polyclonal IgG (1/4 slides) and input (1/4 slides) from Spi-1-overexpressing erythroleukemic cells. The second run (SOLiD system 3.0) included sequencing for Spi-1 and input DNA from erythroleukemic cells issued from another individual spi-1 transgenic mouse (1/4 slides). For in vivo experiments, Spi-1 and Input samples sequencing was performed on SOLiD system 3.0 platform (1/8 slides).
The sequencing reads were aligned to the mm9 mouse genome using the SOLiD pipeline tools (Corona Lite, Applied Biosystems) with up to three and five mismatches per read for the SOLiD system 2.0 and system 3.0, respectively. Only the reads with a unique position in the genome were included in the subsequent analysis. The Spi-1 reads from the ChIP-seq performed on erythroleukemic cells maintained in culture and derived from the two spi-1 transgenic mice were pooled. A detailed description of the protocol is reported in the Supplementary Methods.
Peak detection and filtering
To detect peaks corresponding to putative binding regions, we used the FindPeaks algorithm (25) and the MICSA pipeline (26).
Two filters were applied for the peak selection. First, for the Spi-1 ChIP-seq performed on erythroleukemic cells maintained in culture, we selected peak height thresholds that corresponded to 10% false discovery rate (FDR) based on the peak height threshold of 11.5 reads. For the Spi-1 ChIP-seq performed on the spleens in vivo, we selected a lower threshold of 6.5 reads to get comparable number of peaks. For RNA Pol II, because of the low number of reads and based on empirical data, we chose a peak height threshold of 4.5 reads. Second, we discarded the peaks that highly overlapped with any peaks from the matching control dataset as defined by the MICSA pipeline (26) and described in the Supplementary Methods. This method was applied for the Spi-1 and RNA Pol II ChIP. Since the H3K36me3 peaks have a different distribution pattern (this epigenetic marker is expected to cover whole gene bodies), a specific strategy was applied for the H3K36me3 dataset. For details on peak detection and filtering, see Supplementary Methods.
Peak annotation
We annotated the peaks according to their functional location within RefSeq genes (http://www.ncbi.nlm.nih.gov/refseq/rsg/about/, release April 2011). The gene location categories were: promoter (−1.5 kb upstream of the TSS), immediate downstream (‘ImDown’, +2 kb downstream of the TSS), enhancer (−30 kb to −1.5 kb upstream of the TSS), intragenic (+2 kb downstream of the TSS to the TE), 5 kb downstream (‘5kbdown’, +5 kb after the TE). For the peaks annotation (Supplementary Table S2), if one peak could be assigned to several overlapping isoforms of one gene, we used a hierarchy and assigned the peak to only one isoform. We use the following priorities: promoter > immediate downstream > intragenic > enhancer > 5-kb downstream. In the cases of two overlapping genes, we included both entries. The resulting table contains only one entry per peak per RefSeq gene (Supplementary Table S2). For gene annotation (Supplementary Table S3), all Refseq isoforms are considered.
The raw and mapped sequencing reads, peak calls and signal tracks are available from the NCBI Gene Expression Omnibus (GEO) (http://www.ncbi.nlm.nih.gov/geo) under accession GSE33611. Visualization of signal track is available in the UCSC Genome Browser: http://genome.ucsc.edu/cgi-bin/hgTracks?hgS_doOtherUser=submit&hgS_otherUserName=Valentina.boeva&hgS_otherUserSessionName=Ridinger_mm9_Spi1
CpG islands (CGIs) ±2 kb around the TSS are detected as regions with GC content of 50% or greater, length >200 bp, ratio >0.6 of observed number of CG dinucleotides to the expected number on the basis of the number of Gs and Cs in the segment (track generated using a modification of a program developed by G. Miklem and L. Hillier (unpublished) downloadable from the UCSC genome browser).
Motif analysis
We performed de novo motif discovery using ChIPMunk (27), MEMEChIP (28) and TOMTOM 4.6.1 (29) (Jaspar Core database) from the MEME software suite. For motif enrichment analysis of known TFs, we used PATSER from the CompleteMOTIFs suite with the default parameters and the Jaspar and Transfac motif databases (30).
We used DNA regions ±150 bp from the position corresponding to the maximum peak height. Sequence logos were generated using WebLogo (31). The RegionMiner module of the Genomatix Software Suite and matrices for TF families (Genomatix Software GmbH) were used for the TF co-occupancy search. The methods used to estimate the positional preferences between Spi-1 motifs in Spi-1 binding sites are described in the Supplementary Methods.
RESULTS
Genome-wide identification of Spi-1 binding in erythroleukemic cells by ChIP-seq
We sought to investigate how the Spi-1 occupancy on DNA impacts transcriptional regulation in erythroleukemic cells. Thus, we set out to determine all the binding sites occupied by Spi-1 within the genome of erythroleukemic cells derived from Spi-1 transgenic mice (2). We performed ChIP-seq experiments on erythroleukemic cells with antibodies targeting Spi-1 or IgG (as a control), followed by massive sequencing of the enriched DNA fragments (ChIP-seq). In parallel, we immunoprecipitated and sequenced DNA fragments from the same cell lysates using antibodies targeting RNA polymerase II (RNA Pol II) or trimethylated histone H3 at lysine 36 (H3K36me3). RNA Pol II binding in the gene promoter is most frequently associated with gene transcription and indicates which TSS is employed. However, a large proportion of non-expressed genes can contain RNA Pol II islands (32,33). The epigenetic mark H3K36me3 across nucleosomal regions downstream of the TSSs is linked to the transcriptional elongation of expressed genes (33,34).
The candidate binding sites (peaks) were called using tag extension. For the final peak selection, we applied two types of filters to minimize the detection of artifact bindings. Ultimately, 17 781 Spi-1 peaks and 15 946 RNA Pol II peaks were kept for the further analysis. For H3K36me3, we assigned a score to each RefSeq isoform based on the peak height and gene size (Supplementary Methods and Supplementary Figure S1).
For further validation, we performed quantitative PCR analysis after the RNA pol II and Spi-1 ChIP assay (ChIP-qPCR) of randomly selected sequences from the ChIP-seq experiments (Supplementary Table S1). Of the 21 Spi-1 binding sites tested, 20 were validated, and all of the RNA Pol II binding sites tested (9) were validated by ChIP-qPCR. Spi-1 and RNA Pol II peak heights from the ChIP-seq data were correlated with the DNA-binding fold enrichment by q-PCR (linear correlation, R2 =0.56 and 0.67, respectively). This result validates our approach for binding site detection based on peak heights.
We explored the distribution of RNA Pol II and Spi-1 binding sites across five different genomic subregions of Refseq annotated genes (Figure 1A). These subregions were defined using distribution of distances of Spi-1 and RNA Pol II peaks from the gene TSSs or the gene transcription ends (TEs) (Supplementary Figure S2): promoter (−1.5 kb upstream of the TSS), immediate downstream (‘ImDown’, +2 kb downstream of the TSS), enhancer (−30 kb to −1.5 kb upstream of the TSS), intragenic (+2 kb downstream of the TSS to the TE), 5 kb downstream (‘5kbdown’, +5 kb after the TE).
Figure 1.
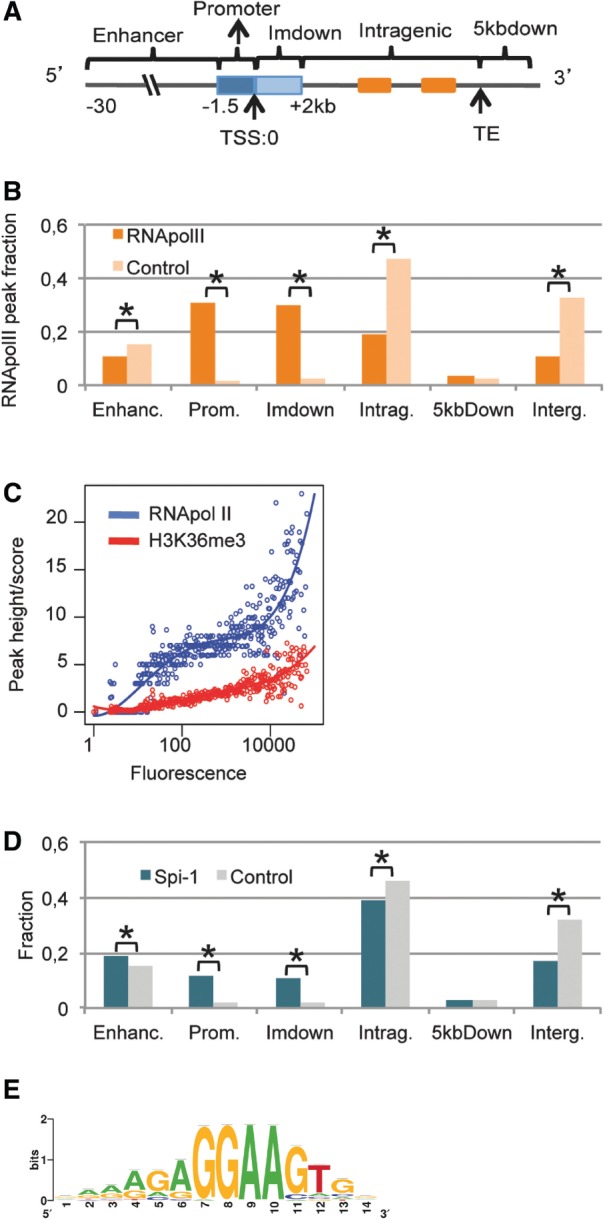
Spi-1 and RNA Pol II exhibit preferential binding in the genome. (A) The definition of each genomic region is described. (B) The histograms represent the distribution of RNA Pol II peaks location relative to the nearest TSS. See the Methods section for details. χ2 test; Asterisk indicates P < 10−3. (C) The median peak height of RNA Pol II in the promoter or ImDown subregions (−1.5 kb + 2 kb) or score of H3K36me3 (y-axis) versus the gene expression levels measured by the median fluorescence using microarray data (x-axis). Each y-value was calculated for an interval of fluorescence. The solid curve is a fit with a polynomial of degree 4 by robust regression using an M estimator from the R package MASS and the ‘rlm’ function: http://cran.r-project.org/web/packages/MASS/MASS.pdf). (D) The histograms represent the distribution of the total Spi-1 and control peaks in the murine genome. See the ‘Materials and Methods’ section for details. χ2 test; Asterisk indicates P < 10−3. (E) Sequence logos of the PWM produced by ChIPMunk software using all 17 781 Spi-1 peak sequences generated using WebLogo are shown; the PWM threshold corresponds to a FDR of 10%.
The RNA Pol II peaks were located mainly in the promoter or ImDown subregions (Figure 1B, Supplementary Table S2). The peak heights of RNA Pol II were positively correlated with the gene expression levels measured by the fluorescence intensity obtained from Affymetrix gene arrays (Spearman, ρ = 0.67, P = 2.2 × 10⁻¹⁶) (Figure 1C). Interestingly, 84% of the genes where RNA Pol II was bound to the promoter or ImDown subregions were expressed, and only 12% of the non-expressed genes contained RNA Pol II peaks (Supplementary Table S3). The score of H3K36me3 abundance within the coding regions also correlated with the gene expression level (Spearman, ρ = 0.66, P = 2.1 × 10⁻¹⁶) (Figure 1C). We used the H3K36me3 score as a criterion of gene expression instead of the microarray profile and again found that RNA Pol II was rarely bound to non-expressed genes (8% among genes with H3K36me3 <0.5; FDR <15%, Supplementary Table S3). Co-occupancy by RNA Pol II and H3K36me3 was detected in 89% of the expressed genes identified using the Affymetrix data. Thus, the mapping of RNA Pol II and H3K36me3 in the erythroleukemic cells allows defining the TSS used in a specific transcription unit.
Regarding the Spi-1 peaks, 83% were located within a region spanning from −30 kb upstream of the TSS to +5 kb downstream of the TE of genes, that was statistically different from Input and IgG control peaks (68% inside genes) (χ2 test, P < 10−3, Figure 1D). This indicates that Spi-1 binding is highly gene-associated. Notably, the location of Spi-1 DNA binding was significantly biased toward the promoter and ImDown subregions compared with the control peaks (χ2 test, P < 10−3).
Using the ChIPMunk motif discovery tool, we identified the main Spi-1 motif underlying the 17 781 peaks sequences bound by Spi-1 (Figure 1E). The motif was similar to the canonical motif previously described (35,36). It was found in 88% of the Spi-1-bound regions in close proximity to the positions of peak maxima (±150 bp). We calculated that Spi-1 binds to 0.35% of mouse genome regions containing the Spi-1 motif. Scanning of the mouse genome with the Spi-1 Position Weight Matrix (PWM) revealed a random distribution of this motif throughout the genome (Supplementary Figure S3). This result indicates that the preferential Spi-1 binding to the promoter and ImDown subregions was not the result of a specific enrichment of the Spi-1 motif in the DNA sequences of those subregions but, was rather the result of a selective binding of Spi-1.
In conclusion, the results described here show that Spi-1 displays a direct and selective DNA-binding activity with a preferential enrichment proximal to genes and TSS.
Gene expression profiling as a function of Spi-1 expression
To further decipher the relationship between Spi-1 chromatin recruitment and transcription, the ChIP-seq data were explored in conjunction with gene expression microarray data. The transcriptome of Spi-1-overexpressing erythroleukemic cells was compared with that of cells in which Spi-1 expression had been knocked down using doxycycline(dox)-inducible shRNA against spi-1 (Figure 2A and (18)). We profiled transcriptome for two engineered erythroleukemic cell lines expressing spi-1 shRNA (shSpi-1-A2B and shSpi-1-A2C) and erythroleukemic cells expressing non-relevant shRNA (control) after 44 h in the presence or in the absence of dox (Figure 2A). From the expression microarrays, we calculated the FC as the expression ratio in dox-untreated compared with dox-treated cells. In all, 672 genes were transcriptionally activated (FC < 1.5) and 389 genes were repressed (FC > 1.5) by Spi-1). The genes that displayed a FC between 0.9 and 1.1 were defined as not modulated by Spi-1 (NoResp genes) (Table 1). The Spi-1-modulated genes were associated with distinct functions using Ingenuity software. The most significantly enriched functions were related to ‘cell death’ and ‘cellular growth and proliferation’. The ‘cellular development’ and ‘small molecules biochemistry’ groups contain mainly genes coding for hematopoietic differentiation, including erythropoiesis (heme synthesis, porphyrin/lipid regulation). These associations were consistent with the Spi-1 functions that we have previously identified (18,19). Groups of Spi-1-modulated genes associated with ‘cellular assembly and organization’ and ‘cellular function and maintenance’ mainly correspond to cytoskeletal proteins. Cytoskeletal proteins are coregulated by Spi-1 and Serum Response Factor (SRF) in macrophages (37). We validated the microarrays data by performing real time quantitative PCR (RT-qPCR) on 16 modulated genes from 3 of these functional categories (Supplementary Figure S4).
Figure 2.

Global expression profile of Spi-1-modulated genes. (A) shSpi-1-A2B (similar expression levels were observed in shSpi-1-A2C cells) and control cells were cultured with (26 h, 44 h and 96 h) or without dox (26 h and 44 h), and the extracted proteins were analyzed by western blotting using Spi-1 and adaptin antibodies. Two bands corresponding to Spi-1 were detected. (B) Ingenuity Pathway Analysis (IPA) of Spi-1 target genes. IPA was performed on Spi-1 activated and repressed genes as identified using expression microarrays. The 10 most significant molecular and cellular functions revealed are shown and -Log (Bonferroni–Holm P-value) are indicated. The orange bar represents the P-value threshold of 0.05 (-Log (P-value) = 1.3).
Table 1.
Number of genes transcriptionally regulated and/or occupied by Spi-1
| Genes | Total | With Spi-1 peaks | Spi-bound genes (%) |
|---|---|---|---|
| Repressed | 389 | 281 | 72 |
| Activated | 672 | 573 | 85 |
| NoResp | 9750 | 4844 | 50 |
| Complete genome | 20 282 | 10 560 | 52 |
The number of genes regulated by Spi-1 derived from expression microarrays MOE430v2 and the number of genes with Spi-1 peaks revealed using ChIP-seq analysis are indicated. Activated genes: FC < 0.66; Repressed genes: FC > 1.5; NoResp: 0.9 < FC < 1.1; with FDR < 10−2; Complete genome: total genes in the mouse genome.
We crossed information about Spi-1 binding with information about Spi-1 regulation of genes. Half of all genes contained Spi-1 binding sites, i.e. within a −30-kb region upstream of the TSS to +5 kb downstream of the TE, (Table 1) and, only 8.1% (854 out of 10 560) of the Spi-1-occupied genes were transcriptionally modulated. This finding indicates that Spi-1 binding to DNA is not sufficient to predict Spi-1 activity in transcriptional regulation. Interestingly, the fraction of genes bound by Spi-1 was higher among the activated (85%) and repressed genes (72%) than among the NoResp genes (50%) (χ2 test, P = 2 × 10−63 and 2 × 10⁻¹⁵, for activated and repressed genes respectively, compared with NoResp genes; Table 1). Thus, the fact that genes showing changed expression have nearby Spi-1 binding sites more frequently than NoResp genes is highly indicative of a direct role of Spi-1 in the regulation of genes transcription. Functionally, these Spi-1-occupied genes whose transcription is modulated by Spi-1 belong to the same categories that the ones identified above using only the transcriptome data. The ‘cell death’ and ‘cellular growth and proliferation’ categories are still the more significantly enriched groups of functions. In addition, new categories, such as ‘cell movement’ and ‘cell interaction’, were identified among the top 10 most significantly enriched groups of functions by considering the Spi-1-occupied and -regulated genes (Figure 2B, bottom).
The location of Spi-1 binding differs in Spi-1-activated and -repressed genes
To identify the determining parameters of the impact of Spi-1 binding on gene transcription, we analyzed the Spi-1 peak locations within genes of different transcriptional categories. Notably, in the activated genes, the Spi-1 peaks were located closer to the TSS than in the repressed and non-modulated genes (Figure 3A). Indeed, 60% of the activated genes contained Spi-1 peaks located within 5 kb regions around gene TSSs, whereas the same proportion of repressed and NoResp genes contained peaks within 19 kb and 47 kb around TSSs, respectively. This finding suggests that distinct localization of Spi-1 binding in the genome influences the nature of the transcriptional response. We wanted to check that the proximity of Spi-1 binding to TSS in activated genes was not due to the relaxed chromatin structure that may facilitate the shearing and recovery of the immunoprecipitated DNA during the Chip-seq procedure. Thus, we examined the location of control peaks (Input and IgG) in the same cells (Figure 3A). We found that the location of control peaks inside activated, repressed or NoResp genes was fairly similar and was not skewed toward gene TSSs.
Figure 3.

Combination of ChIP-seq and gene expression analysis reveals a distinct Spi-1 peaks localization in activated and repressed genes. (A) Cumulative distribution of the distance between a gene TSS and the nearest Spi-1 or the control (Input and IgG) peaks for the different transcriptional response categories. (B) The histograms represent the enrichment of Spi-1-bound genes of each transcriptional category with respect to the total number of Spi-1-bound genes within each class of the subregion. Statistical analyses versus the total number of genes were performed using the χ2 test; Asterisk indicates P < 10−3; Double asterisk indicates P < 10−10. (C) Distribution of the distance from the Spi-1 and RNA Pol II peaks to the nearest gene TSS, as determined by the hierarchy model, in each transcriptional response category. The distributions on each side of the TSS within 50-bp windows are reported.
Then, we investigated whether the genes that were transcriptionally regulated by Spi-1 and, at the same time, occupied by Spi-1 exhibited enriched occupancy of Spi-1 in a particular subregion. For all of the genes and for the three transcriptional categories, we calculated the percentage of genes containing Spi-1 peaks in each subregion using gene annotation that included all of the RefSeq mRNA isoforms (Supplementary Table S3). The enrichment of Spi-1 binding was calculated as the ratio between the percentage of genes from a given transcriptional category and the percentage of all genes that contain a Spi-1 peak within the explored subregion. Spi-1-activated genes displayed the strongest enrichment of Spi-1 peaks in the promoter (x2.3) and ImDown (x2.8) subregions (Figure 3B). This observation is consistent with the very close proximity of the Spi-1 binding to the TSSs of Spi-1-activated genes (Figure 3A and 3C). It is noticeable that Spi-1 binding was excluded from 100 bp regions around TSSs of Spi-1 activated genes (Figure 3C, top panel), most likely because the transcriptional machinery, including RNA Pol II, impedes the accessibility of Spi-1 to DNA. Accordingly, RNA Pol II exhibited maximal enrichment of binding at the TSS (Figure 3C, lower panel). No enrichment was detectable in the promoters of Spi-1-repressed genes compared with the all gene set. The strongest enrichment of Spi-1 binding was in the intragenic subregion. Moreover, Spi-1 occupancy in the non-responsive genes was not enriched in any specific genomic subregion.
Taken together, these findings indicate that the genomic location of Spi-1 binding may influence Spi-1 transcriptional response. Spi-1 gene activation was mainly associated with Spi-1 binding in promoters and ImDown genomic regions, whereas gene repression was instead associated with Spi-1 binding further from TSS.
Search for TF partners of Spi-1 that determine the transcriptional consequences of Spi-1 genomic binding
We next wanted to define which are the additional constraints that determine the transcriptional consequences of Spi-1 genomic occupancy, in addition to the binding location. We considered that Spi-1 binding to activated genes might be direct, whereas Spi-1 binding in repressed genes may require a DNA-binding partner. For each subregion and transcriptional category, we performed de novo search for the most over-represented DNA motif in the Spi-1 peak sequences. The most over-represented motif for each category was similar to the Spi-1 consensus motif identified for the whole Spi-1 peaks (Figure 1D). More importantly, the Spi-1 consensus motif was identified in Spi-1 peaks at similarly high frequencies in each subregion and transcriptional category (from 78% to 89%) (Supplementary Figure S5A). In the peaks that did not contain the canonical Spi-1 motif, we found a specific motif enrichment exclusively in the Spi-1 binding sequences of repressed genes (MEME P-value = 2.7 × 10⁻⁹), that is a degenerated Tal1::GATA1 motif (TOMTOM, E = 0.054) (Supplementary Figure S5B). Motif enrichment analysis using PATSER from CompleteMotif also found the Tal1::GATA1 known motif as significantly enriched (P = 1.5 × 10⁻¹¹) only in the repressed genes (Supplementary Figure S5B) (30), suggesting that Tal-1 or Gata-1 might mediate Spi-1 recruitment to chromatin in these repressed genes (10% of all Spi-1-repressed genes). Here, we did not consider separately peaks of different genomic subregions because of the too small number of peaks inside each category.
Thus, our analysis shows that even if Spi-1 may bind indirectly to DNA through a cofactor in few repressed genes, it is a rare event. In contrast, Spi-1 DNA binding to the great majority of genes is direct regardless of the nature of the subsequent transcriptional response.
Next, we hypothesized that distinct factors cooperating with Spi-1 may impact the nature of the transcriptional response. In the Spi-1 peak sequences containing at least one Spi-1 motif hit, we searched for putative Spi-1 cis-cooperating DNA binding factors by de novo motif discovery analysis using ChIPMunk (option ‘mask’). We were looking for motifs specifically present in Spi-1-activated or -repressed genes compared with NoResp genes. Over-represented motifs were found in Spi-1-bound enhancers and promoters of activated genes that were not detected in NoResp genes (Supplementary Figure S6). However, they did not match any DNA-binding motif recognized by known TFs (TOMTOM threshold: E-value <0.05). In the NoResp genes, we detected an overrepresented motif similar to the Sp1 motif in the Spi-1 peaks located inside the promoter or ImDown subregions (Supplementary Figure S6; Sp1). This observation means that the association of Spi-1 with Sp1 motif on DNA was not linked to Spi-1 transcriptional effects. Additionally, we performed a motif enrichment analysis for each category using the motif scanning tool PATSER (Transfac and Jaspar motifs libraries of known TFs) (Supplementary Table S4). The 20 most enriched motifs in any of the six categories were also overrepresented in all other categories (P-value <10−6), indicating that none of the enriched TF identified was specific for a transcriptional category.
In conclusion, no evidence supports the existence of a specific and major known cofactor that delineates the transcriptional activity (repression versus activation) of Spi-1-bound genes in erythroleukemic cells.
The presence of CGIs closed to TSS influences the Spi-1 binding and the transcriptional consequences
CGIs are sequences that coincide with the TSS and influence the transcription through creating opened or closed chromatin structure (38). Fifty-four percent of mouse genes contain CGIs in their promoters and ImDown subregions (from UCSC genome brownser, see Materials and Methods section). This proportion reached 77% among genes bound by Spi-1 in their promoters and ImDown subregions. This fact raised the hypothesis that the CGI presence influences Spi-1 binding and, possibly, Spi-1 function in transcription regulation. We observed that the percent of genes with CGI was lower among Spi-1 activated genes (66%) than among Spi-1 repressed and NoResp genes (74% and 76%, respectively). Interestingly, when Spi-1 occupied the promoter or ImDown subregions, there were more Spi-1-activated genes among genes without CGI than among genes with a CGI (14% versus 8%, χ2 test, P < 1.9 × 10⁻⁴) (Figure 4A). In contrast, the proportion of repressed genes was the same regardless of the CGI presence.
Figure 4.

Clustering of Spi-1 binding is associated with transcriptionally activated genes and occurs mainly in promoters devoid of CGIs. (A) Spi-1 occupancy in the promoter + ImDown subregions devoid of CGI increases the probability to positively influence gene transcription. The histograms represent the percentage of the repressed or activated genes when Spi-1 peaks are within promoter + ImDown subregions that contain (with CGI) or not (w/o CGI) CGIs. (B) Distribution of the number of ChIPMunk-defined Spi-1 motif hits per Spi-1 peak in the promoter + ImDown, intragenic and enhancer subregions according to Spi-1 transcriptional activities. The red square indicates the mean, and the black line inside the box plot indicates the median. The Wilcoxon test was used to statistically examine the differences in the distributions of the number of Spi-1-motif hits. P < 0.05 was considered statistically significant. (C) Distribution of the number of ChIPMunk-defined Spi-1-motif hits per Spi-1 peak sequence in the promoters + ImDown subregions that contain (with CGI) or not (w/o CGI) CGIs and according to Spi-1 transcriptional activities. The red square indicates the mean, and the black line inside the box plot indicates the median. The Wilcoxon test was used to statistically examine the differences in the distributions of the number of Spi-1-motif hits. P < 0.05 was considered statistically significant.
These data indicate that Spi-1 binding is favored at CG rich sequences, but the absence of CGIs increases the potential of Spi-1 to activate gene expression. Thus, the presence of CGI represents a parameter that may influence the consequence of Spi-1 genomic occupancy on transcription.
Clustering of Spi-1 motifs characterizes Spi-1 binding in Spi-1-activated genes
Using Genomatix software (module to find overrepresented combinations of known TF motifs), we detected a significant overrepresentation of Spi-1 binding site pairs in the Spi-1 peaks containing at least one Spi-1 motif hit (Z-score = 290; overrepresentation = 23). This result prompted us to test the hypothesis that the presence of multiple Spi-1 binding sites impacts the transcriptional activity of Spi-1-bound genes. We examined the number of canonical Spi-1 motif hits within each peak according to the gene transcription status. The promoter and ImDown subregions of activated genes tend to have Spi-1 peaks containing more motif matches than NoResp and repressed genes (Figure 4B). The same tendency was also observed, but at a lower level, within the intragenic peaks. The opposite is true for enhancer; the repressed genes contained more Spi-1 motif hits compared with NoResp and activated genes (Figure 4B).
Altogether, these results revealed that when Spi-1 is bound to promoters or ImDown subregions, the presence of several repeats of the Spi-1 motif is associated with the Spi-1 function as transcriptional activator. This finding together with the fact that Spi-1 binding in promoters or ImDown subregions is more likely associated with gene activation by Spi-1, suggests that multiple Spi-1 motif hits in regions proximal to TSS favor specifically gene transcription activation by Spi-1 in the erythroleukemic cells. Of note, the presence of repeats of the Spi-1 motif in the enhancers is associated with the repression of genes but this is a rare event as Spi-1 binding in enhancer was not highly enriched in Spi-1 repressed genes.
We have described above that the presence of CGIs affects the Spi-1 binding and Spi-1 mediated transcription. So, we investigated the relationship between the abundance of Spi-1 motif hits in the Spi-1 peaks and the presence of CGIs in the Spi-1-modulated genes (Figure 4C). Interestingly, the number of Spi-1 motif hits in the Spi-1-activated genes was significantly higher in promoters without CGIs than in promoters containing CGIs (mean values were 5.6 versus 3.9, P = 8.1 × 10⁻⁵, respectively). Moreover, in the absence of CGIs, the number of Spi-1 motif hits in the peaks located in the promoter or ImDown subregions was significantly higher in the activated genes than in the repressed and NoResp genes (Figure 4C; the mean values were 5.6, 3.4 and 3.8 for the activated, repressed and NoResp genes, respectively). These results reveal that the presence of multiple Spi-1 binding sites in promoter and ImDown subregions is strongly associated with Spi-1-induced gene activation and that this constraint is particularly relevant in genes that do not contain CGI.
We then reasoned that if several Spi-1 molecules occupy a Spi-1 peak, the quantity of Spi-1-immunoprecipitated DNA fragments must be increased. We checked this prediction by evaluating the height of the Spi-1 peaks. Indeed, we found a correlation between the number of motif hits per peak and the Spi-1 peak height (Supplementary Figure S7). Moreover, we found that the highest Spi-1 peak heights were in the Spi-1-activated genes that have peaks in the promoter or Imdown subregions devoid of CGI (Figure 5A). These genes also display the highest number of Spi-1 motif hits. This data support the hypothesis that Spi-1 peaks in promoter and ImDown subregions of activated genes are occupied by several Spi-1 molecules. In contrast, in the enhancers of repressed genes the clustering of Spi-1 motifs did not result in higher peak heights compared with NoResp genes (data not shown). This observation is rather inconsistent with the hypothesis of a high occupancy by Spi-1 molecules at enhancers of repressed genes.
Figure 5.

Spi-1 motif hits distribution inside Spi-1 peaks respects rule of engagment. (A) Distribution of the Spi-1 peak heights in the promoter + ImDown subregions (all peaks) or peaks in the promoter + ImDown subregions that contain (with CGI) or not (w/o CGI) CGIs and according to Spi-1 transcriptional activities. The red square indicates the mean, and the black line within the box plot indicates the median. The Kolmogorov–Smirnov test was used to statistically examine the differences in the distribution of the Spi-1 peak height compared with the peaks in the NoResp group of genes; P < 0.05 was considered statistically significant. Distribution of the distances between the pairs of Spi-1 motif hits in (B) head-to-tail orientation (the same strand) or (C) in head-to-head or tail-to-tail orientation (opposite strands) for activated genes. The X-axis presents the length of the spacers separating pairs of Spi-1 motif hits. The Y-axis shows the fraction of sequences with at least one pair of Spi-1 motif hits separated by the selected spacer (see the Supplementary Methods for details).
Clustering of Spi-1 binding sites in activated genes mainly involves similar orientations of proximal motifs on similar DNA strands
Our finding strongly suggests that multiplicity of Spi-1 binding at a promoter participates in the transcription activation of Spi-1 target genes. We therefore explored whether there were particular ‘rules of engagement’ that might provide evidence for a mechanism of transcription control based on multiple Spi-1 binding. We evaluated the spatial organization of the Spi-1 motifs within peaks in Spi-1-activated genes, taking into account the dichotomy of the promoters with regard to the presence of CGIs. To this end, we measured the fraction of sequences with the same spacer length between two Spi-1 motif hits, considering the orientation of the hits in the pair, i.e. hits on the same strand (head-to-tail orientation) (Figure 5B) or on opposite strands (tail-to-tail and head-to-head) (Figure 5C). Interestingly, very few pairs of Spi-1 motifs were found in the reverse orientation (head-to-head or tail-to-tail). In contrast, we found that most Spi-1 pairs were positioned on the same strand, in a head-to-tail orientation (Figure 5B, Supplementary Table S5). Moreover, this analysis confirms that Spi-1 clustering in activated genes primarily occurs in promoter or ImDown subregions devoid of CGIs (Figure 5B, blue line). In that case, 50% of sequences with at least one pair of Spi-1 motif hits in head–tail orientation in activated genes were positioned within 80 bp of each other (Supplementary Figure S8). Overall, these data led us to consider that Spi-1-binding clusters occur according to a particular ‘rule of engagement’. Indeed, Spi-1 binding sites tend to tightly cluster in head-to-tail orientations on the same DNA strand. This orientation preference is evocative of a specific mechanism for the recruitment of Spi-1 to transcriptional regulatory elements and for the function of Spi-1 in gene transcription activation in erythroleukemic cells.
Spi-1 clustering is associated with Spi-1 gene activation in primary erythroleukemic cells
To examine whether Spi-1 motif clustering characterizes Spi-1-binding in Spi-1-activated genes in vivo, we performed ChIP-seq assays for Spi-1 in primary erythroleukemic cells from spleen of spi-1 transgenic mice. The leukemic spleens contained around 70% of erythroleukemic cells (our personal data). Seventy-three percent of Spi-1 binding sites inside promoters and ImDown subregions identified in the primary erythroleukemic cells were common to those identified in the erythroleukemic cells maintained in culture. Then, we examined the number of Spi-1 motif hits inside Spi-1 peaks of the promoters and ImDown subregions according to the transcriptional categories (genes activated, repressed and non-modulated by Spi-1) (Figure 6A). The distribution of the number of motif hits inside the Spi-1 peaks of activated genes differs significantly from the distribution of NoResp genes. No significant difference was seen for the repressed genes compared with the NoResp genes. The higher number of Spi-1 motif hits in activated genes was observed when Spi-1 occupies genes with no CGI in the promoters and ImDown subregions (Figure 6A). In addition, we found that the clustering of Spi-1 motifs was associated with a higher quantity of DNA bound to Spi-1, as measured by the Spi-1 peak height (Figure 6B). Thus, the multiplicity of Spi-1 binding at a promoter and the higher recruitment of Spi-1 at these promoters is also associated with the transcriptional activation of Spi-1 target genes in primary preleukemic cells.
Figure 6.

Properties of the ChIP-seq peaks in primary erythroleukemic cells. (A) Distribution of the number of ChIPMunk-defined Spi-1-motif hits per Spi-1 peak sequence in the promoters + ImDown subregions (all peaks) or peaks in the promoter + ImDown subregions that contain (with CGI) or not (w/o CGI) CGIs and according to Spi-1 transcriptional activities. The red square indicates the mean, and the black line inside the box plot indicates the median. The Wilcoxon test was used to statistically examine the differences in the distributions of the number of Spi-1-motif hits. P < 0.05 was considered statistically significant. (B) Distribution of the Spi-1 peak heights in the promoter + ImDown subregions (all peaks) or peaks in the promoter + ImDown subregions that contain (with CGI) or not (w/o CGI) CGIs according to Spi-1 transcriptional activities. The red square indicates the mean, and the black line within the box plot indicates the median. The Kolmogorov–Smirnov test was used to statistically examine the differences in the distribution of the Spi-1 peak height compared with the peaks in the NoResp group of genes; P < 0.05 was considered statistically significant.
DISCUSSION
The fine regulation of the expression of TFs and the transcriptional networks they manage, determine the development of the hematopoietic system. The function of TF as activator or repressor of transcription depends on genes and hematopoietic lineages. Recently, the genome-wide analysis of TF recruitment to DNA brought insight on how the specificity of gene expression is acquired in a particular hematopoietic lineage. Abnormalities of TFs activities, due to abnormal fusion-proteins, loss-of-function mutations or expression dysregulation, are well-described events contributing to tumor progression. However, the molecular pathways in which such alterated TFs deregulate transcription in the leukemic cells are not fully understood. Here, we explored how abnormal expression of Spi-1 impacts the transcription in a murine erythroleukemic context due to overexpression of Spi-1. We used the previously described model of primary erythroleukemic cells and inducible Spi-1 depletion in erythroleukemic cell lines derived from spi-1-transgenic mice (18). Combining ChIP-seq data with gene transcriptional profiling, our study sheds light on the outcome of Spi-1 chromatin occupancy on transcriptional regulation. We identified several parameters impacting on Spi-1-mediated transcriptional effect in erythroleukemic cells: (i) Spi-1 binds mainly directly to DNA at a specific motif, but DNA binding does not often insinuate transcriptional activity; (ii) the transcriptional response to Spi-1-binding is influenced by the Spi-1 binding location in the genes; (iii) Spi-1 occupancy at promoters or ImDown subregions of genes devoid of CGIs facilitates gene activation; (iv) tight clustering and similar orientation of Spi-1 motifs at the occupied regions favor detection of Spi-1-mediated transcriptional activation; and (v) in contrast to the myeloid and lymphoid B cells, in the erythroleukemic cells, lineage-specific cooperating factors do not play a prevalent role in the positive control of Spi-1-mediated transcriptional activation.
In erythroid progenitors, Spi-1 is expressed at low level. Downregulation of Spi-1 is required for erythroid terminal differentiation. Spi-1 overexpression promotes oncogenesis in erythroid lineage (2,17). We previously showed in the spi-1 transgenic mice that Spi-1 overexpression in erythroleukemic progenitors induces differentiation arrest, apoptosis resistance and replication acceleration (18,19). In these erythroleukemic cells, Spi-1 modulates a large number of genes (1062). Spi-1 occupies most of the genes that present gene expression change (81%). The gene expression profiling from transcriptome data associated with the binding patterns of Spi-1 on the whole genome led to define functional groups of Spi-1 target genes. Notably, many of these genes turned out to be involved in the processes of cell death, cellular growth and erythroid differentiation, their identities being consistent with Spi-1 oncogenic functions we described previously (2,18,19).
In the MEL cells, Spi-1 alters the transcriptional activities of GATA-1 by interacting with GATA-1 bound on DNA and by repressing GATA-1 target genes (20–22,39). We compared the Spi-1 genomic occupancy in the MEL erythroleukemic cells (23) and in the erythroleukemic cells derived from spi-1 transgenic mice (this study). Seventy-seven percent of genes occupied by Spi-1 in the MEL cells were also occupied in the spi-1 transgenic erythroleukemic cells. In the spi-1 transgenic erythroleukemic cells, we found that Spi-1 peaks falling in the repressed genes, that do not contain Spi-1 motif, are enriched for the GATA-1::TAL1 binding motif. This result is consistent with an indirect Spi-1 DNA binding through GATA-1, mechanism that may participate to the repression of genes. However, it concerns only few genes (73 out of 390 repressed genes). Thus, we conclude that Spi-1 represses genes mainly through direct binding to DNA. Interestingly, recent reports provide evidence for a mechanism of repressive regulation of the erythroid core complex (GATA-1/SCL/Klf1) target genes by direct binding of Spi-1 to chromatin in normal fetal liver erythroid progenitors (40). In the spi-1 transgenic erythroleukemic cells, we also found that Spi-1 represses erythroid genes through direct binding to chromatin (for example, fetch, uros, ppox, ank1 and spnb1,alas2) suggesting that Spi-1 inhibits erythroid differentiation through a direct repression of erythroid genes. Spi-1 represses genes mainly through binding inside genes in regions distal from the TSS. Moreover, we found that when Spi-1 occupied enhancer regions in repressed genes, the binding sites contain clustered Spi-1 motifs. However, the clustering of Spi-1 motifs did not result in higher peak heights in repressed genes compared with NoResp genes (data not shown). This observation is rather inconsistent with the hypothesis of a high occupancy by Spi-1 molecules of clustered Spi-1 motifs at enhancers. Further investigations of the mechanism of transcriptional repression by Spi-1 may require complementary analysis of epigenetic modifications that are known to participate in gene silencing.
Spi-1 promotes myelopoiesis and B lymphopoiesis (3–5). Several studies have recently described the genome-wide chromatin occupancy of Spi-1 in macrophages (13,14,37,41), neutrophilic cells (8), B lymphocytes (14) and hematopoietic precursor cells (42). It is remarkable that in these hematopoietic cells, Spi-1 binds to a huge number of sites in the genome. For example, in HPC-7 progenitor cells, 22 720 Spi-1 bound sites were found (42). In the myeloid and B lymphoid cells, 45 631 and 32 575 Spi-1 bound sites were found, respectively. In the spi-1 transgenic preleukemic cells, the 17 781 Spi-1 peaks overlap with 0.35% of the Spi-1 motif hits in the mouse genome. A parallel analysis of Spi-1 genomic occupancy in macrophages and B cells showed that differentially bound sites between the two lineages were mostly located at the enhancers, whereas similar occupancy levels in both cell types were observed at TSS-proximal regions (13,14). This cellular specificity of Spi-1 binding at the enhancer regions depends on the cooperation between Spi-1 and lineage-specific TFs (43). To establish whether abnormal Spi-1 overexpression in erythroleukemic cells change the expression of myeloid and/or lymphoid specific genes, we used the list of confirmed Spi-1 target genes governing hematopoietic lineage decisions that was compiled by Kamath et al. (44). We calculated that Spi-1 occupancy in erythroid cells occurred in 47% of the myeloid-specific and 33% of the lymphoid-specific genes but in 70% of the genes common to both myeloid and lymphoid lineages. We also found that Spi-1 modified the transcription of fewer myeloid (11.5%) or lymphoid (8%) genes compared with common genes (32%). Thus, Spi-1 is poorly efficient to induce the expression of myeloid and lymphoid lineage-specific genes in erythroleukemic cells. One likely reason is that most of the Spi-1 cofactors in macrophages (Jun and C/EBPα or B-lymphocytes (E2A, EBF1, Pax5 and Oct2) which are responsible for expression specificity, are lacking in the erythroleukemic cells (from our gene expression data). Consistent with this finding, we did not detect any enrichment of motifs indicative of a possible binding of those lineage-specific TFs in the peaks in any of the subregions of Spi-1-bound regulated genes.
Our study identified several mechanistic constraints that favor Spi-1 to function as an activator of gene transcription in both, erythroleukemic cell lines and primary erythroleukemic cells. Among those, we clearly showed that Spi-1 activates genes through direct binding to chromatin in promoters and genomic regions immediate downstream of the TSS. Considering that not all TSSs are known, the association between Spi-1 binding near the TSS and gene transcription activation might be even stronger. Indeed, 1417 Spi-1 peaks (8%) coincide with RNA Pol II peaks falling outside of annotated promoters in the erythroleukemic cells and might correspond to new promoter regions.
We noted that the absence of CGIs also favors the transactivation by Spi-1. Further study is needed to determine whether the ability of GC-rich elements to recruit specific proteins could explain that a GC-rich genomic context does not facilitate the function of Spi-1 as transactivator. In promoters and regions immediate downstream of the TSS, the Spi-1 binding sites contain clustering of multiple Spi-1 binding motifs. Strikingly, the spacing and the relative orientation of the Spi-1 motifs were reproducibly found in transcriptionally activated genes. Moreover, the high number of Spi-1 motif hits is associated with a high recruitment of Spi-1 to the chromatin. So, the particular configuration of clustering of Spi-1 motifs together with the high recruitment of Spi-1 to these sites strongly suggests that the binding of several Spi-1 molecules to DNA favors specifically the transcriptional activation by Spi-1. An alternative explanation would be that the presence of more sites insures that more cells contain at least one occupied site. However, the preference of one orientation of Spi-1 binding motifs in clusters over another does not support this hypothesis. Indeed, if Spi-1 occupied only one binding motif hit inside a cluster, each hit would be independent and will not follow a rule of engagement in the DNA, as observed. Moreover, in the erythroleukemic context, Spi-1 is highly expressed in each cell (1). So, it is probable that several molecules of Spi-1 act on the same genes.
ETS proteins exhibit redundant DNA occupancy of a consensus ETS-binding site in promoters (6). Thus, other ETS TFs, additionally to Spi-1, may co-occupy the Spi-1 binding motifs at the Spi-1 binding sites in erythroleukemic cells. However, we think that Spi-1 is the main protein occupying the binding sites for several reasons. Using a stringent PWM threshold that excludes the sequences with the most divergent motif, we found that the majority of Spi-1 binding sites (82%) contained a Spi-1-specific motif. Moreover, the nucleotides sequence of Spi-1 motif characterized is the most divergent among the motif sequences of others ETS proteins and the Spi-1 motif presents a low affinity for other ETS members (8). In addition, if ETS proteins compete with Spi-1 to bind DNA in erythroleukemic cells, the binding of Spi-1 will be the most likely because of the high expression of Spi-1 in the erythroleukemic cells. Finally, we found that the clustering of Spi-1 motifs at promoters was associated with a high occupancy of Spi-1, as deduced from the higher peak height. This finding led us to propose that there is a significant advantage for Spi-1 to bind to several proximal sites in the DNA in order to activate gene transcription. This will not necessarily involve interaction between the Spi-1 molecules as, to our knowledge, homodimerization of Spi-1 has not been described.
Taken together, our work establishes a mechanism underlying the activity of Spi-1 as transcriptional activator in erythroleukemic cells. A question raised by this finding is whether this mechanism is also involved in the normal function of Spi-1 in macrophages or B cells. Several data from the literature argue for a common mechanism in all the cell types. From an in vivo study of the dose-effect of Spi-1 on gene transcription, a bioinformatic analysis predicted clusters of Spi-1 binding sites in the promoters of Spi-1 activated genes (44). Moreover, in a recent study, several Spi-1 motifs within 100 bp of the central Spi-1 motif inside a Spi-1 binding site were identified in macrophages-specific or macrophages and B cells commonly bound sites of Spi-1 (14), but the impact of the Spi-1 motif multiplicity was not investigated in regard to the gene transactivation and binding regions in this study.
In conclusion, the study performed here brings evidence that beside co-occupancy by different ETS TFs, co-occupancy by an individual ETS TF may be a mechanism of gene activation. In addition, especially in regard to the strong aberrant expression of Spi-1 in the erythroleukemic cells, high occupancy of Spi-1 on clustered motif sites at promoters might program expression of genes relevant for the oncogenic function of Spi-1. Thus, these data provide a valuable resource of genes directly targeted by Spi-1 in erythroleukemic cells that can serve as a basis to explore the functional role of Spi-1 in oncogenesis.
SUPPLEMENTARY DATA
Supplementary Data are available at NAR Online: Supplementary Tables 1–5, Supplementary Figures 1–8, Supplementary Methods and Supplementary Reference [45].
FUNDING
Inserm, Institut Curie, Ligue National Contre le Cancer (Ile de France), Association C. Bouillot, Gefluc, Cancéropole Ile-de-France, GIS IBiSA-Génoscope (Evry), Association pour la Recherche Contre le Cancer (to P.R. and M.S.-R.), Société Française d’Hématologie (to P.R.), the Ministère de la Recherche (to M.S.-R.); Dynasty Foundation (to I.K.). Funding for open access charge: Association pour la Recherche contre le Cancer.
Conflict of interest statement. None declared.
Supplementary Material
ACKNOWLEDGEMENTS
The authors thank Jubin C., Albaud B. and Gentien D. for providing technical assistance and Tirode F. and Luchessi C. for providing computing assistance. C.G., M.R.-S., P.R. and F.M.-G. conceived and designed the experiments; M.R.-S., P.R., P.L.-N., B.L. and I.G. performed the experiments; V.B. performed the bioinformatic analysis with the help of I.K. (analysis of distances and orientation between TF binding site motifs), C.P. and P.H. (gene expression analysis by microarrays), C.G. and M.R.-S.; C.G., F.M.-G. and V.B. wrote the article. F.M., A.N. and E.B. contributed to materials and analysis tools.
REFERENCES
- 1.Moreau-Gachelin F, Tavitian A, Tambourin P. Spi-1 is a putative oncogene in virally induced murine erythroleukemia. Nature. 1988;331:277–280. doi: 10.1038/331277a0. [DOI] [PubMed] [Google Scholar]
- 2.Moreau-Gachelin F, Wendling F, Molina T, Denis N, Titeux M, Grimber G, Briand P, Vainchenker W, Tavitian A. Spi-1/PU.1 transgenic mice develop multistep erythroleukemias. Mol. Cell. Biol. 1996;16:2453–2463. doi: 10.1128/mcb.16.5.2453. [DOI] [PMC free article] [PubMed] [Google Scholar]
- 3.Iwasaki H, Somoza C, Shigematsu H, Duprez EA, Iwasaki-Arai J, Mizuno S, Arinobu Y, Geary K, Zhang P, Dayaram T, et al. Distinctive and indispensable roles of PU.1 in maintenance of hematopoietic stem cells and their differentiation. Blood. 2005;106:1590–1600. doi: 10.1182/blood-2005-03-0860. [DOI] [PMC free article] [PubMed] [Google Scholar]
- 4.Kim HG, de Guzman CG, Swindle CS, Cotta CV, Gartland L, Scott EW, Klug CA. The ETS family transcription factor PU.1 is necessary for the maintenance of fetal liver hematopoietic stem cells. Blood. 2004;104:3894–3900. doi: 10.1182/blood-2002-08-2425. [DOI] [PubMed] [Google Scholar]
- 5.Nutt SL, Metcalf D, D'Amico A, Polli M, Wu L. Dynamic regulation of PU.1 expression in multipotent hematopoietic progenitors. J. Exp. Med. 2005;201:221–231. doi: 10.1084/jem.20041535. [DOI] [PMC free article] [PubMed] [Google Scholar]
- 6.Hollenhorst PC, McIntosh LP, Graves BJ. Genomic and biochemical insights into the specificity of ETS transcription factors. Annu. Rev. Biochem. 2011;80:437–471. doi: 10.1146/annurev.biochem.79.081507.103945. [DOI] [PMC free article] [PubMed] [Google Scholar]
- 7.Laudet V, Hanni C, Stehelin D, Duterque-Coquillaud M. Molecular phylogeny of the ETS gene family. Oncogene. 1999;18:1351–1359. doi: 10.1038/sj.onc.1202444. [DOI] [PubMed] [Google Scholar]
- 8.Wei GH, Badis G, Berger MF, Kivioja T, Palin K, Enge M, Bonke M, Jolma A, Varjosalo M, Gehrke AR, et al. Genome-wide analysis of ETS-family DNA-binding in vitro and in vivo. EMBO J. 2010;29:2147–2160. doi: 10.1038/emboj.2010.106. [DOI] [PMC free article] [PubMed] [Google Scholar]
- 9.Bartel FO, Higuchi T, Spyropoulos DD. Mouse models in the study of the ETS family of transcription factors. Oncogene. 2000;19:6443–6454. doi: 10.1038/sj.onc.1204038. [DOI] [PubMed] [Google Scholar]
- 10.Verger A, Duterque-Coquillaud M. When ETS transcription factors meet their partners. Bioessays. 2002;24:362–370. doi: 10.1002/bies.10068. [DOI] [PubMed] [Google Scholar]
- 11.Hollenhorst PC, Chandler KJ, Poulsen RL, Johnson WE, Speck NA, Graves BJ. DNA specificity determinants associate with distinct transcription factor functions. PLoS Genet. 2009;5:e1000778. doi: 10.1371/journal.pgen.1000778. [DOI] [PMC free article] [PubMed] [Google Scholar]
- 12.Hollenhorst PC, Shah AA, Hopkins C, Graves BJ. Genome-wide analyses reveal properties of redundant and specific promoter occupancy within the ETS gene family. Genes Dev. 2007;21:1882–1894. doi: 10.1101/gad.1561707. [DOI] [PMC free article] [PubMed] [Google Scholar]
- 13.Ghisletti S, Barozzi I, Mietton F, Polletti S, De Santa F, Venturini E, Gregory L, Lonie L, Chew A, Wei CL, et al. Identification and characterization of enhancers controlling the inflammatory gene expression program in macrophages. Immunity. 2010;32:317–328. doi: 10.1016/j.immuni.2010.02.008. [DOI] [PubMed] [Google Scholar]
- 14.Heinz S, Benner C, Spann N, Bertolino E, Lin YC, Laslo P, Cheng JX, Murre C, Singh H, Glass CK. Simple combinations of lineage-determining transcription factors prime cis-regulatory elements required for macrophage and B cell identities. Mol. Cell. 2010;38:576–589. doi: 10.1016/j.molcel.2010.05.004. [DOI] [PMC free article] [PubMed] [Google Scholar]
- 15.Back J, Dierich A, Bronn C, Kastner P, Chan S. PU.1 determines the self-renewal capacity of erythroid progenitor cells. Blood. 2004;103:3615–3623. doi: 10.1182/blood-2003-11-4089. [DOI] [PubMed] [Google Scholar]
- 16.Pop R, Shearstone JR, Shen Q, Liu Y, Hallstrom K, Koulnis M, Gribnau J, Socolovsky M. A key commitment step in erythropoiesis is synchronized with the cell cycle clock through mutual inhibition between PU.1 and S-phase progression. PLoS Biol. 2010;8:e1000484. doi: 10.1371/journal.pbio.1000484. [DOI] [PMC free article] [PubMed] [Google Scholar]
- 17.Kosmider O, Denis N, Lacout C, Vainchenker W, Dubreuil P, Moreau-Gachelin F. Kit-activating mutations cooperate with Spi-1/PU.1 overexpression to promote tumorigenic progression during erythroleukemia in mice. Cancer Cell. 2005;8:467–478. doi: 10.1016/j.ccr.2005.11.009. [DOI] [PubMed] [Google Scholar]
- 18.Rimmele P, Kosmider O, Mayeux P, Moreau-Gachelin F, Guillouf C. Spi-1/PU.1 participates in erythroleukemogenesis by inhibiting apoptosis in cooperation with Epo signaling and by blocking erythroid differentiation. Blood. 2007;109:3007–3014. doi: 10.1182/blood-2006-03-006718. [DOI] [PubMed] [Google Scholar]
- 19.Rimmele P, Komatsu J, Hupe P, Roulin C, Barillot E, Dutreix M, Conseiller E, Bensimon A, Moreau-Gachelin F, Guillouf C. Spi-1/PU.1 oncogene accelerates DNA replication fork elongation and promotes genetic instability in the absence of DNA breakage. Cancer Res. 2010;70:6757–6766. doi: 10.1158/0008-5472.CAN-09-4691. [DOI] [PubMed] [Google Scholar]
- 20.Hong W, Kim AY, Ky S, Rakowski C, Seo SB, Chakravarti D, Atchison M, Blobel GA. Inhibition of CBP-mediated protein acetylation by the ETS family oncoprotein PU.1. Mol. Cell. Biol. 2002;22:3729–3743. doi: 10.1128/MCB.22.11.3729-3743.2002. [DOI] [PMC free article] [PubMed] [Google Scholar]
- 21.Rekhtman N, Radparvar F, Evans T, Skoultchi AI. Direct interaction of hematopoietic transcription factors PU.1 and GATA- 1: functional antagonism in erythroid cells. Genes Dev. 1999;13:1398–1411. doi: 10.1101/gad.13.11.1398. [DOI] [PMC free article] [PubMed] [Google Scholar]
- 22.Stopka T, Amanatullah DF, Papetti M, Skoultchi AI. PU.1 inhibits the erythroid program by binding to GATA-1 on DNA and creating a repressive chromatin structure. EMBO J. 2005;24:3712–3723. doi: 10.1038/sj.emboj.7600834. [DOI] [PMC free article] [PubMed] [Google Scholar]
- 23.Wontakal SN, Guo X, Will B, Shi M, Raha D, Mahajan MC, Weissman S, Snyder M, Steidl U, Zheng D, et al. A large gene network in immature erythroid cells is controlled by the myeloid and B cell transcriptional regulator PU.1. PLoS Genet. 2011;7:e1001392. doi: 10.1371/journal.pgen.1001392. [DOI] [PMC free article] [PubMed] [Google Scholar]
- 24.Servant N, Gravier E, Gestraud P, Laurent C, Paccard C, Biton A, Brito I, Mandel J, Asselain B, Barillot E, et al. EMA - A R package for Easy Microarray data analysis. BMC Res. Notes. 2010;3:277. doi: 10.1186/1756-0500-3-277. [DOI] [PMC free article] [PubMed] [Google Scholar]
- 25.Fejes AP, Robertson G, Bilenky M, Varhol R, Bainbridge M, Jones SJ. FindPeaks 3.1: a tool for identifying areas of enrichment from massively parallel short-read sequencing technology. Bioinformatics. 2008;24:1729–1730. doi: 10.1093/bioinformatics/btn305. [DOI] [PMC free article] [PubMed] [Google Scholar]
- 26.Boeva V, Surdez D, Guillon N, Tirode F, Fejes AP, Delattre O, Barillot E. De novo motif identification improves the accuracy of predicting transcription factor binding sites in ChIP-Seq data analysis. Nucleic Acids Res. 2010;38:e126. doi: 10.1093/nar/gkq217. [DOI] [PMC free article] [PubMed] [Google Scholar]
- 27.Kulakovskiy IV, Boeva VA, Favorov AV, Makeev VJ. Deep and wide digging for binding motifs in ChIP-Seq data. Bioinformatics. 2010;26:2622–2623. doi: 10.1093/bioinformatics/btq488. [DOI] [PubMed] [Google Scholar]
- 28.Bailey TL, Elkan C. Fitting a mixture model by expectation maximization to discover motifs in biopolymers. Proc. Int. Conf. Intell. Syst. Mol. Biol. 1994;2:28–36. [PubMed] [Google Scholar]
- 29.Gupta S, Stamatoyannopoulos JA, Bailey TL, Noble WS. Quantifying similarity between motifs. Genome Biol. 2007;8:R24. doi: 10.1186/gb-2007-8-2-r24. [DOI] [PMC free article] [PubMed] [Google Scholar]
- 30.Kuttippurathu L, Hsing M, Liu Y, Schmidt B, Maskell DL, Lee K, He A, Pu WT, Kong SW. CompleteMOTIFs: DNA motif discovery platform for transcription factor binding experiments. Bioinformatics. 2011;27:715–717. doi: 10.1093/bioinformatics/btq707. [DOI] [PMC free article] [PubMed] [Google Scholar]
- 31.Crooks GE, Hon G, Chandonia JM, Brenner SE. WebLogo: a sequence logo generator. Genome Res. 2004;14:1188–1190. doi: 10.1101/gr.849004. [DOI] [PMC free article] [PubMed] [Google Scholar]
- 32.Barski A, Cuddapah S, Cui K, Roh TY, Schones DE, Wang Z, Wei G, Chepelev I, Zhao K. High-resolution profiling of histone methylations in the human genome. Cell. 2007;129:823–837. doi: 10.1016/j.cell.2007.05.009. [DOI] [PubMed] [Google Scholar]
- 33.Mikkelsen TS, Ku M, Jaffe DB, Issac B, Lieberman E, Giannoukos G, Alvarez P, Brockman W, Kim TK, Koche RP, et al. Genome-wide maps of chromatin state in pluripotent and lineage-committed cells. Nature. 2007;448:553–560. doi: 10.1038/nature06008. [DOI] [PMC free article] [PubMed] [Google Scholar]
- 34.Bannister AJ, Schneider R, Myers FA, Thorne AW, Crane-Robinson C, Kouzarides T. Spatial distribution of di- and tri-methyl lysine 36 of histone H3 at active genes. J. Biol. Chem. 2005;280:17732–17736. doi: 10.1074/jbc.M500796200. [DOI] [PubMed] [Google Scholar]
- 35.Karim FD, Urness LD, Thummel CS, Klemsz MJ, McKercher SR, Celada A, Van Beveren C, Maki RA, Gunther CV, Nye JA, et al. The ETS-domain: a new DNA-binding motif that recognizes a purine-rich core DNA sequence. Genes Dev. 1990;4:1451–1453. doi: 10.1101/gad.4.9.1451. [DOI] [PubMed] [Google Scholar]
- 36.Ray-Gallet D, Mao C, Tavitian A, Moreau-Gachelin F. DNA binding specificities of Spi-1/PU.1 and Spi-B transcription factors and identification of a Spi-1/Spi-B binding site in the c-fes/c-fps promoter. Oncogene. 1995;11:303–313. [PubMed] [Google Scholar]
- 37.Sullivan AL, Benner C, Heinz S, Huang W, Xie L, Miano JM, Glass CK. Serum response factor utilizes distinct promoter- and enhancer-based mechanisms to regulate cytoskeletal gene expression in macrophages. Mol. Cell. Biol. 2011;31:861–875. doi: 10.1128/MCB.00836-10. [DOI] [PMC free article] [PubMed] [Google Scholar]
- 38.Deaton AM, Bird A. CpG islands and the regulation of transcription. Genes Dev. 2011;25:1010–1022. doi: 10.1101/gad.2037511. [DOI] [PMC free article] [PubMed] [Google Scholar]
- 39.Zhang P, Zhang X, Iwama A, Yu C, Smith KA, Mueller BU, Narravula S, Torbett BE, Orkin SH, Tenen DG. PU.1 inhibits GATA-1 function and erythroid differentiation by blocking GATA-1 DNA binding [In Process Citation] Blood. 2000;96:2641–2648. [PubMed] [Google Scholar]
- 40.Wontakal SN, Guo X, Smith C, Maccarthy T, Bresnick EH, Bergman A, Snyder MP, Weissman SM, Zheng D, Skoultchi AI. A core erythroid transcriptional network is repressed by a master regulator of myelo-lymphoid differentiation. Proc. Natl Acad. Sci. USA. 2012;109:3832–3837. doi: 10.1073/pnas.1121019109. [DOI] [PMC free article] [PubMed] [Google Scholar]
- 41.Lefterova MI, Steger DJ, Zhuo D, Qatanani M, Mullican SE, Tuteja G, Manduchi E, Grant GR, Lazar MA. Cell-specific determinants of peroxisome proliferator-activated receptor gamma function in adipocytes and macrophages. Mol. Cell. Biol. 2010;30:2078–2089. doi: 10.1128/MCB.01651-09. [DOI] [PMC free article] [PubMed] [Google Scholar]
- 42.Wilson NK, Foster SD, Wang X, Knezevic K, Schutte J, Kaimakis P, Chilarska PM, Kinston S, Ouwehand WH, Dzierzak E, et al. Combinatorial transcriptional control in blood stem/progenitor cells: genome-wide analysis of ten major transcriptional regulators. Cell Stem Cell. 2010;7:532–544. doi: 10.1016/j.stem.2010.07.016. [DOI] [PubMed] [Google Scholar]
- 43.Gupta P, Gurudutta GU, Saluja D, Tripathi RP. PU.1 and partners: regulation of haematopoietic stem cell fate in normal and malignant haematopoiesis. J. Cell. Mol. Med. 2009;13:4349–4363. doi: 10.1111/j.1582-4934.2009.00757.x. [DOI] [PMC free article] [PubMed] [Google Scholar]
- 44.Kamath MB, Houston IB, Janovski AJ, Zhu X, Gowrisankar S, Jegga AG, DeKoter RP. Dose-dependent repression of T-cell and natural killer cell genes by PU.1 enforces myeloid and B-cell identity. Leukemia. 2008;22:1214–1225. doi: 10.1038/leu.2008.67. [DOI] [PubMed] [Google Scholar]
- 45.Kulakovskiy IV, Belostotsky AA, Kasianov AS, Esipova NG, Medvedeva YA, Eliseeva IA, Makeev VJ. A deeper look into transcription regulatory code by preferred pair distance templates for transcription factor binding sites. Bioinformatics. 2011;27:2621–2624. doi: 10.1093/bioinformatics/btr453. [DOI] [PubMed] [Google Scholar]
Associated Data
This section collects any data citations, data availability statements, or supplementary materials included in this article.