Abstract
Nucleosome positioning maps of several organisms have shown that Transcription Start Sites (TSSs) are marked by nucleosome depleted regions flanked by strongly positioned nucleosomes. Using genome-wide nucleosome maps and histone variant occupancy in the mouse liver, we show that the majority of genes were associated with a single prominent H2A.Z containing nucleosome in their promoter region. We classified genes into clusters depending on the proximity of H2A.Z to the TSS. The genes with no detectable H2A.Z showed lowest expression level, whereas H2A.Z was positioned closer to the TSS of genes with higher expression levels. We confirmed this relation between the proximity of H2A.Z and expression level in the brain. The proximity of histone variant H2A.Z, but not H3.3 to the TSS, over seven consecutive nucleosomes, was correlated with expression. Further, a nucleosome was positioned over the TSS of silenced genes while it was displaced to expose the TSS in highly expressed genes. Our results suggest that gene expression levels in vivo are determined by accessibility of the TSS and proximity of H2A.Z.
INTORDUCTION
Nucleosome positioning impacts genome organization at sites of gene expression, recombination hotspots and origins of replication. Genome-wide nucleosome positioning maps have been studied extensively in yeast, fly, worm and mammalian cells in culture (1–7). Changes in gene expression are usually accompanied by local reorganization of chromatin achieved by modification of the affinity of DNA for histones by covalent modifications and ATP dependent chromatin remodeling complexes. It is now well known that covalent modifications on histones, like methylation, acetylation and ubiquitinylation, mark genes for activation or repression. Apart from this, incorporation of histone variants provides another mechanism to modify DNA-histone affinity during transient changes in expression of genes. Although the presence of histone variants is well established, the functional role of these variants in regulation of gene expression is not fully understood. H2A.Z, a highly conserved variant of the histone H2A, is known to be associated with nucleosomes adjacent to the Transcription Start Site (TSS). H2A.Z differs from H2A in sequence and can confer unique properties on the nucleosome. The presence of H2A.Z at the −1 and +1 nucleosomes that flank the TSS has been linked to dynamic changes in gene expression. The presence of H2A.Z in the +1 nucleosome is correlated with high expression of genes in Drosophila (3). Shivaswamy et al. showed that, in yeast, the displacement of nucleosomes in the vicinity of the TSS is associated with dynamic changes in gene expression during heat shock response (8). Similarly, the displacement of the −1 nucleosome, containing the H2A.Z variant, was implicated in the transcriptional induction of genes during T-cell activation (4). Both the yeast and human studies use conditions where rapid changes in gene expression take place in a large number of genes. More recently, several studies have shown that the positioning of nucleosomes can influence the accessibility of regulatory factors to the DNA. The stability of nucleosomes is a potentially important property that facilitates displacement of nucleosomes and accessibility of regulatory factors that depends on the incorporation of histone variants. Thus, histone variants can affect the footprint of the nucleosomes and their stability, key factors that can influence rapid transcriptional activation. However, the role of these factors in establishing and sustaining basal tissue-specific expression levels of genes is not understood.
We generated a genome-wide nucleosome positioning map for the mouse liver and analysed the organization of nucleosomes with specific histone variants around the TSS in transcriptionally active and silent genes. We used this nucleosome positioning map to study the impact of the organization of histone variants and the relative positioning of nucleosome at the TSS on the steady-state expression levels of genes. Here we show that, typically, each gene is associated with a prominent H2A.Z containing nucleosome. The distance between the H2A.Z containing nucleosome and the TSS is inversely correlated to the expression level of the gene and RNA polymerase II occupancy up to seven nucleosomes in the promoter region. We confirmed that this relation between H2A.Z positioning and expression was seen in the mouse brain and liver tissue. This is a unique feature of H2A.Z variant because H3.3, a known H2A.Z interacting partner and a variant of the H3 histone was also localized at distinct promoter positions, but was not correlated to the expression levels of genes.
MATERIALS AND METHODS
Sample preparation
Liver and brain tissue from 8 week old, female FVB/NJ inbred mouse was dissected and homogenized to single-cell suspension in PBS. Nuclei were isolated as described previously (9). DNA fraction was purified from micrococcal nuclease digested (1U/O.D. MNase (Fermentas-EN0181) for 45 min at 37°C) chromatin after proteinase K treatment (60 µg/reaction). The DNA fraction was precipitated and subjected to RNase A treatment (DNase inactivated) (30 µg/reaction for 1 h at 37°C). The DNA was then precipitated and electrophoresed on 2% agarose gel, band corresponding to 150 bp was excised and gel purified (Supplementary Figure S1). Manufacturer’s instructions were followed for preparation of libraries for Solexa-based sequencing. Briefly, ends of the mononucleosomal DNA were repaired, to generate blunt end fragments, dATP was added to create a 3′ overhang. Manufacturer provided adapters were ligated to these fragments, and were selected by gel purification following electrophoresis. Finally, a small 10 step PCR was performed to generate DNA library.
ChIP-seq
ChIP was performed as described earlier by Nelson et al. and Skene et al. (10,11). Mononucleosomes were prepared as described above, in case of non-crosslinked ChIP experiments. In case of crosslinking, formaldehyde was added to the nuclei at a final concentration of 1.1% and incubated for 15 min. The reaction was quenched by adding glycine at a final concentration of 0.125 M for 5 min. The crosslinked nuclei were used for the preparation of mononucleosomes as mentioned above. For preparing mononucleosomes for ChIP, MNase was added at 3U/O.D. concentration. The reaction was stopped by the addition of MNase Stop buffer (25 mM Tris Cl pH-7.5, 100 mM EDTA, 100 mM NaCl, 1% SDS). Prior to pre-clearing, the Protein A agarose beads (Santa Cruz sc-2001) were washed 5 times with Dilution Buffer (20 mM Tris Cl pH-7.5, 2 mM EDTA, 150 mM NaCl, 10 mM MgCL2, 3 mM CaCl2, 1% Triton X-100). The chromatin was pre-cleared using blocked agarose beads. The supernatant was then subdivided into three fractions namely; input, mock and ChIP. Antibodies for H3.3(ab62642)/H2A.Z(ab18263) were added to the fraction for overnight incubation at 4°C. For mock, antibody for mouse IgG was used. The supernatant was then incubated with protein A agarose beads which were pre-washed with IP Buffer (50 mM Tris Cl pH-7.5, 5 mM EDTA, 150 mM NaCl, 0.5% NP-40, 1% Triton X-100) for 1 h 30 min at 4°C. The immunocomplex was then eluted using Chelex-100 (Bio-Rad, cat. no. 142-1253) as described earlier (10). The DNA sample was then treated with 3 ul of Proteinase K (20 mg/ml). It was incubated at 55°C for 45 min. Proteinase K was inactivated by boiling the samples for 10 min. Condensate was centrifuged to the bottom of the tube at 12 000g for 1 min at 4°C. The DNA was then treated with proteinase K and phenol-chloroform purified. The samples were RNase treated and repurified using phenol-chloroform extraction. The resulting DNA was used further for library preparation for Solexa sequencing. The DNA was used for SYBR green-based q-PCR analysis. We used SYBR Green Master Mix in a 10 ul reaction (3 ul DNA template, 2 ul primer pair (10 uM each), 5 ul Master Mix) in 384-well plate. qPCR validation of nucleosome occupancy and histone variant containing nucleosomes for selected regions was carried out using specific primers (Supplementary Table S1). q-PCR data were analysed according to Pfaffl et al. (12).
Solexa sequencing and data processing
The DNA library for mononucleosomes and ChIP samples was used to generate clusters on GAIIx flow cell as per manufacturer’s instructions using Illumina Cluster Station. The single end reads for nucleosome samples and paired end reads for ChIP samples were generated using Illumina Genome Analyzer GAIIx and analysed using the Illumina pipeline software with default parameters. The reads that qualified the quality cutoffs were mapped to the mouse Genome (mm9) using MAQ. The .mapview files were then processed using in-house developed python scripts; in case of paired-end reads, only correct pairs were used and processed to generate input files for GeneTrack (13). GeneTrack is a software package that performs smoothening of the data, detection of peaks and visualization of the data via webserver. The data fitting is done by Gaussian smoothing, the tightness of the fit was decided by fitting tolerance or SIGMA parameter which was 20. This represents the distance over which the contribution of the measurement falls to one-half of its original value. The peak prediction algorithm detects highest and non-overlapping peaks within assigned exclusion zone. The parameter blocks detection of any other peak within the specified region; exclusion zone of 147 bp was used for peak prediction. The predicted peaks are then stored in a database, which can then be retrieved along with chromosome, strand, coordinate and nucleosome strength information. All predicted nucleosomes extracted from GeneTrack were used for further analysis. For comparison among different datasets, normalization was carried out by dividing the number of reads with total number of reads for the respective sample and expressed in terms of per million total reads. Refseq (14) coordinates and RNA-seq (15) data were recovered from UCSC (16) and the Wold lab website, respectively. The unique reads from RNA-seq data for liver and brain were used for our analysis. RNA polymerase II occupancy data used were from Sun et al. (17) and processed similar to the RNA-seq data. H2A.Z occupancy for human CD4+ T cells was plotted from data originally reported in Barski et al. (18).
Refseq genes were filtered to remove the genes with same start or stop coordinates, furthermore, refseq genes with expression information in GNFatlas (19) were retained. Nucleosome, histone variant containing nucleosomes, RNA-seq and RNA pol II data were mapped to 1500 bp upstream and downstream of the TSS of each of the filtered Refseq genes. For calculation of nucleosome counts around TSS for Refseq genes, occurrence of nucleosome was changed to 1 and absence to 0 to create a matrix of 3000 coordinates versus 19 815 genes. Summation for each of these 3000 coordinates was used to generate nucleosome counts. Similarly we performed this exercise for other datasets. In the same way, we used the strengths of the nucleosomes to calculate the nucleosome occupancy.
Classification of tissue-specific genes
We used whole brain expression, simulated by averaging the GNFatlas expression data from all the brain sub-regions, as a control to identify genes that are amenable to transcription but silent in the liver. Log-transformed, quantile-normalized expression levels from GNFatlas were used for all calculations. Highly expressed genes were selected using a subset of probesets with expression level greater than 8 (average + 1 SD) and less than 2-fold change between brain and liver (Log2FC = log2(Liver) − log2(Brain); (+1 > Log2FC > −1)). Equal numbers of liver-specific probesets were created by selecting for the 1100 probesets with maximum Log2FC values between liver and brain. These probesets correspond to 1074 equally expressed genes, 947 silenced genes and 886 liver-specific genes, in Refseq. One thousand randomly generated genome coordinates were used for retrieving nucleosome profiles for random regions.
Clustering
The 3000 (coordinates) by 19 815 (genes) matrices for nucleosome strength were used for clustering. The genes positioned in rows were clustered according to nucleosome positions using k-means algorithm with k = 10, Euclidean distance metric and was iterated 10 times. The software Cluster 3.0 (20) was used for all of our clustering requirements and visualization of these clusters was done using Java Tree View (21). Clusters were rearranged in the order of proximity from TSS.
RESULTS
Nucleosome mapping
We isolated mononucleosomes, ligated the mononucleosomal DNA to adaptors and sequenced it using Solexa GAIIx (see ‘Materials and Methods’ section). Data fitting and nucleosome prediction was done using GeneTrack (13), with parameters as applied previously for yeast and Drosophila (3,22,23). We sequenced 94 million (93 501 978) nucleosomes which mapped to 10 million (9 970 240) consensus nucleosome positions for liver. The consensus nucleosome positions account for 2 GB of DNA sequence, with an average of 9 reads per nucleosome and cover 80% of the genome.
To confirm that we captured the known features of in vivo nucleosome occupancy, we explored nucleosome occupancy in specific regions of the genome. The highest nucleosome occupancy was at regions near the centromeres and telomeres. The mouse major satellite, consisting of 207 nucleotide repeat covering 40 kb on chromosome 9 is known to favour positioning of nucleosomes (23,24). The average nucleosome occupancy per nucleotide within the satellite was significantly higher than the corresponding value for the adjacent regions on the same chromosome (Supplementary Figure S2A). If a read happened to have two sites to which it matched perfectly, then it got assigned randomly leading to an average picture when sequences were aligned to identical repeats. The major satellite carries about 100 nucleosomes arranged in tandem flanked by GC-rich regions that are relatively free of nucleosomes. We found that both major and minor satellites and TG repeats were nucleosome dense whereas other simple repeat satellites like ZP3AR had relatively low nucleosome density (Supplementary Figure S2B). We next sought to examine the positioning of nucleosomes in liver-specific genes, known to be expressed at high level in vivo. We used the Mup1 and Mup9 genes because they code for the Major Urinary proteins expressed at high levels in the liver (25,26). RNA-seq data were used to confirm that these genes were transcriptionally active in the liver (15). We found that the region immediately following the TSS of these genes was associated with a strongly positioned nucleosome (Supplementary Figure S3). The nucleosome organization around the TSS of Mup 1 was also confirmed by qPCR (Supplementary Figure S3).
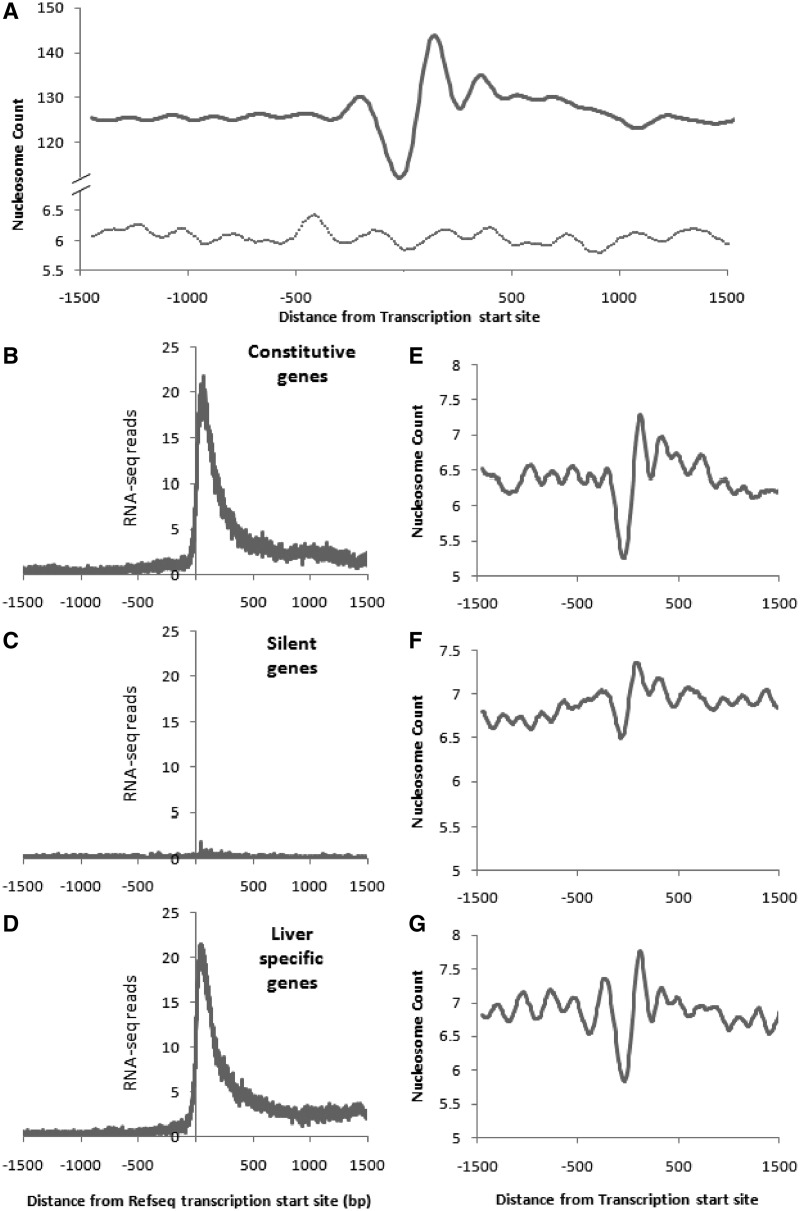
We generated the nucleosome occupancy profile around the TSS of all mouse Refseq genes and found a pattern similar to that reported earlier in yeast (7) and Drosophila (3), with a narrow nucleosome depleted region at the TSS followed by a strongly positioned nucleosome (Figure 1). The +1, +2 and +3 nucleosome peaks were centred at 120, 330 and 500 bp downstream to the TSS. The apparent difference between the baseline nucleosome counts at geneic regions and random regions is due to the use of only 1000 random regions in comparison to 20 000 genes.
Figure 1.
Nucleosome organization patterns at the TSS of all Refseq, constitutive, silent and tissue-specific genes in liver. The nucleosome counts around the TSS of (A) all Refseq genes (n = 19 815) in liver centred around the TSS and random regions represented by the dotted line (n = 1000). The annotated TSS of Refseq genes (A) is marked by zero. Thousand Random regions of similar length from the genome were analysed and the centre was marked as zero. The counts are normalized to per million reads. RNA-seq data confirm the annotated TSS of mouse Refseq genes in liver for constitutive (n = 1074) (B), silent (n = 947) (C) and tissue-specific genes (n = 886) (D). Selection of genes is described in ‘Materials and Methods’ section. The nucleosome counts of the corresponding regions around the TSS of constitutive (E), silent (F) and tissue-specific genes (G).
We classified genes according to their expression pattern into three classes, namely, Liver-specific genes, Constitutive genes and Silent genes based on the tissue-specific microarray data from GNFatlas and further confirmed their expression and TSS position using RNA-seq data (Figure 1B–D). We find highly phased nucleosomes in constitutive genes and liver-specific genes (Figure 1E and G) whereas, silent genes, in contrast, showed a less pronounced nucleosome depleted region at the TSS and weaker phasing on either side (Figure 1F). The peak to peak distances varied from 210 bp between +1 and +2 nucleosomes to 170 bp between +2 and +3 peaks. This pattern in the liver-specific and constitutive genes agrees well with the previous reports from yeast (1) showing that a nucleosome depleted region at the TSS followed by a series of phased nucleosomes, facilitates gene expression.
Masking of TSS by nucleosome in silent genes
The +1 nucleosome from the TSS is known to be positioned differently between yeast and the fly; the peak centred around +135 bp from the TSS in Drosophila, whereas the yeast +1 nucleosome is closer to the TSS, with a peak at +60 bp (3). We observed that the relative position of the +1 nucleosome in genes expressed at high levels in the liver was different from that of silent genes. The peak of the +1 nucleosome in constitutive genes is at +119 with respect to the TSS. Since the average length of the DNA associated with a mononucleosome is 147 bp, the +1 nucleosome will therefore occupy a footprint spanning +46 to +192 from the TSS in case of constitutive genes. In liver-specific genes, which are also transcriptionally active, the peak of the +1 nucleosome is centred at +98 suggesting a footprint from +25 to +171 with respect to the TSS (Table 1). However, the +1 nucleosome peak is centred at +40 in genes silenced in the liver allowing its footprint to span from −33 to +113, relative to the TSS. This allows the +1 nucleosome to mask the TSS of the silenced genes. Unlike the satellite sequences, these sequences are silent in liver but are transcribed in other tissues. We find this observation qualitatively reproducible in other samples tested, although this study is based on a single mouse (Data not shown).
Table 1.
Position of +1 nucleosome with respect to TSS of genes
| +1 Nucleosome position | |
|---|---|
| Silent genes | −33–113 |
| Constitutive genes | 46–192 |
| Liver-specific genes | 25–171 |
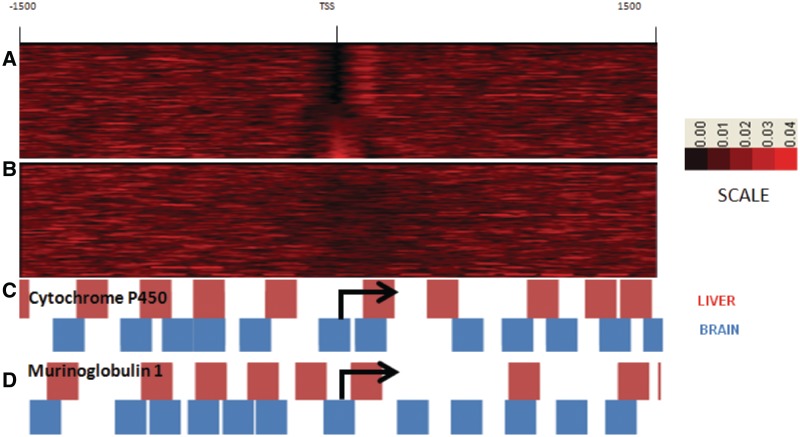
To explore this possibility further, we examined the relative positioning of the TSS and nucleosomes at the gene level. About 41% of the silenced genes had a prominent nucleosome masking the TSS (Figure 2A–B). Cytochrome P450 and Murinoglobulin 1, well-known liver-specific genes involved in detoxification serve as typical examples. As shown in Figure 2C and D, the TSS of these genes is masked by a nucleosome in the brain, while it is vacated in the liver.
Figure 2.
Nucleosome occupancy at the TSS in liver-specific genes. Nucleosome occupancy at TSS of Liver-specific genes (n = 1074) in the liver (A) and brain (B). Two typical liver-specific genes Cytochrome P 450 (C) and Murinoglobulin (D) have nucleosome-free TSS in the liver, while the same positions are occupied by nucleosome in the brain.
We find that the mouse liver nucleosome occupancy profile is identical to the canonical pattern reported for yeast and the Drosophila with a nucleosome-free TSS followed by positioned strong nucleosomes downstream. Our data clearly show that the expression of the gene is not dependent on the presence of +1 nucleosome, since we detect +1 nucleosome in the constitutive and liver-specific genes as well as the silent genes (Figure 1). However Li et al. reported that in mouse liver the TSS is devoid of nucleosomes and is flanked by nucleosome depleted regions on either side suggesting that the −1, +1, +2 and +3 nucleosomes are absent in liver irrespective of the expression level of the gene (27). We hypothesized that the reason for this discrepancy between the nucleosome profiles could be the difference in stability of the nucleosomes around the TSS. Two histone variants, the H2A.Z and the H3.3 are known to destabilize nucleosomes (28) and are prone to dissociation in the absence of chemical crosslinking agents (29). H3.3 is also known to be incorporated into nucleosomes formed after replication whereas H2A.Z is known to replace H2A in +1 nucleosomes of yeast and fly. Hence, we carried out ChIP-seq of H3.3 and H2A.Z of mouse liver chromatin with and without crosslinking.
H2A.Z/H3.3 ChIP-seq
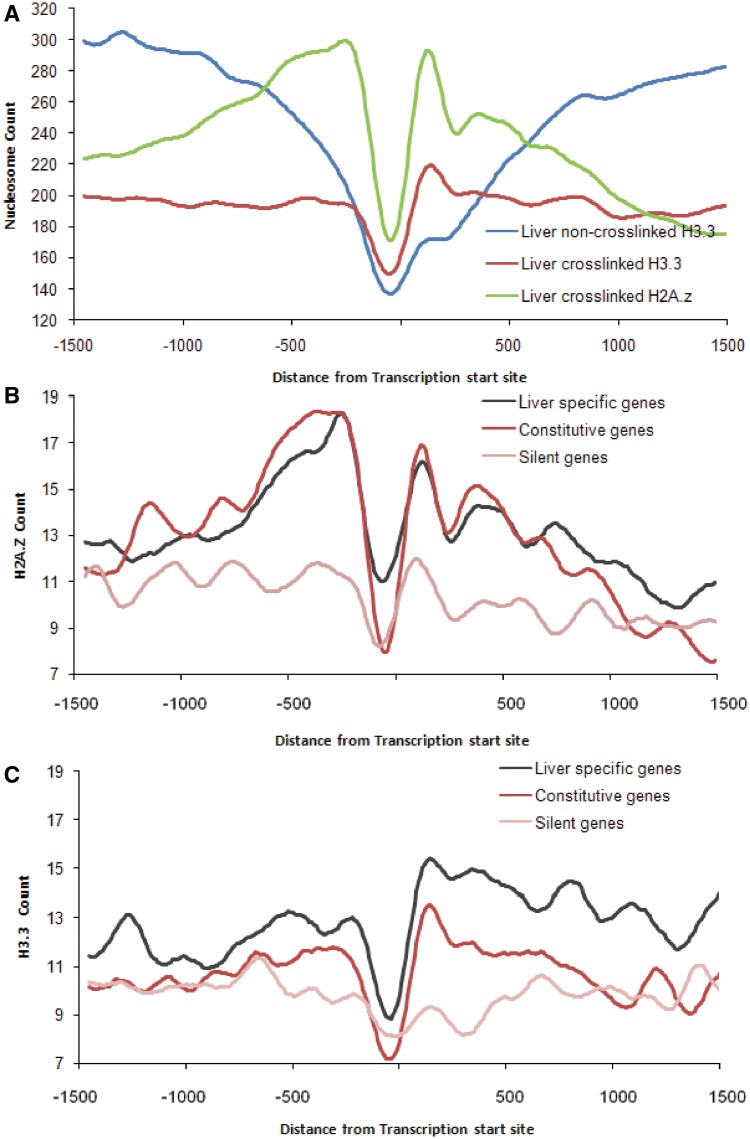
The occupancy profile of H3.3 in crosslinked liver nuclei resembled the nucleosome profile with the TSS being devoid of nucleosome and the +1 nucleosome showing a prominent peak (Figure 3A). The H2A.Z profile was remarkably different, with both −1 and +1 nucleosome being equally enriched in H2A.Z. H2A.Z abundance dropped steadily from the −1 to −4 nucleosomes. Overlapping the nucleosome profile with the H2A.Z and H3.3 profiles showed that the region immediately downstream to the TSS is occupied by nucleosomes containing both H2A.Z and H3.3. In contrast, the nucleosomes upstream to the TSS seem to selectively incorporate H2A.Z but not H3.3. We analysed the H2A.Z and H3.3 occupancy profiles for transcriptionally active and silent genes separately. Besides its incorporation in the +1 nucleosome, the transcriptionally active genes also showed strong presence of H2A.Z upstream to the TSS as compared with the silent genes (Figure 3B). Both constitutive genes and liver-specific genes showed a strongly positioned H3.3 at the +1 nucleosome which was lost in the absence of crosslinking (Figure 3C). In contrast, the silent genes lacked both the H3.3 and H2A.Z signals presenting a flat landscape of H2A.Z/H3.3 occupancy at the TSS (Figure 3B and C). When non-crosslinked chromatin from mouse liver was used, the +1 nucleosome containing H3.3 could not be recovered (Figure 3A). These results strongly suggest that nucleosomes flanking the TSS can provide a landscape of varying accessibility by incorporating histone variants that influence nucleosome fragility.
Figure 3.
ChIP-seq signal for H2A.Z and H3.3 around TSS of Refseq genes. (A) The crosslinked ChIP-seq counts around the TSS of all Refseq genes (n = 19 815) were plotted for three separate ChIP-seq experiments, namely; H2A.Z from crosslinked chromatin, H3.3 from crosslinked and non-crosslinked chromatin. The ChIP-seq counts around the TSS for H2A.Z (B) and H3.3 (C) in liver specific (black), constitutive (red) and silent (pink) genes.
Proximity of H2A.Z to TSS correlates with gene expression level
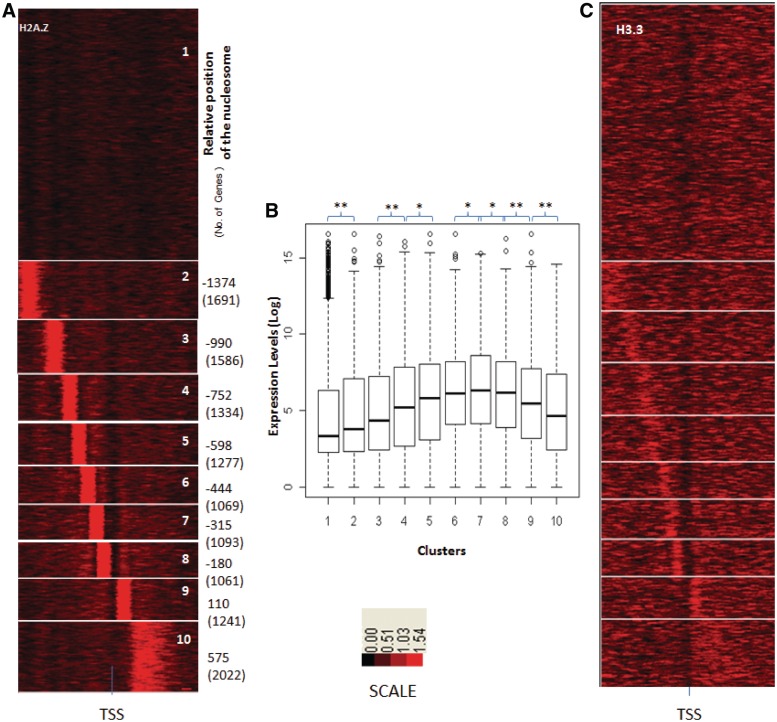
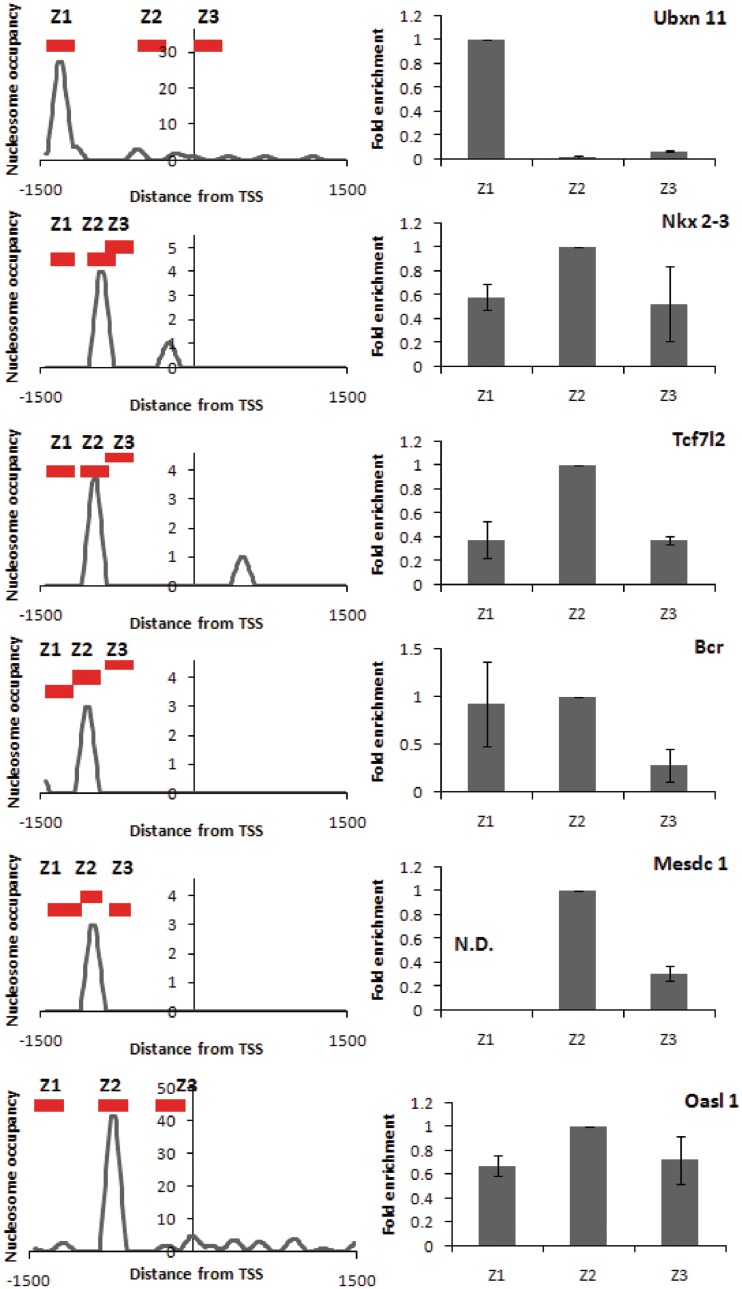
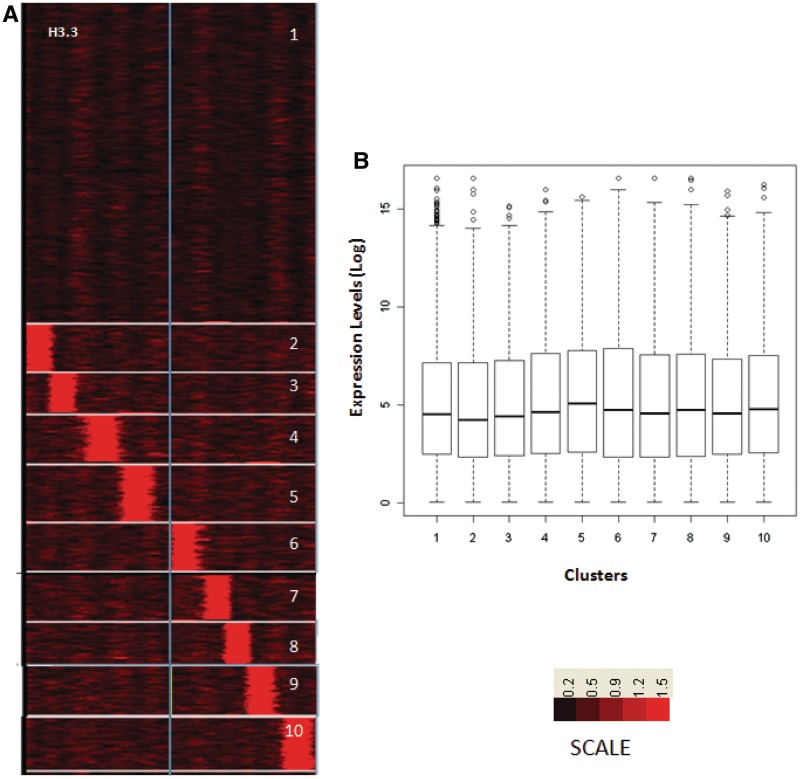
The composite H2A.Z and H3.3 profiles shown in Figure 3A, for all genes cannot provide information about the organization of these variants at individual gene promoters. For instance it suggests that H2A.Z is most abundant at the −1 position and gradually decreases further upstream. However, it does not differentiate between each gene having a single prominent H2A.Z nucleosome at different positions, or most genes having H2A.Z at multiple positions. We clustered genes according to their H3.3 and H2A.Z occupancy to identify genes with strong positioning of the variants in nucleosomes flanking the TSS. We found distinct groups of genes with one H2A.Z variant containing nucleosome each at different positions in the promoter region. The vast majority of genes had a single H2A.Z containing nucleosome in their promoter. We found a striking ordered arrangement of H2A.Z, in clusters of genes (Figure 4A). Genes with multiple TSS within the analysed region were excluded from further analysis. Barring such genes, the nucleosome with the variant histone was detected at different positions relative to TSS in different clusters. We hypothesized that the relative position of the inherently unstable nucleosome containing the histone variant maybe correlated to the expression levels of the genes, since the abundance of H2A.Z was steadily decreasing upstream (Figure 3). In agreement with our hypothesis, we found that gene clusters with H2A.Z containing nucleosome positioned farther away from the TSS had relatively less expression, over seven distinct positions. Thus, the proximity of the TSS to a single, prominent nucleosome containing the H2A.Z variant was directly correlated to the expression level of the gene (Figure 4). We validated the presence of H2A.Z at the −6 and −5 nucleosomes from the TSS using qPCR on independently prepared Chip samples. Using qPCR on independently prepared ChIP samples, six genes showed enrichment at the expected position compared with the flanking sites (Figure 5), ruling out the possibility that the prominent H2A.Z bands were artifacts introduced during library amplification for ChIP-seq. We next clustered genes based on the distance of H3.3 containing nucleosome from the TSS (Figure 6A). Although most genes had one prominent H3.3 containing nucleosome, these clusters did not show any relation to expression level of the genes in the cluster (Figure 6). The non-crosslinked samples showed a notably smaller footprint of the H3.3 containing nucleosome compared with the crosslinked samples, suggesting that crosslinking allows specific mapping of the ends of mononucleosomal DNA. (Supplementary Figure S4).
Figure 4.
H2A.Z positioning around TSS and expression pattern in liver. (A) Clustering of genes according to the ChIP-seq counts around the TSS for H2A.Z. Clusters were rearranged according to proximity of H2A.Z containing nucleosome to TSS of Refseq genes. (B) Log-transformed and normalized expression values of genes in each cluster, inferred from GNFatlas data for liver, was represented as box plots for each cluster. Asterisk represents corrected P-value < 0.01 and double asterisk represents corrected P-value <0.001. Same gene order was used for arranging H3.3 occupancy profiles from crosslinked H3.3 (C).
Figure 5.
qPCR validation of H2A.Z localization to TSS-distal region of selected genes. Five genes selected from cluster 2(1); 3(4) and 4(1). Left panels show Nucleosome occupancy from GeneTrack representation of Chip-seq data (see ‘Materials and Methods’ section for details). The red bars represent regions amplified by qPCR. Right panel shows fold enrichment in probed regions from q-PCR. Fold enrichment is represented relative to the most enriched region. Error bars represent standard deviations from triplicate experiments.
Figure 6.
H3.3 occupancy is not correlated to gene expression level. (A) Clustering of genes according to the ChIP-seq counts around the TSS for H3.3 occupancy profiles from crosslinked chromatin. (B) Log-transformed and normalized gene expression values in liver, inferred from GNFatlas data, is represented as box plots for each cluster from (A).
H2A.Z and H3.3 are known to interact with each other and destabilize the nucleosome (29). When analysed independently, we found the position of H2A.Z, but not H3.3 correlated to the expression level of genes. To find if the H2A.Z containing nucleosomes also contained H3.3, we plotted the H3.3 occupancy preserving the gene order in the clusters with distinct H2A.Z positions. H3.3 is indeed enriched at positions matching H2A.Z enrichment, suggesting that the H2A.Z co-localizes with H3.3 (Figure 4C) in certain nucleosomes.
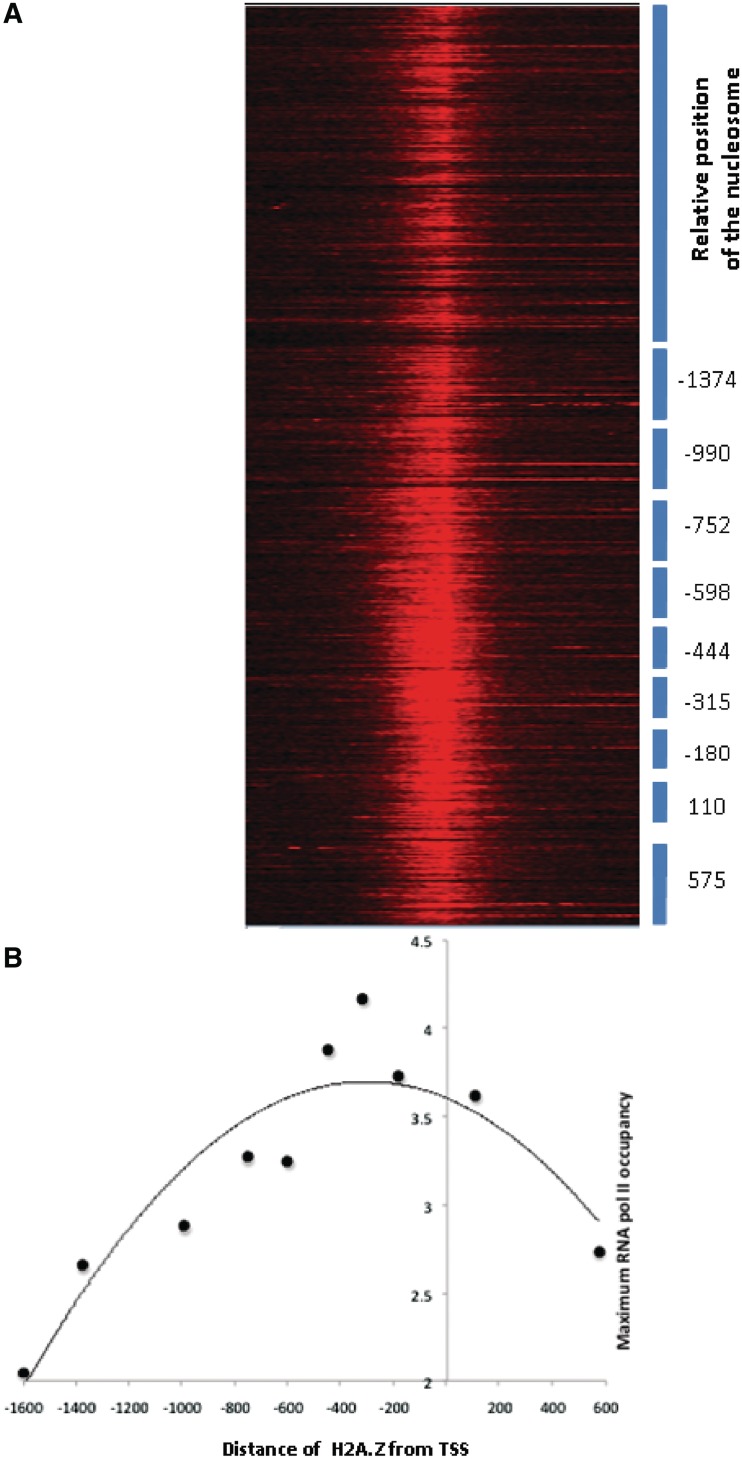
We found positive correlation between steady-state expression levels of genes and H2A.Z proximity to the TSS. However, steady-state transcript levels are dependent on RNA polymerase II activity and turnover. Therefore, we reasoned that we should find a higher RNA pol II occupancy at the TSS of genes with a proximal H2A.Z whereas genes with distal H2A.Z will show reduced occupancy. We analysed RNA pol II occupancy at the TSS of genes with proximity of H2A.Z and found a clear correlation (Figure 7A and B). The average RNA polymerase II occupancy at the TSS steadily increased in clusters with sequentially closer H2A.Z positions in the promoter. This data also served to ensure that the distal H2A.Z co-localization was not due to tissue-specific alternative TSSs.
Figure 7.
RNA polymerase II occupancy is correlated to proximity of H2A.Z. RNA polymerase II occupancy was calculated as described in ‘Materials and Methods’ section. RNA polymerase II occupancy of each gene was calculated from −1500 to +1500 flanking the TSS and used for generating the heat map (A). The blue bars represent the clusters of genes with distinct H2A.Z positioning as in Figure 4A. The maximum RNA polymerase II occupancy for each cluster was plotted against the position of centre of the H2A.Z containing nucleosome for each of the clusters (Figure 4) relative to the TSS (B).
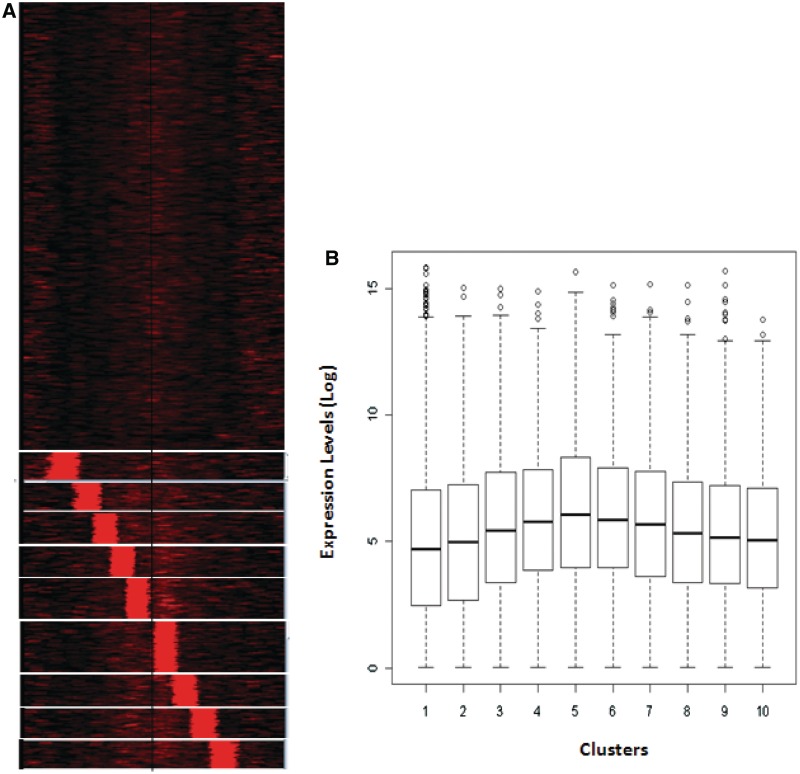
In order to explore whether this correlation between gene expression and H2A.Z positioning is also seen in other tissues, we generated H2A.Z ChIP-Seq data for the mouse brain. We clustered the H2A.Z ChIP-seq data for brain with respect to TSS of genes and compared the expression in brain. As in the liver, clusters with H2A.Z positioned farther from the TSS, show lower expression in the brain (Figure 8). Liver and Brain differ in tissue heterogeneity and in the cell types content. Since the correlation between H2A.Z position and expression level is applicable in spite of these differences, this seems to be a general mechanism of regulating gene expression levels in vivo, irrespective of the tissue.
Figure 8.
H2A.Z positioning around TSS and expression pattern in brain. (A) Clustering of genes according to the ChIP-seq counts around the TSS for H2A.Z from crosslinked chromatin. Clusters were rearranged according to proximity of H2A.Z containing nucleosome to TSS of Refseq genes. (B) Log-transformed and normalized gene expression values in brain, inferred from GNFatlas data, is represented as box plots for each cluster from (A).
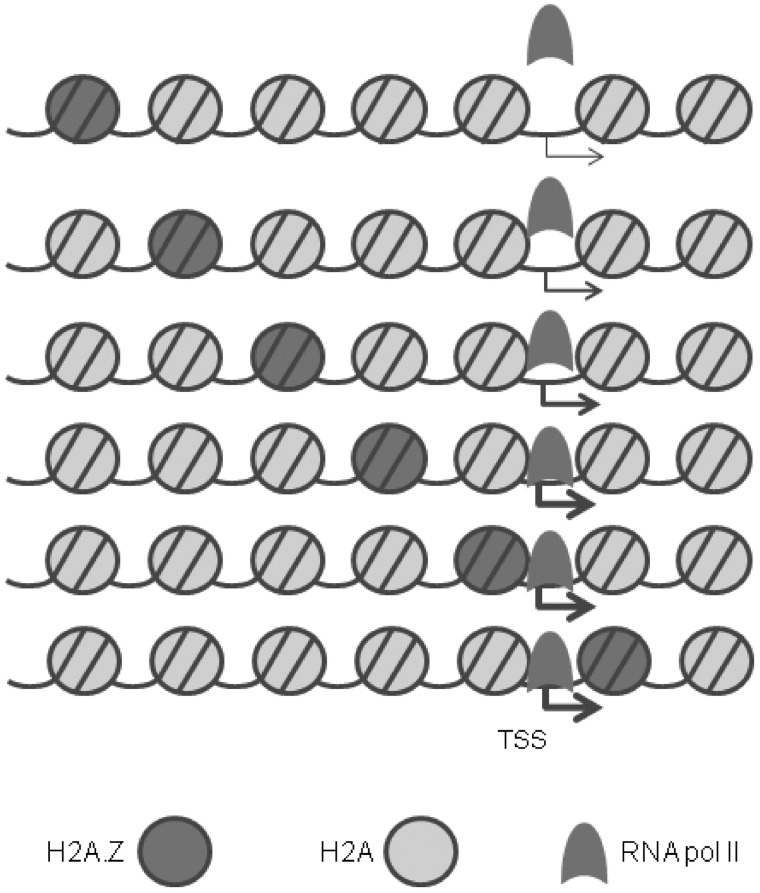
In summary, our results show that the +1 nucleosome is displaced in genes that are activated in the liver while it masks the TSS in silenced genes. Further, the +1 nucleosome consists of the H2A.Z and H3.3 variants while the region upstream of the TSS is occupied by nucleosomes containing the H2A.Z variant. The proximity of H2A.Z, but not H3.3, to the TSS was correlated to the expression level of genes. On the basis of these results, we propose a schematic model (Figure 9) relating expression level to the +1 nucleosome positioning and H2A.Z incorporation.
Figure 9.
Schematic representation of nucleosome organization and H2A.Z positioning at eukaryotic promoters in vivo. The region upstream to the TSS is occupied by spaced nucleosomes, one of which contains H2A.Z. The farther this nucleosome is from the TSS, the lesser is the expression (thickness of the arrow) and RNA pol II occupancy at the TSS. The accessibility of the TSS is also determined by the displacement of the +1 nucleosome downstream, leaving a wide nucleosome-free region at the TSS.
DISCUSSION
Schones et al. showed that the H2A.Z variant is associated with nucleosomes flanking the TSS and the eviction of the −1 nucleosome facilitates transcriptional induction of genes during T-cell activation (4). H2A.Z has also been shown to occupy nucleosomes flanking the TSS in yeast (30). Recently, it was shown that H3.3 is incorporated into the +1 nucleosomes in both active and repressed genes, but is enriched in the coding regions of active genes in ES cell culture (31). Here, by combining the ChIP-seq data for H2A.Z and H3.3 variants, we show that the −1 and +1 nucleosomes differ in the composition of histone variants.
The distance of the H2A.Z nucleosome up to 1500 bp upstream of the TSS, accounting for seven highly phased nucleosomes, was associated with a gradual reduction in gene expression level. To the best of our knowledge, this is the first study to relate in vivo expression levels and H2A.Z proximity, although the displacement of H2A.Z containing nucleosomes at −1 position has been implicated in dynamic activation of genes during T-cell activation and yeast heat shock response (4,8). We therefore reanalysed the human T-cell H2A.Z occupancy data for any relation between proximity to TSS and expression level. Although we find the same trend, we find smaller clusters, with fewer genes in each cluster. The T-cell data are based on cultured CD4+ T cells, a largely homogenous population of cells, whereas our studies were performed using liver and brain tissues (Supplementary Figure S5). The human data were collected using single-end reads whereas our data are based on paired-end reads. Moreover, our data were based on 12 732 842 (brain) and 43 054 006 (liver) reads, respectively. Thus differences in chromatin preparation including crosslinking, number of reads and cell type differences prevent a direct comparison between the human and mouse data.
We found that a nucleosome is displaced from the TSS in transcriptionally active genes, to expose the TSS whereas it masks the TSS in silent genes. The stability of the nucleosomes can strongly influence the eviction of the nucleosomes at the TSS. A difference in +1 nucleosome position is known between yeast and fly nucleosome maps, but was attributed to species-specific differences in the transcription machinery and the mechanism used for transcriptional activation (3). Schones et al. reported a rapid displacement of the −1 nucleosome during T-cell activation, but the masking of the TSS was not observed.
Our results show a distinct difference from the reported nucleosome occupancy profiles for regions surrounding the TSS in mouse liver (27). We were intrigued that the +1 nucleosome was prominently detectable in our study whereas it was not detected in the earlier report. We demonstrate that the presence of variant histones accounts for this difference. Recently, it has been reported that the fragility of some nucleosomes may account for many nucleosome-free regions reported earlier (32). It has been shown that the incorporation of H2A.Z and H3.3, into the nucleosome can result in dissociation of nucleosome in vitro, although the in vivo relevance of the instability imparted by these histone variants is not understood. In cultured cells, it has been shown that H3.3/H2A.Z double variant-containing nucleosomes mark many regions of active promoters and other regulatory regions previously reported to be nucleosome free (28). Our results show that in the absence of chemical crosslinking, the +1 nucleosome is destabilized during preparation. This also accounts for the difference in the profiles reported in Li et al. and our study. In future, it will be interesting to study the inter-individual variability in genome-wide nucleosome positioning. We found that H3.3, a variant of the H3 histone, also known as the replacement histone, due to its preferential incorporation into new nucleosomes following replication, is abundant in the nucleosome immediately following the +1 nucleosome.
Recently, human H2A.Z has been implicated in recruitment of RNA pol II during transcriptional initiation at transiently induced genes (33). On the basis of our observation that the proximity of H2A.Z to the TSS is an important determinant of steady-state expression level of genes in the mammalian liver, we propose that a single-weak H2A.Z-H3.3 containing nucleosome upstream of each gene is involved in recruitment of the RNA polymerase. The distance traversed by the RNA pol II, through a landscape of more stable nucleosomes, before changing into the elongating RNA pol II conformation could negatively impact the rate of transcriptional initiation at the TSS of the gene. Alternatively, H2A.Z may affect the recruitment of basal transcription factors in the pre-initiation complex, either by a direct interaction or by destabilizing the nucleosome, resulting in more effective activation of genes when it is localized close to the TSS.
SUPPLEMENTARY DATA
Supplementary Data are available at NAR Online: Supplementary Table 1 and Supplementary Figures 1–5.
FUNDING
Funding for open access charge: Council of Scientific and Industrial Research [NWP0036 and OLP1103].
Conflict of interest statement. None declared.
Supplementary Material
ACKNOWLEDGEMENTS
The authors acknowledge funding from Council of Scientific and Industrial Research (NWP0036; OLP1103), Rajesh Gokhale and Kausik Chakraborty for critical comments on the manuscript and Keji Zhao for sharing the human T-cell data. R.B. and A.P. acknowledge fellowships Council of Scientific and Industrial Research, India; and T.A. acknowledges fellowship from CCSTDS, Department of Science and Technology, respectively.
REFERENCES
- 1.Jiang C, Pugh BF. Nucleosome positioning and gene regulation: advances through genomics. Nat. Rev. Genet. 2009;10:161–172. doi: 10.1038/nrg2522. [DOI] [PMC free article] [PubMed] [Google Scholar]
- 2.Lantermann AB, Straub T, Stralfors A, Yuan GC, Ekwall K, Korber P. Schizosaccharomyces pombe genome-wide nucleosome mapping reveals positioning mechanisms distinct from those of Saccharomyces cerevisiae. Nat. Struct. Mol. Biol. 2010;17:251–257. doi: 10.1038/nsmb.1741. [DOI] [PubMed] [Google Scholar]
- 3.Mavrich TN, Jiang C, Ioshikhes IP, Li X, Venters BJ, Zanton SJ, Tomsho LP, Qi J, Glaser RL, Schuster SC, et al. Nucleosome organization in the Drosophila genome. Nature. 2008;453:358–362. doi: 10.1038/nature06929. [DOI] [PMC free article] [PubMed] [Google Scholar]
- 4.Schones DE, Cui K, Cuddapah S, Roh TY, Barski A, Wang Z, Wei G, Zhao K. Dynamic regulation of nucleosome positioning in the human genome. Cell. 2008;132:887–898. doi: 10.1016/j.cell.2008.02.022. [DOI] [PMC free article] [PubMed] [Google Scholar]
- 5.Spies N, Nielsen CB, Padgett RA, Burge CB. Biased chromatin signatures around polyadenylation sites and exons. Mol. Cell. 2009;36:245–254. doi: 10.1016/j.molcel.2009.10.008. [DOI] [PMC free article] [PubMed] [Google Scholar]
- 6.Valouev A, Ichikawa J, Tonthat T, Stuart J, Ranade S, Peckham H, Zeng K, Malek JA, Costa G, McKernan K, et al. A high-resolution, nucleosome position map of C. elegans reveals a lack of universal sequence-dictated positioning. Genome Res. 2008;18:1051–1063. doi: 10.1101/gr.076463.108. [DOI] [PMC free article] [PubMed] [Google Scholar]
- 7.Yuan GC, Liu YJ, Dion MF, Slack MD, Wu LF, Altschuler SJ, Rando OJ. Genome-scale identification of nucleosome positions in S. cerevisiae. Science. 2005;309:626–630. doi: 10.1126/science.1112178. [DOI] [PubMed] [Google Scholar]
- 8.Shivaswamy S, Bhinge A, Zhao Y, Jones S, Hirst M, Iyer VR. Dynamic remodeling of individual nucleosomes across a eukaryotic genome in response to transcriptional perturbation. PLoS. Biol. 2008;6:e65. doi: 10.1371/journal.pbio.0060065. [DOI] [PMC free article] [PubMed] [Google Scholar]
- 9.Khosla S, Kantheti P, Brahmachari V, Chandra HS. A male-specific nuclease-resistant chromatin fraction in the mealybug Planococcus lilacinus. Chromosoma. 1996;104:386–392. doi: 10.1007/BF00337228. [DOI] [PubMed] [Google Scholar]
- 10.Nelson JD, Denisenko O, Bomsztyk K. Protocol for the fast chromatin immunoprecipitation (ChIP) method. Nat. Protoc. 2006;1:179–185. doi: 10.1038/nprot.2006.27. [DOI] [PubMed] [Google Scholar]
- 11.Skene PJ, Illingworth RS, Webb S, Kerr AR, James KD, Turner DJ, Andrews R, Bird AP. Neuronal MeCP2 is expressed at near histone-octamer levels and globally alters the chromatin state. Mol. Cell. 2010;37:457–468. doi: 10.1016/j.molcel.2010.01.030. [DOI] [PMC free article] [PubMed] [Google Scholar]
- 12.Pfaffl MW. A new mathematical model for relative quantification in real-time RT-PCR. Nucleic Acids Res. 2001;29:e45. doi: 10.1093/nar/29.9.e45. [DOI] [PMC free article] [PubMed] [Google Scholar]
- 13.Albert I, Wachi S, Jiang C, Pugh BF. GeneTrack–a genomic data processing and visualization framework. Bioinformatics. 2008;24:1305–1306. doi: 10.1093/bioinformatics/btn119. [DOI] [PMC free article] [PubMed] [Google Scholar]
- 14.Pruitt KD, Tatusova T, Maglott DR. NCBI reference sequences (RefSeq): a curated non-redundant sequence database of genomes, transcripts and proteins. Nucleic Acids Res. 2007;35:D61–D65. doi: 10.1093/nar/gkl842. [DOI] [PMC free article] [PubMed] [Google Scholar]
- 15.Mortazavi A, Williams BA, McCue K, Schaeffer L, Wold B. Mapping and quantifying mammalian transcriptomes by RNA-Seq. Nat. Methods. 2008;5:621–628. doi: 10.1038/nmeth.1226. [DOI] [PubMed] [Google Scholar]
- 16.Karolchik D, Hinrichs AS, Furey TS, Roskin KM, Sugnet CW, Haussler D, Kent WJ. The UCSC Table Browser data retrieval tool. Nucleic Acids Res. 2004;32:D493–D496. doi: 10.1093/nar/gkh103. [DOI] [PMC free article] [PubMed] [Google Scholar]
- 17.Sun H, Wu J, Wickramasinghe P, Pal S, Gupta R, Bhattacharyya A, gosto-Perez FJ, Showe LC, Huang TH, Davuluri RV. Genome-wide mapping of RNA Pol-II promoter usage in mouse tissues by ChIP-seq. Nucleic Acids Res. 2011;39:190–201. doi: 10.1093/nar/gkq775. [DOI] [PMC free article] [PubMed] [Google Scholar]
- 18.Barski A, Cuddapah S, Cui K, Roh TY, Schones DE, Wang Z, Wei G, Chepelev I, Zhao K. High-resolution profiling of histone methylations in the human genome. Cell. 2007;129:823–837. doi: 10.1016/j.cell.2007.05.009. [DOI] [PubMed] [Google Scholar]
- 19.Su AI, Wiltshire T, Batalov S, Lapp H, Ching KA, Block D, Zhang J, Soden R, Hayakawa M, Kreiman G, et al. A gene atlas of the mouse and human protein-encoding transcriptomes. Proc. Natl Acad. Sci. USA. 2004;101:6062–6067. doi: 10.1073/pnas.0400782101. [DOI] [PMC free article] [PubMed] [Google Scholar]
- 20.de Hoon MJ, Imoto S, Nolan J, Miyano S. Open source clustering software. Bioinformatics. 2004;20:1453–1454. doi: 10.1093/bioinformatics/bth078. [DOI] [PubMed] [Google Scholar]
- 21.Saldanha AJ. Java Treeview–extensible visualization of microarray data. Bioinformatics. 2004;20:3246–3248. doi: 10.1093/bioinformatics/bth349. [DOI] [PubMed] [Google Scholar]
- 22.Mavrich TN, Ioshikhes IP, Venters BJ, Jiang C, Tomsho LP, Qi J, Schuster SC, Albert I, Pugh BF. A barrier nucleosome model for statistical positioning of nucleosomes throughout the yeast genome. Genome Res. 2008;18:1073–1083. doi: 10.1101/gr.078261.108. [DOI] [PMC free article] [PubMed] [Google Scholar]
- 23.Widlund HR, Cao H, Simonsson S, Magnusson E, Simonsson T, Nielsen PE, Kahn JD, Crothers DM, Kubista M. Identification and characterization of genomic nucleosome-positioning sequences. J. Mol. Biol. 1997;267:807–817. doi: 10.1006/jmbi.1997.0916. [DOI] [PubMed] [Google Scholar]
- 24.Zhang XY, Horz W. Nucleosomes are positioned on mouse satellite DNA in multiple highly specific frames that are correlated with a diverged subrepeat of nine base-pairs. J. Mol. Biol. 1984;176:105–129. doi: 10.1016/0022-2836(84)90384-x. [DOI] [PubMed] [Google Scholar]
- 25.Hurst JL, Robertson DHL, Tolladay U, Beynon RJ. Proteins in urine scent marks of male house mice extend the longevity of olfactory signals. Anim. Behav. 1998;55:1289–1297. doi: 10.1006/anbe.1997.0650. [DOI] [PubMed] [Google Scholar]
- 26.Shahan K, Denaro M, Gilmartin M, Shi Y, Derman E. Expression of six mouse major urinary protein genes in the mammary, parotid, sublingual, submaxillary, and lachrymal glands and in the liver. Mol. Cell. Biol. 1987;7:1947–1954. doi: 10.1128/mcb.7.5.1947. [DOI] [PMC free article] [PubMed] [Google Scholar]
- 27.Li Z, Schug J, Tuteja G, White P, Kaestner KH. The nucleosome map of the mammalian liver. Nat. Struct. Mol. Biol. 2011;18:742–746. doi: 10.1038/nsmb.2060. [DOI] [PMC free article] [PubMed] [Google Scholar]
- 28.Jin C, Zang C, Wei G, Cui K, Peng W, Zhao K, Felsenfeld G. H3.3/H2A.Z double variant-containing nucleosomes mark ‘nucleosome-free regions’ of active promoters and other regulatory regions. Nat. Genet. 2009;41:941–945. doi: 10.1038/ng.409. [DOI] [PMC free article] [PubMed] [Google Scholar]
- 29.Jin C, Felsenfeld G. Nucleosome stability mediated by histone variants H3.3 and H2A.Z. Genes Dev. 2007;21:1519–1529. doi: 10.1101/gad.1547707. [DOI] [PMC free article] [PubMed] [Google Scholar]
- 30.Raisner RM, Hartley PD, Meneghini MD, Bao MZ, Liu CL, Schreiber SL, Rando OJ, Madhani HD. Histone variant H2A.Z marks the 5′ ends of both active and inactive genes in euchromatin. Cell. 2005;123:233–248. doi: 10.1016/j.cell.2005.10.002. [DOI] [PMC free article] [PubMed] [Google Scholar]
- 31.Goldberg AD, Banaszynski LA, Noh KM, Lewis PW, Elsaesser SJ, Stadler S, Dewell S, Law M, Guo X, Li X, et al. Distinct factors control histone variant H3.3 localization at specific genomic regions. Cell. 2010;140:678–691. doi: 10.1016/j.cell.2010.01.003. [DOI] [PMC free article] [PubMed] [Google Scholar]
- 32.Xi Y, Yao J, Chen R, Li W, He X. Nucleosome fragility reveals novel functional states of chromatin and poises genes for activation. Genome Res. 2011;21:718–724. doi: 10.1101/gr.117101.110. [DOI] [PMC free article] [PubMed] [Google Scholar]
- 33.Hardy S, Jacques PE, Gevry N, Forest A, Fortin ME, Laflamme L, Gaudreau L, Robert F. The euchromatic and heterochromatic landscapes are shaped by antagonizing effects of transcription on H2A.Z deposition. PLoS Genet. 2009;5:e1000687. doi: 10.1371/journal.pgen.1000687. [DOI] [PMC free article] [PubMed] [Google Scholar]
Associated Data
This section collects any data citations, data availability statements, or supplementary materials included in this article.


