


Abstract
The Mmr multidrug efflux pump recognizes and actively extrudes a broad range of antimicrobial agents, and promotes the intrinsic resistance to these antimicrobials in Mycobacterium tuberculosis. The expression of Mmr is controlled by the TetR-like transcriptional regulator Rv3066, whose open reading frame is located downstream of the mmr operon. To understand the structural basis of Rv3066 regulation, we have determined the crystal structures of Rv3066, both in the absence and presence of bound ethidium, revealing an asymmetric homodimeric two-domain molecule with an entirely helical architecture. The structures underscore the flexibility and plasticity of the regulator essential for multidrug recognition. Comparison of the apo-Rv3066 and Rv3066–ethidium crystal structures suggests that the conformational changes leading to drug-mediated derepression is primarily due to a rigid body rotational motion within the dimer interface of the regulator. The Rv3066 regulator creates a multidrug-binding pocket, which contains five aromatic residues. The bound ethidium is found buried within the multidrug-binding site, where extensive aromatic stacking interactions seemingly govern the binding. In vitro studies reveal that the dimeric Rv3066 regulator binds to a 14-bp palindromic inverted repeat sequence in the nanomolar range. These findings provide new insight into the mechanisms of ligand binding and Rv3066 regulation.
INTRODUCTION
Tuberculosis (TB) is one of the most deadly diseases and was responsible for the death of 1.7 million people in 2009 (1) (http://www.who.int/mediacentre/factsheets/fs104/en/index.html). This disease is caused by the bacterium Mycobacterium tuberculosis, which infects an estimated 9 million people each year. TB is very difficult to treat, requiring at least 6 months of a combination of medications. The treatment must continue even long after the symptoms disappear. However, M. tuberculosis has developed resistance to commonly used anti-TB agents, such as isoniazid and rifampicin. The development of these drug-resistant strains is mainly due to the mismatch between treatment and symptoms, such as the irregular intake of drugs throughout the course of treatment and inappropriate prescription of medications (2). TB caused by multidrug-resistant (MDR) (3,4), extensively drug-resistant (XDR) (2,5) and most recently totally drug-resistant (TDR) (6) strains of M. tuberculosis have emerged and spread globally. Based on our current knowledge, TDR-TB is untreatable. The World Health Organization has predicted that there will be 2 million MDR or XDR cases worldwide by 2012. It is obvious that the emergence of these drug-resistant TB strains has evolved into a major threat and challenges our global prospects for TB control. Thus, knowledge of the molecular mechanisms underlying drug resistance in M. tuberculosis is essential for the development of new strategies to combat this disease.
Recent evidence suggests that MDR strains of M. tuberculosis are associated with constitutive or inducible expression of multidrug efflux pumps (7). These pumps have been classified into five different families: the ATP-binding cassette (ABC), resistance nodulation division (RND), multidrug and toxic compound extrusion (MATE), major facilitator (MF) and small multidrug resistance (SMR) families (8). It has been found that the genome of M. tuberculosis contains genes encoding efflux pumps from all these families (9,10). In addition, several of these MDR efflux pumps have been identified and characterized (9). One such pump is the Mmr (Rv3065) multidrug efflux pump, which belongs to the SMR family (11). Mmr has been shown to mediate resistance to several toxic compounds, including acriflavine, ethidium bromide, erythromycin, pyronin Y, safranin O, tetraphenylphosphonium and thioridazine (11,12).
Elucidating the regulatory systems of multidrug efflux pumps in M. tuberculosis should allow us to understand how this bacterium contributes to multidrug resistance and how it adapts to environmental changes. At present, little is known about the regulatory mechanisms modulating the expression of mmr in M. tuberculosis. Here, we report the crystal structures of the Rv3066 efflux regulator both in the absence and presence of bound ethidium, suggesting that ethidium binding triggers a rotational motion of the regulator. This motion results in inducing the expression of the Mmr efflux pump by releasing the Rv3066 regulator from its cognate DNA at the promoter region. The rv3066 gene is located immediately downstream of mmr and encodes a 202 amino acid protein that shares sequence homology to members of the TetR family of regulators (13,14). Our data indicate that Rv3066 is a TetR-family regulator (15), which represses the transcription of mmr by directly binding to the inverted repeat (IR) of the promoter.
MATERIALS AND METHODS
Cloning of rv3066
The rv3066 ORF from genomic DNA of M. tuberculosis strain H37Rv was amplified by polymerase chain reaction (PCR) using the primers 5′-CCATGGCAACCGCAGGCTCCGACC-3′ and 5′-GGATCCTCAATGGTGATGATGATGATGGTCGGGGGTTCGTCCCGCAT-3′ to generate a product that encodes a Rv3066 recombinant protein with a 6xHis tag at the C-terminus. The corresponding PCR product was digested with NcoI and BamHI, extracted from the agarose gel and inserted into pET15b as described by the manufacturer (Merck KGaA, Darmstadt, Germany). The recombinant plasmid (pET15bΩrv3066) was transformed into DH5α cells and the transformants were selected on LB agar plates containing 100 µg/ml ampicillin. The presence of the correct rv3066 sequence in the plasmid construct was verified by DNA sequencing.
Expression and purification of Rv3066
Briefly, the full-length Rv3066 protein containing a 6xHis tag at the C-terminus was overproduced in Escherichia coli BL21(DE3) cells possessing pET15bΩrv3066. Cells were grown in 4 l of Luria Broth (LB) medium with 100 µg/ml ampicillin at 37°C. When the OD600 reached 0.5, the culture was treated with 1 mM isopropyl-β-d-thiogalactopyranoside (IPTG) to induce Rv3066 expression, and cells were harvested within 3 h. The collected bacterial cells were suspended in 100 ml ice-cold buffer containing 20 mM Na-HEPES (pH 7.2) and 200 mM NaCl, 10 mM MgCl2 and 0.2 mg DNase I (Sigma-Aldrich). The cells were then lysed with a French pressure cell. Cell debris was removed by centrifugation for 45 min at 4°C and 20 000 rev/min. The crude lysate was filtered through a 0.2 µm membrane and was loaded onto a 5 ml Hi-Trap Ni2+-chelating column (GE Healthcare Biosciences, Pittsburgh, PA, USA) pre-equilibrated with 20 mM Na–HEPES (pH 7.2) and 200 mM NaCl. To remove unbound proteins and impurities, the column was first washed with six column volumes of buffer containing 50 mM imidazole, 250 mM NaCl and 20 mM Na–HEPES (pH 7.2). The Rv3066 protein was then eluted with four column volumes of buffer containing 300 mM imidazole, 250 mM NaCl and 20 mM Na–HEPES (pH 7.2). The purity of the protein was judged using 12.5% sodium dodecyl sulfate–polyacrylamide gel electrophoresis stained with Coomassie Brilliant Blue. The purified protein was extensively dialyzed against buffer containing 100 mM imidazole, 250 mM NaCl and 20 mM Na–HEPES (pH 7.5) and concentrated to 20 mg/ml.
For 6xHis selenomethionyl-substituted (SeMet)-Rv3066 protein expression, a 2 ml LB broth overnight culture containing E. coli BL21(DE3)/pET15bΩrv3066 cells was transferred into 40 ml of LB broth containing 100 µg/ml ampicillin and grown at 37°C. When the OD600 value reached 1.2, cells were harvested by centrifugation at 6000 rev/min for 10 min, and then washed two times with 20 ml of M9 minimal salts solution. The cells were re-suspended in 40 ml of M9 media and then transferred into a 4 l pre-warmed M9 solution containing 100 µg/ml ampicillin. The cell culture was incubated at 37°C with shaking. When the OD600 reached 0.4, 100 mg/l of lysine, phenylalanine and threonine, 50 mg/l isoleucine, leucine and valine, and 60 mg/l of l-selenomethionine were added. The protein expression was induced with 1 mM IPTG after 15 min. Cells were then harvested within 3 h after induction. The procedures for purifying the 6xHis SeMet-Rv3066 were identical to those of the native protein.
Crystallization of Rv3066
All crystals of the 6xHis Rv3066 regulator were obtained using hanging-drop vapor diffusion. The Form I SeMet-Rv3066 crystals were grown at room temperature in 24-well plates with the following procedures. A 2 µl protein solution containing 20 mg/ml SeMet-Rv3066 protein in 20 mM Na–HEPES (pH 7.5), 250 mM NaCl and 100 mM imidazole was mixed with a 2 µl of reservoir solution containing 24% polyethylene glycol (PEG) 4000, 0.1 M Na-acetate (pH 5.0) and 0.2 M MgCl2. The resultant mixture was equilibrated against 500 µl of the reservoir solution. Crystals of Form I grew to a full size in the drops within 2 weeks. Typically, the dimensions of the crystals were 0.2 mm× 0.05 mm× 0.05 mm. Cryoprotection was achieved by raising the PEG 4000 concentration stepwise to 30% with a 3% increment in each step.
The Form II crystals of Rv3066 were prepared using similar procedures. The reservoir solution for the Form II crystals consists of 24% PEG 4000, 0.1 M Na–HEPES (pH 8.0) and 0.2 M MgCl2. Crystals of this form grew to a full size in the drops within 2 weeks. The dimensions of the mature crystals were 0.1 mm× 0.1 mm× 0.1 mm. Cryoprotection was achieved by raising the PEG 4000 concentration stepwise to 30% with a 3% increment in each step.
The Rv3066–ethidium complex crystals were prepared by incubating the Form II crystals of apo-Rv3066 in solution containing 24% PEG 4000, 0.1 M Na–HEPES (pH 8.0), 0.2 M MgCl2 and 0.5 mM ethidium bromide for 48 h at 25°C. Cryoprotection was achieved by raising the PEG 4000 concentration stepwise to 30% with a 3% increment in each step.
Data collection, structural determination and refinement
All diffraction data were collected at 100 K at beamline 24ID-E located at the Advanced Photon Source, using an ADSC Quantum 315 CCD-based detector. Diffraction data were processed using DENZO and scaled using SCALEPACK (16). The crystals of Form I belong to space group P21212 (Table 1). Based on the molecular weight of Rv3066 (22.78 kDa), a single dimer per asymmetric unit with a solvent content of 36.1% is expected. Two selenium sites were identified using SHELXC and SHELXD (17) as implemented in the HKL2MAP package (18). Single-wavelength anomalous dispersion (SAD) phasing using the program PHASER (19) was employed to obtain experimental phases in addition to phases from the structural model of the EbrR regulator (residues 83–176) (PDB code: 3hta). The resulting phases were then subjected to density modification and NCS averaging using the program PARROT (20). The phases were of excellent quality and allowed for tracing of most of the molecule in PHENIX AutoBuild (21), which led to an initial model containing 72% amino acid residues and 54% of which contained side chains. The remaining part of the model was manually constructed using the program Coot (22). Then, the model was refined using translation/libration/screw (TLS) refinement techniques adopting a single TLS body as implemented in PHENIX (21) leaving 5% of reflections in Free-R set. Iterations of refinement using PHENIX (21) and CNS (23) and model building in Coot (22) lead to the current model, which consists of 173 residues (residues 12–184) with excellent geometrical characteristics (Table 1).
Table 1.
Data collection, phasing and structural refinement statistics
| Form I | Form II | Rv3066–ethidium | |
|---|---|---|---|
| Data Collection | |||
| Wavelength (Å) | 0.978 | 0.978 | 0.978 |
| Space group | P21212 | P21212 | P3121 |
| Cell constants (Å) | a = 78.7, b = 118.9, c = 42.1 | a = 91.4, b = 119.9, c = 30.9 | a = 99.1, b = 99.1, c = 66.5 |
| Resolution (Å) | 2.32 (40.00–2.32) | 1.83 (40.00–1.83) | 2.30 (40.0–2.30) |
| Completeness (%) | 99.9 (99.9) | 96.0 (98.4) | 100.0 (99.6) |
| Total no. of reflections | 556 100 | 524 555 | 670 642 |
| No. of unique reflections | 17 973 | 31 246 | 17 079 |
| Redundancy | 2.4 (2.5) | 2.7 (2.9) | 3.1 (3.2) |
| Rmerge (%) | 36.4 (7.7) | 39.8 (4.9) | 36.4 (5.7) |
| (I/σ(I)) | 2.17 (11.65) | 2.08 (23.47) | 2.94 (26.33) |
| Phasing | |||
| Selenium atom sites | 2 | ||
| Resolution range of data used (Å) | 40.00–2.32 | ||
| Figure of merit (acentric/centric) | 56.1/42.4 | ||
| Refinement | |||
| Rwork (%) | 20.28 | 20.40 | 20.59 |
| Rfree (%) | 27.06 | 24.71 | 26.16 |
| B-factors | |||
| Overall (Å2) | 38.5 | 24.6 | 48.0 |
| Protein chain A/B (Å2) | 39.0/36.9 | 25.8/23.3 | 45.8/50.3 |
| Ligand chain A/B (Å2) | – | – | 37.0/36.6 |
| Water (Å) | 39.2 | 29.3 | 41.1 |
| No. of atoms in protein chain A/B | 1329/1329 | 1321/1321 | 1322/1329 |
| No. of ligands | 0 | 0 | 2 |
| No. of waters | 77 | 67 | 64 |
| Rms deviations | |||
| Bond angles (°) | 1.1 | 0.9 | 1.0 |
| Bond length (Å) | 0.008 | 0.007 | 0.008 |
| Ramachandran analysis | |||
| Most favored regions (%) | 94.9 | 94.3 | 94.2 |
| Allowed regions (%) | 5.1 | 5.7 | 5.8 |
| Generously allowed regions (%) | 0.0 | 0.0 | 0.0 |
| Disallowed regions (%) | 0.0 | 0.0 | 0.0 |
The Form II and Rv3066–ethidium crystals took the space groups P21212 and P3121, respectively. These two structures were phased using the molecular replacement (MR) program PHASER (19) by using the Form I structure as the search model. Structural refinements were then performed using PHENIX (21) and CNS (23) (Table 1).
Electrophoretic mobility shift assay
To determine the binding of Rv3066 to the operator region of mmr, electrophoretic mobility shift assay (EMSA) was performed according to the procedure described by Alekshun et al. (24). The 30-bp oligonucleotide, 5′-CGAGCCTCCTTTGTGTACATTTGTACATGT-3′, containing the hypothetical operator site IR1 was labeled at the 3′-end with digoxigenin-11-ddUTP (DIG-11-ddUTP) using the DIG Gel Shift Kit (Roche Applied Science, Indianapolis, IN, USA). A random 30-bp internal rv3066 fragment was used as the control DNA for the gel shift assay. This control DNA fragment was also labeled with DIG-11-ddUTP. The DIG-11-ddUTP-labeled DNA fragments (0.02 µM) were incubated with the purified Rv3066 protein at concentrations ranging from 0.04 to 0.64 µM in binding buffer composed of 20 mM HEPES, pH 7.6, 1 mM EDTA, 10 mM (NH4)2SO4, 5 mM dithiothreitol, 0.2% Tween 20 (wt/vol), 30 mM KCl and 0.5 µg of Poly [d(I-C)] as a non-specific competitor. The reaction mixtures were incubated at room temperature for 30 min and then subjected to electrophoresis on a 7.5% (wt/vol) non-denaturing polyacrylamide gel at 150 V for 30 min. The DNA complexes in the gel were transferred to a nylon membrane with a vacuum blotter. The DIG-labeled DNA was detected and visualized using antidigoxigenin antibody and the chemiluminescent substrate CDP-star (Roche Applied Science). For the competition experiments, different amounts (5- and 125-fold molar excesses) of either unlabeled 30-bp DNA or unlabeled internal random DNA were added as competitors during the binding step. The ligand-binding assays were done by incubating different concentrations of ethidium bromide (6.4, 64, 320, 640 and 1280 µM) with the purified Rv3066 protein for 30 min before adding the labeled double-stranded DNA (dsDNA) fragments for the experiments.
Dye primer based DNase I footprint assay
The DNase I footprint assay was performed as described by Zianni et al. (25). A 226-bp fragment that encompasses bases −153 to +87, including IR1 (with the sequence of IR2 removed), of the promoter region of mmr was generated by PCR and cloned into the pGEM-Teasy vector. The fluorescently labeled probe was amplified using the primers 6FAM-Mmr-F (5′-/6FAM/tcgagatctttcaccatg-3′) and HEX-Mmr-R (5′-/HEX/caaccgagtgaacccttc-3′). An amount of 0.6 pmol of the gel purified fluorescently labeled probe was incubated with various amounts of the dimeric Rv3066 protein (0, 1.5 and 3.0 pmol) for 30 min at room temperature in a binding buffer containing 20 mM HEPES, pH 7.6, 10 mM (NH4)2SO4, 5 mM dithiothreitol, 0.2% Tween 20 (wt/vol), 30 mM KCl and 0.5 µg of Poly [d(I-C)]. Bovine serum albumin (BSA) was used for the control experiment. After incubation, 10 mM MgCl2 and 5 mM CaCl2 were added to the reaction mixture to a final volume of 50 µl. Then, 0.0025 U of DNase I (Worthington Biochemicals, Lakewood, NJ, USA) was added and incubated for 5 min at room temperature. The reaction was stopped by adding 0.25 M EDTA and extracted with phenol:chloroform:isoamylalcohol (25:24:1). Control digestions with the probe were performed in the absence of Rv3066. The digested DNA fragments were purified with the QIAqick PCR Purification kit (Qiagen, Valencia, CA, USA) and eluted in 20 µl distilled water. After, 4 µl of the purified DNA was mixed with 5.98 µl HiDi formamide (Applied Biosystems, Foster City, CA, USA) and 0.02 µl GeneScan-500 LIZ size standards (Applied Biosystems). The samples were analyzed with the 3730 DNA analyzer coupled by G5 dye set, using an altered default genotyping module that increased the injection time to 30 s and the injection voltage to 3 kV.
The 226-bp fragment was sequenced with the primers 6FAM-Mmr-F and HEX-Mmr-R, respectively, using the Thermo Sequenase Dye Primer Manual Cycle Sequencing Kit (USB, Inc., Cleveland, OH, USA) according to the manufacturer’s instructions. Each reaction was diluted 5-fold in water, and 4 µl was added to 5.98 µl HiDi formamide and 0.02 µl GeneScan-500LIZ size standard. The samples were analyzed using the 3730 DNA analyzer as described above. Electropherograms were analyzed and aligned using the GENEMAPPER software (version 4.0, Applied Biosystems).
Cloning of the M. tuberculosis mmr-rv3066 operon into Mycobacterium smegmatis
Primer pairs (FP: CGCGGATCCATCTTTCACCATGACACGAC, RP: CCCAAGCTTAGGACTGGTATTCGGCGGTT) with added BamHI and HindIII sites were used to amplify the complete mmr-rv3066 operon (including the promoter region) from M. tuberculosis H37Rv genomic DNA. The amplified fragment was digested and ligated into E. coli–Mycobacterium shuttle vector pMV261 (kindly provided by Susan T. Howard, The University of Texas Health Science Center) to construct pMMR. pMV261 is a shuttle plasmid commonly used for cloning and expression of genes in mycobacteria. The cloned mmr-rv3066 operon carried its own promoter sequence. Although there should be constitutive base-level expression from the vector, mmr is inducible due to the binding of drug by the regulator. The constructed pMMR in E. coli DH5α was then purified and electroporated into M. smegmatis mc2155 (ATCC700084) (26).
Real-time quantitative reverse transcriptase–PCR analysis of mmr induction
Mycobacterium smegmatis mc2155 strain containing pMMR was inoculated into 30 ml of antibiotic-free 7H9 broth. The culture was incubated for overnight to the mid logarithmic phase (OD600 ≈ 0.6) at 37°C. The culture was divided into four aliquots. One aliquot was used as the non-treated control, while the other three were added with thioridazine (80 μg/ml), erythromycin (128 μg/ml) and ethidium bromide (10 μg/ml), respectively. The cultures were further incubated for 1 h at 37°C. Total bacteria RNA was isolated from the three individual cultures by the Trizol method (27). RNA was further purified by Qiagen RNeasy Column (Qiagen) and treated with the Turbo DNA-free Kit (Life Technologies, Grand Island, NY, USA) to eliminate DNA contamination in each preparation. Before being used for quantitative reverse transcriptase–PCR (qRT–PCR), each RNA template and each primer set were tested with a conventional one-step RT–PCR kit and a regular PCR kit (Life Technologies) to ensure specific amplification from the target mRNA and no detectable DNA contamination in the RNA preparation. Primer pairs 3065F (5′-CCTATACCTCTTGTGCGCGAT-3′) and 3065R (5′-CGAAAGCGATGCCATAACCC-3′), specific for the mmr gene were designed for qRT–PCR analyses, which were conducted using the iScript one-step RT–PCR kit with SYBR green (Bio-Rad, Hercules, CA, USA) along with the MyiQ iCycler real-time PCR detection system (Bio-Rad). Triplicate reactions in a volume of 15 μl were performed for each dilution of the RNA template. Thermal cycling conditions were as follows: 10 min at 50°C, 5 min at 60°C followed by 5 min at 95°C and then 40 cycles of 10 s at 95°C and 30 s at 56°C. Melt-curve analysis was performed immediately following each amplification. Samples between treatments were normalized using the aph gene which was located on the pMV261 vector as an internal standard. Cycle threshold values were determined with the MyiQ software (Bio-Rad). The relative changes (n-fold) in mmr transcription between the antibiotic treated and nontreated samples were calculated using 2-ΔΔCT method as described by Livak and Schmitten (28).
Site-directed mutagenesis
Site-directed point mutations on residues that are expected to be critical for the binding of drugs were performed to generate single point mutants, W80A, Y101A, N112A, Y115A, W131A and D156A, and a double-point mutant W80A–W131A. The primers used for these mutations are listed in Table 2. All oligonucleotides were purchased from (Integrated DNA Technologies, Inc., Coralville, IA, USA) in a salt-free grade.
Table 2.
Primers for site-directed mutagenesis
| Primer | Sequence |
|---|---|
| W131A-forward | 5′-GTCTGGCTCGTCTGGCGCCGGATGGTCTGC-3′ |
| W131A-reverse | 5′-GCAGACCATCCGGCGCCAGACGAGCCAGAC-3′ |
| S73A-forward | 5′-CATGCCGCAAATGCAGCCGCAGAT-3′ |
| S73A-reverse | 5′-ATCTGCGGCTGCATTTGCGGCATG-3′ |
| T159A-forward | 5′-GTTTTTCGACGGCGCCGCGCTGCACGCACTG-3′ |
| T159A-reverse | 5′-CAGTGCGTGCAGCGCGGCGCCGTCGAAAAAC-3′ |
| Y101A-forward | 5′-CGTCTGACCACGGTCGCACTGGCAGATCAGGAC-3′ |
| Y101A-reverse | 5′-GTCCTGATCTGCCAGTGCGACCGTGGTCAGACG-3′ |
| Y115A-forward | 5′-CACCCTGAACGAACTGGCAATGGCGGCCGCACATC-3′ |
| Y115A-reverse | 5′-GATGTGCGGCCGCCATTGCCAGTTCGTTCAGGGTG-3′ |
| W80A-forward | 5′-CTGCTGGCCCAGGCGCGTTCTGATCTG-3′ |
| W80A-reverse | 5′-CAGATCAGAACGCGCCTGGGCCAGCAG-3′ |
| D156A-forward | 5′-GTCACCGTGTTTTTCGCAGGCGCCACGCTGCAC-3′ |
| D156A-reverse | 5′-GTGCAGCGTGGCGCCTGCGAAAAACACGGTGAC-3′ |
| N112A-forward | 5′-CGTTACCGCACCCTGGCAGAACTGTATATGGC-3′ |
| N112A-reverse | 5′-GCCATATACAGTTCTGCCAGGGTGCGGTAACG-3′ |
Fluorescence polarization assay for the DNA-binding affinity
Fluorescence polarization assays were used to determine the DNA-binding affinity of the Rv3066 regulator. Both the 30-bp oligodeoxynucleotide- and fluorescein-labeled oligodeoxynucleotide were purchased from Integrated DNA Technologies, Inc. These oligodeoxynucleotides contain the predicted 14-bp IR1 site for Rv3066 binding. Their sequences were 5′-CGAGCCTCCTTTGTGTACATTTGTACATGT-3′ and 5′-F-ACATGTACAAATGTACACAAAGGAGGCTCG-3′, where F denotes the fluorescein which was covalently attached to the 5′-end of the oligodeoxynucleotide by a hexamethylene linker. The 30-bp fluoresceinated dsDNA was prepared by annealing these two oligodeoxynucleotides together. Fluorescence polarization experiment was done using a DNA-binding solution containing 10 mM Na-phosphate (pH 7.2), 100 mM NaCl, 1 nM fluoresceinated DNA and 1 µg of poly(dI-dC) as non-specific DNA. The protein solution containing 500 nM dimeric Rv3066 and 1 nM fluoresceinated DNA was titrated into the DNA-binding solution until the millipolarization (mP) became unchanged. All measurements were performed at 25°C using a PerkinElmer LS55 spectrofluorometer equipped with a Hamamatsu R928 photomultiplier. The excitation wavelength was 490 nm, and the fluorescence polarization signal (in ΔP) was measured at 520 nm. Each titration point recorded was an average of 15 measurements. Data were analyzed using the equation, P = {(Pbound − Pfree)[protein]/(KD + [protein])} + Pfree, where P is the polarization measured at a given total protein concentration, Pfree is the initial polarization of free fluorescein-labeled DNA, Pbound is the maximum polarization of specifically bound DNA and [protein] is the protein concentration. The titration experiments were repeated for three times to obtain the average KD value. Curve fitting was accomplished using the program ORIGIN (OriginLab Corporation, Northampton, MA, USA).
To study if the binding affinity between Rv3066 and DNA is affected by ethidium, fluorescence polarization experiment was carried out in the presence of 1 µM ethidium. All experimental procedures were the same as above, except that the protein and DNA-binding solutions also contain 1 µM ethidium.
Fluorescence polarization assay for ligand-binding affinity
Fluorescence polarization was used to determine ethidium-binding affinities of Rv3066 and its mutants. This approach was also employed to study the interaction between the Rv3066 regulator and the anti-TB drug thioridazine. The experiment was done using a ligand-binding solution containing 10 mM Na-phosphate (pH 7.2), 100 mM NaCl and 1 µM ethidium bromide. The protein solution consisting of Rv3066 or Rv3066 mutant in 10 mM Na-phosphate (pH 7.2), 100 mM NaCl and 1 µM ethidium bromide was titrated into the ligand-binding solution until the polarization (P) was unchanged. As this is a steady-state approach, fluorescence polarization measurement was taken after a 5 min incubation for each corresponding concentration of the protein and ligand to ensure that the binding has reached equilibrium. All measurements were performed at 25°C using a PerkinElmer LS55 spectrofluorometer equipped with a Hamamatsu R928 photomultiplier. The excitation and emission wavelengths were 483 and 620 nm for ethidium binding, whereas these wavelengths were 320 and 430 nm for thioridazine measurement. Fluorescence polarization signal (in ΔP) was measured at the emission wavelength. Each titration point recorded was an average of 15 measurements. Data were analyzed using the equation, P = {(Pbound − Pfree)[protein]/(KD + [protein])} + Pfree, where P is the polarization measured at a given total protein concentration, Pfree is the initial polarization of free ligand, Pbound is the maximum polarization of specifically bound ligand and [protein] is the protein concentration. The titration experiments were repeated for three times to obtain the average KD value. Curve fitting was accomplished using the program ORIGIN (OriginLab Corporation).
Gel filtration
A protein liquid chromatography Superdex 200 16/60 column (GE Healthcare Biosciences) with a mobile phase containing 20 mM Tris–HCl (pH 8.5) and 300 mM NaCl was used in the gel-filtration experiments. Blue dextran (Sigma-Aldrich, St Louis, MO, USA) was used to determine the column void volume, and proteins for use as gel filtration molecular weight standards were cytochrome C (Mr 12 400), carbonic anhydrase (Mr 29 000), albumin bovine serum (Mr 66 000), alcohol dehydrogenase (Mr 150 000) and β-Amylase (Mr 200 000). All these standards were purchased from Sigma-Aldrich. The molecular weights of the experimental samples were determined following the protocols supplied by the manufacturers.
Molecular modeling
The program AutoDock Vina (29) was used to predict the ligand-binding mode of several Rv3066 drugs, including acriflavine, ethidium, proflavine, pyronin Y, safranin O and thioridazine. A monomer of the structure of Rv3066–ethidium with the bound ethidium removed was used for dockings. The protein was set as a rigid structure whereas the conformation of each ligand was optimized during all modeling and docking procedures. For each ligand, the results were ranked on the basis of predicted free energy of binding and the one with the highest binding affinity was recorded.
The model of the DNA-bound form of Rv3066 was generated using AutoDock Vina (29). In brief, the two N-terminal domains of dimeric apo-Rv3066 (Form I structure) were chosen to dock onto the two successive major grooves of the IR1 double helix. During the docking procedure, both the structures of Rv3066 and IR1 were held rigid. After obtaining the docking result, the entire structure of the dimeric Rv3066 regulator was then superimposed onto the docked N-terminal helices at the major grooves of the DNA to generate the final Rv3066–DNA complex model.
RESULTS
Overall structure of Rv3066
In the absence of inducer molecule, the Rv3066 regulator was crystallized in two different Forms, I and II (Supplementary Figure S1). The Form I (SeMet) crystal structure was determined to a resolution of 2.3 Å (Table 1 and Figure 1a). The asymmetric unit contains a single homodimer, suggesting that this regulator is dimeric in nature. Similar to LfrR (30), the left and right subunits of Rv3066 are asymmetrical. The dimeric Form I structure of Rv3066, indicating an all-helical protein, is shown in Figure 1b. Superimposition of both subunits of Rv3066 gives rise to an overall rms deviation of 1.3 Å calculated over the Cα atoms.
Figure 1.

Stereo view of the experimental density map and ribbon diagram of the crystal structure of Rv3066. (a) Representative section of electron density in the vicinity of helices α5 and α8. The solvent-flattened electron density (40–2.3 Å) is contoured at 1σ and superimposed with the final refined model (magenta, carbon; red, oxygen; blue nitrogen). (b) Ribbon diagram of the Rv3066 dimer. Helices α1–α9 (left subunit) and α1′–α9′ (right subunit) are labeled. The Figure was prepared using PyMOL (http://www.pymol.sourceforge.net).
The crystal structure of Form II was refined to a resolution of 1.8 Å (Table 1). Like Form I, the structure of Form II indicates that this protein is an asymmetric homodimer. Superimposition of the Cα atoms of the two subunits of Form II results in an rms deviation of 1.8 Å. Surprisingly, the conformations of the structures of Forms I and II are quite distinct from each other, suggesting that these two structures probably represent two different transient states of the regulators. Superimposition of the entire dimer of these two apo-Rv3066 structures (Forms I and II) provides an rms deviation of 3.0 Å (Figure 2). Overall, the architecture of these two Rv3066 structures are in good agreement with those of the homolog proteins TetR (31,32), QacR (33,34), CprB (35), EthR (36,37), CmeR (38), AcrR (39), SmeT (40) and LfrR (30). Each subunit of Rv3066 is composed of nine α helices (α1–α9 and α1′–α9′, respectively) (Figures 1b and 2) and can be divided into two motifs: an N-terminal DNA-binding domain and a C-terminal ligand-binding domain. The helices of Rv3066 are designated numerically from the N-terminus as α1 (15–30), α2 (37–44), α3 (48–54), α4 (58–86), α5 (90–103), α6 (105–120), α7 (122–143), α8 (145–165) and α9 (171–182). In this arrangement, the smaller N-terminal domain includes helices α1 through α3 and the N-terminal end of α4 (residues 58–68), with α2 and α3 forming a typical helix-turn-helix motif. However, the larger C-terminal domain comprises the C-terminal end of helices α4 (residues 69–86) through α9 and helices α6, α8 and α9 are involved in the dimerization of the regulator. The smaller N-terminal domain shares considerably high sequence and structural similarities with the TetR-family regulators, suggesting that Rv3066 belongs to the TetR family. For example, residues 13–68 possess 20% amino acid identity and 68% homology to that of TetR (31). This N-terminal region also shows identities of 29% and 25%, and similarities of 62% and 63% to those of the M. smegmatis LfrR (30) and M. tuberculosis EthR repressors (37), respectively. Protein sequence alignment of Rv3066 with the TetR-family members of other Mycobacterium species is shown in Supplementary Figure S2. The alignment suggests that Rv3066 is a typical TetR-family regulator.
Figure 2.
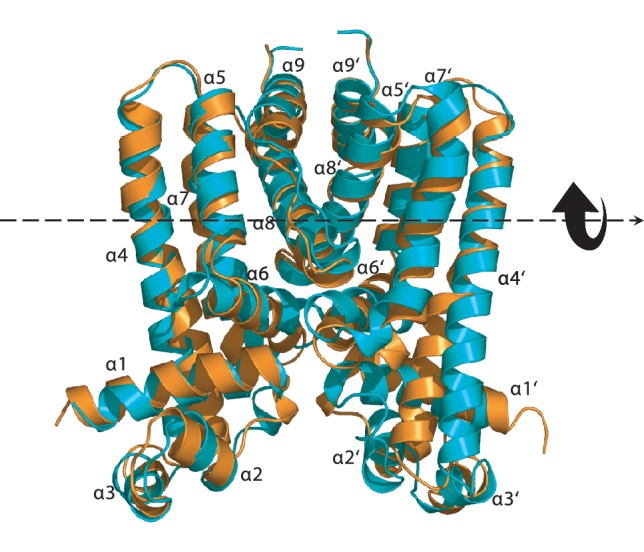
Structural comparison of Forms I and II of the Rv3066 regulator. This is a superimposition of the dimeric structures of Forms I and II (orange, Form I; blue, Form II). Helices α1–α9 (left subunit) and α1′–α9′ (right subunit) are labeled. The arrow indicates a change in orientation of the right subunit of Form II when compared with the structure of Form I.
Conformational flexibility of the Rv3066 regulator
Two distinct conformations of apo-Rv3066 were captured using crystallography, suggesting that this regulatory protein is quite flexible in nature. A comparison of the N-terminal DNA-binding domains of the dimeric structures of Forms I and II indicates that these two structures may depict two different transient states of the regulator. Apparently, these two conformations are related in which an 8° rotational motion of the right subunit (helices α1′–α9′) with respect to the left protomer (helices α1–α9) is attributed to the difference (Supplementary Figure S3). Indeed, we can easily generate the Form II conformation using the Form I structure as a starting point and then following the rigid-body rotational trajectory based on the TLS parameters. The resulting final B-factors and overall Rwork/Rfree of this Form II dimeric Rv3066 structure are 24.0/22.9 Å2 (left/right subunits) and 21.4/25.5%, respectively. Thus, there is a chance that ligand binding triggers a rotational motion within the dimer of the regulator. Presumably, this movement prohibits the binding of the dimeric regulator at its cognate DNA, which in turn releases the regulator from the promoter region and allows for the expression of the Mmr efflux pump.
The C-terminal domain of the Form II structure forms a large cavity, presumably creating a ligand-binding pocket of the regulator (Supplementary Figure S4). This cavity cannot be found in the Form I structure. Thus, it is likely that the Form II crystal structure mimics the ligand-bound form of Rv3066. The pocket, predominately formed by helices 5–8, opens horizontally from the side of each protomer. The total volume of these two binding pocket is about 540 Å3 (230 Å3 for the left subunit and 310 Å3 for the right subunit). Helices α4–α6 of each subunit of Form II make the entrance of the binding pocket, with residues V100, D104 and Y108 participating to form this entrance.
Structure of the Rv3066–ethidium complex
The crystal structure of the Rv3066–ethidium complex (Figures 3 and Supplementary Figure S5) was refined to a resolution of 2.3 Å (Table 1), revealing that ethidium indeed binds within the ligand-binding pocket formed by the C-terminal domain. Helices 5–8 contribute to form this pocket, and each subunit of Rv3066 is found to bind an ethidium molecule within the binding pocket. Superimposition of the dimeric Rv3066–ethidium structure to those of Forms I and II apo-Rv3066 result in overall rms deviations of 3.4 and 1.9 Å, respectively.
Figure 3.

Crystal structure of the Rv3066–ethidium complex. (a) Ribbon diagram of the Rv3066–ethidium complex. The bound ethidiums are shown as sticks (magenta, carbon; blue, nitrogen). (b) Structural comparison of Form I and Rv3066–ethidium. This is a superimposition of the dimeric structures of Form I (orange) and Rv3066–ethidium (green). The bound ethidiums are in yellow sticks. Helices α1–α9 (left subunit) and α1′–α9′ (right subunit) are labeled. The arrow indicates a change in orientation of the right subunit of dimeric Rv3066–ethidium when compared with the Form I structure. This conformational change can be interpreted as a rotational motion of the right subunit of Rv3066 with respect to the horizontal axis passing through the two ligand-binding pockets of the dimer upon ethidium binding.
Although the conformations of the two subunits within the dimer are not identical, their ethidium-binding modes are quite similar. Both ethidium sites utilize the same set of amino acids to accommodate the binding, with a slight difference in the interaction distances. The Fo − Fc electron density maps of the two bound ethidiums within the dimer are illustrated in Figure 4a. Interestingly, the total volume of the two ligand-binding pocket has expanded to 929 Å3 (443 Å3 for the left subunit and 486 Å3 for the right subunit) in the ethidium bound structure.
Figure 4.
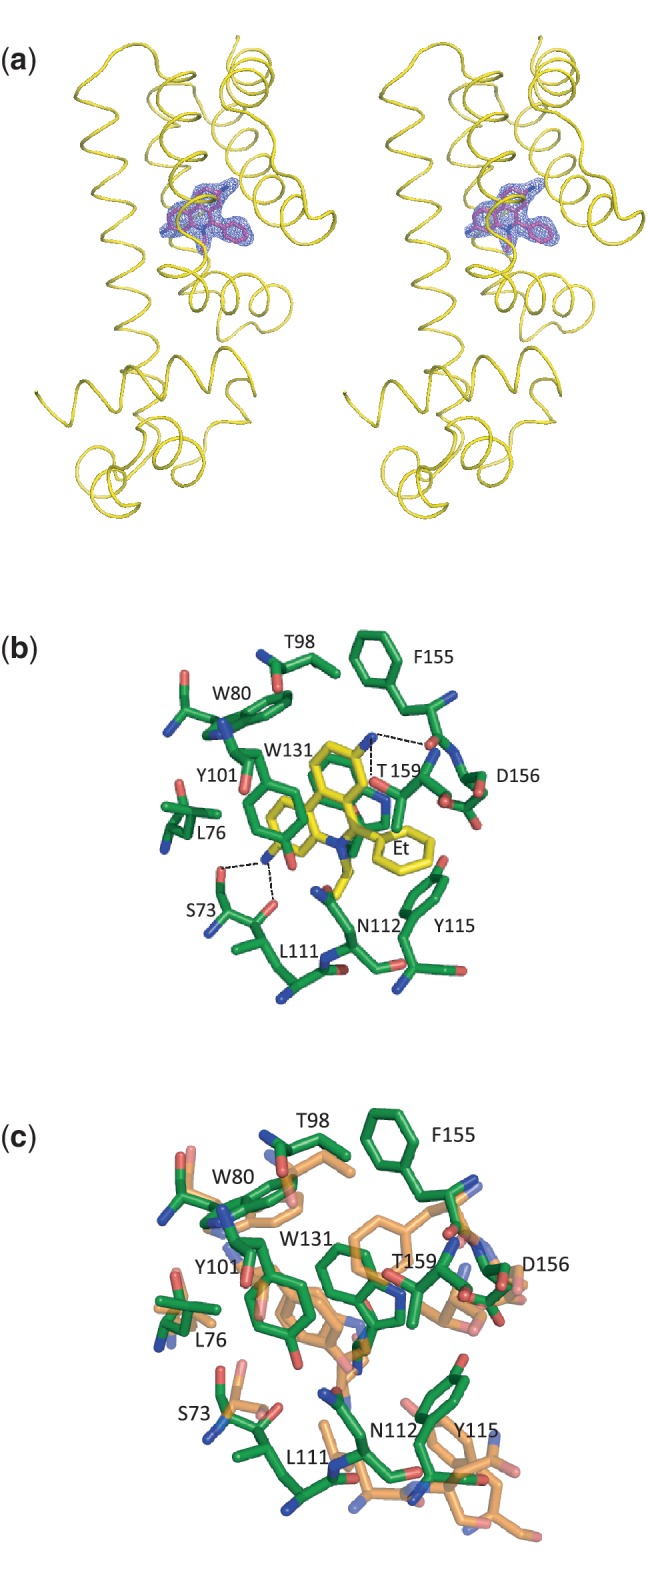
Electron density maps and the ethidium-binding site. (a) Stereo view of the Fo − Fc electron density map of the bound ethidium in the left subunit of dimeric Rv3066 (the orientation corresponds to Figure 3a). The bound ethidium is shown as a stick model (magenta, carbon; blue, nitrogen). The Fo − Fc map is contoured at 3.0 σ (blue mesh). The surrounding secondary structural elements are shown as yellow ribbons. (b) The ethidium-binding site of the left subunit of the dimeric Rv3066–ethidium complex. Residues involved in ethidium binding are in green sticks. The bound ethidium is shown as yellow sticks. Dotted lines depict the hydrogen bonds. (c) Superimposition of the ligand-binding pocket before and after ethidium binding. Residues involved in ethidium binding are shown as sticks (orange, Form I; green, Rv3066–ethidium).
Each bound ethidium molecule is completely buried in the Rv3066-binding pocket. The ligand-binding pocket is found to be hydrophobic in nature. Five aromatic residues, W80, Y101, Y115, W131 and F155, participate to make aromatic stacking interactions and hydrophobic contacts with the bound ethidium (Figure 4b and c and Supplementary Figure S6). In addition, L76, T98, L111 and T159 are involved to secure the binding through hydrophobic interaction. Furthermore, the N1 and N2 amino group nitrogens of the phenanthridinium system of ethidium are hydrogen bonded to the side chain oxygen of T159 and S73 respectively (Table 3). Additional hydrogen bonds have also been found between the N1 and N2 amino group nitrogens of the bound ethidium and the backbone oxygens of F155 and S73 to secure the binding (Table 3). In addition, a negatively charged residue D156 participates to form the ligand-binding site, and this residue is ∼3.3 Å away from the phenyl groups of the bound ethidium in each subunit of the dimer (Figure 4b and Supplementary Figure S6).
Table 3.
Rv3066–ethidium contacts
| Distance (Å) | ||
|---|---|---|
| Residue–ligand contacts | A chain | B chain |
| S73 | 2.7a | 2.7a |
| S73 (backbone oxygen) | 2.9a | 2.9a |
| L76 | 3.1 | 3.6 |
| W80 | 3.6 | 3.7 |
| T98 | 3.5 | 3.5 |
| Y101 | 3.4 | 3.5 |
| L111 | 4.6 | 4.3 |
| N112 | 3.5 | 3.2 |
| Y115 | 3.3 | 3.4 |
| W131 | 3.0 | 3.0 |
| F155 | 3.9 | 3.8 |
| F155 (backbone oxygen) | 2.9a | 2.7a |
| D156 | 3.3 | 3.3 |
| T159 | 2.9a | 2.7a |
Contacts within 4.8 Å of the bound ethidiums are listed.
aHydrogen bond distance.
Electrophoretic mobility shift assay
Bacterial multidrug efflux regulators usually bind to the palindromic IR sequences at the promoter regions to control the expression of the multidrug efflux pumps. In the mmr-rv3066 operon, it appears that there are two 14-bp palindromic IR sequences located upstream of mmr. These two IRs (IR1 and IR2) are located right next to one another, where their sequences are complementary to each other (Supplementary Figure S7). The sequences of IR1 and IR2 are 5′-TGTACATTTGTACA-3′ and 5′-TGTACAAATGTACA-3′, respectively. The presence of these IRs suggests potential binding sites for the Rv3066 regulator. Thus, EMSA was performed using a 30-bp dsDNA containing the IR1 sequence and purified Rv3066 protein to detect if the regulator specifically binds IR1. As shown in Figure 5a and b, the shift of the labeled DNA band was dependent upon the protein concentration as well as the addition of the unlabeled specific 30-bp dsDNA. The data indicate that the IR1 sequence potentially forms the specific binding site for Rv3066.
Figure 5.

Electrophoretic mobility shift assay for Rv3066 and IR1 binding. (a) The DIG-11-dUTP-labeled DNA (0.02 µM) was incubated with increasing concentrations (0, 0.04, 0.16 and 0.64 µM) of the purified Rv3066 protein (lanes 1–4, respectively). With Rv3066 at 0.64 µM, the binding was competed by the unlabeled 30-bp DNA (0.10 and 2.50 µM, lanes 5 and 6, respectively), and unlabeled internal random DNA fragment (0.10 and 2.50 µM, lanes 7 and 8, respectively). (b) Control experiment of EMSA. The control experiments were performed using 0.02 µM labeled internal random DNA with different concentrations of the Rv3066 regulator (0, 0.64 and 1.28 µM, lanes 1, 2 and 3, respectively). (c) Ethidium bromide dissociates the Rv3066–IR1 complex. Different concentrations (0, 6.4, 64, 320 and 1280 µM) of ethidium bromide were incubated with 0.64 µM of purified Rv3066 (lanes 2–7, respectively) for 30 min before adding the DIG-11-dUTP-labeled 30-bp DNA (0.02 µM) for the assays. Lane 1 indicates the signal of the free DIG-11-dUTP-labeled DNA.
EMSA was further performed with the purified Rv3066 protein and 30-bp DNA fragment containing the IR1 site in the presence of ethidium, which is a substrate of the Mmr efflux pump and is found to be bound in the ligand-binding site of the Rv3066 regulator. As shown in Figure 5c, the addition of ethidium to the Rv3066–DNA complex resulted in the loss of the retarded band, indicating the separation of the protein and DNA components. The result suggests that ethidium is a substrate of Rv3066 and that the binding of ethidium triggers significant conformational change to the regulator, which in turn renders it unable to bind its cognate operator DNA.
Dye primer based DNase I footprint assay
To further confirm the binding site of Rv3066 in the mmr-rv3066 promoter region, DNase I footprint assay was performed using the method of dye primer sequencing (25). In comparison with different electropherograms at various concentrations of the dimeric Rv3066 protein, we were able to uncover the specific DNA sequence, TTGTGTACATTTGTACACAAAGG, which was protected by the regulator (Figure 6 and Supplementary Figure S8). Interestingly, the IR1 sequence (TGTACATTTGTACA) was found within this protected region, suggesting that Rv3066 is likely to specifically bind IR1.
Figure 6.

Direct binding of Rv3066 to the mmr-rv3066 promoter by dye primer based DNase I footprint assay. Electropherograms indicating the protection pattern of the mmr-rv3066 promoter after digestion with DNase I following incubation with (a) 0, (b) 1.5 and (c) 3.0 pmol of dimeric Rv3066 are shown. The protected DNA sequence TTGTGTACATTTGTACACAAAGG containing IR1 is also shown.
Impact of drugs on mmr transcription in M. smegmatis
We cloned the mmr-rv3066 operon into M. smegmatis to assess its function and induction by antimicrobials. It has been reported that the anti-TB drug thioridazine was used to cure 10 XDR-TB patients (41). Thus, this drug was chosen to investigate its effect on the expression of the Mmr multidrug efflux pump using qRT–PCR. We also studied the effect of ethidium and erythromycin on mmr transcription using the same approach. After 1 h induction with thioridazine, the mmr gene was up-regulated by 2.70 ± 0.09-fold (P-value = 0.0001). No obvious induction of the mmr gene was observed in the presence of ethidium or erythromycin at the same time-point.
Fluorescence polarization assay
Presumably, Rv3066 suppresses the expression of the Mmr multidrug efflux pump by directly binding to its target DNA. Fluorescence polarization-based assay was carried out to study the interaction between Rv3066 and the 30-bp DNA containing the IR1 sequence. Figure 7a illustrates the binding isotherm of Rv3066 in the presence of 1 nM fluoresceinated DNA. The titration experiment indicated that this regulator binds the 30-bp IR1 operator with a dissociation constant, KD, of 4.4 ± 0.3 nM. This value is similar to that of the QacR regulator where it binds DNA with the KD of 5.7 nM (42). The binding data also indicate that Rv3066 binds its cognate DNA with a stoichiometry of one Rv3066 dimer per IR1.
Figure 7.

Representative fluorescence polarization of Rv3066. (a) The binding isotherm of Rv3066 with the 30-bp DNA containing the IR1 sequence, showing a KD of 4.4 ± 0.3 nM. (b) The binding isotherm of Rv3066 with ethidium, showing a KD of 2.9 ± 0.2 µM. (c) The binding isotherm of Rv3066 with thioridazine, showing a KD of 211.8 ± 34.2 µM. Fluorescence polarization is defined by the equation, FP = (V − H)/(V + H), where FP equals polarization, V equals the vertical component of the emitted light, and H equals the horizontal component of the emitted light of a fluorophore when excited by vertical plane polarized light. FP is a dimensionless entity and is not dependent on the intensity of the emitted light or on the concentration of the fluorophore. mP is related to FP, where 1 mP equals one thousandth of a FP.
To investigate whether the presence of ethidium affects the binding of Rv3066 with IR1, fluorescence polarization was also carried out to study the interaction between Rv3066 and IR1 in the presence of this drug. The experimental results suggest that the KD of Rv3066–IR1 becomes 10.7 ± 0.9 nM in the presence of 1 µM ethidium (Supplementary Figure S9), indicating that ethidium significantly weakens the binding affinity between Rv3066 and IR1 by 2.4 times.
In addition, fluorescence polarization was used to determine the binding affinity of ethidium and the anti-TB drug thioridazine by Rv3066. The measurements indicate that the KD values of the Rv3066–ethidium and Rv3066–thioridazine complexes are 2.9 ± 0.2 and 211.8 ± 34.2 µM, respectively (Figure 7b and c). These binding data suggest that the protein employs a simple binding stoichiometry with a 1:1 monomeric Rv3066-to-drug molar ratio. This molar ratio is indeed in good agreement with the crystal structure where each monomer of Rv3066 binds one ethidium molecule.
The structure of Rv3066–ethidium indicates that residues W80, Y101, N112, Y115, W131 and D156 are involved in ligand binding. These residues were mutated into alanines (W80A, Y101A, N112A, Y115A, W131A and D156A). The corresponding mutant regulators were then expressed and purified. The ability of these mutant regulators to bind ethidium was tested using fluorescence polarization assay (Table 4). The results demonstrate that several of these point mutants show a significant decrease in the binding affinity for ethidium when compared with the wild-type Rv3066 regulator. Particularly, mutant D156A increases the dissociation constant, KD, of ethidium binding by 20-fold, suggesting that D156 is a critical residue in the multidrug-binding site of Rv3066. Moreover, mutants W80A, N112A and W131A decrease the affinity for ethidium binding by three to four times. A double-point mutant W80A–W131A was then produced to investigate how these tryptophans affect the binding of ethidium. Similar to the D156A mutant, the W80A–W131A double mutant indicates a significantly weaker binding affinity (20-fold decrease) when compared with that of the wild-type Rv3066, suggesting these two tryptophans, W80 and W131, are important residues for drug recognition.
Table 4.
Dissociation constants for ethidium binding
| KD (µM) | |
|---|---|
| Wild-type Rv3066 | 2.9 ± 0.2 |
| W80A | 8.5 ± 0.6 |
| Y101A | 2.1 ± 0.2 |
| N112A | 10.3 ± 0.7 |
| Y115A | 6.1 ± 0.6 |
| W131A | 12.9 ± 1.0 |
| D156A | 41.0 ± 5.9 |
| W80A-W131A | 43.2 ± 5.2 |
Gel filtration
To confirm the stoichiometry of one Rv3066 dimer bound to one IR1 operator site, gel-filtration experiment was performed using the purified Rv3066 protein pre-incubated with the purified, complementary, annealed 30-bp oligonucleotides containing the IR1 sequence. The result suggests an average molecular weight of 67.3 ± 3.8 kDa for the Rv3066–DNA complex (Figure 8). This value is in good agreement with the theoretical value of 66.0 kDa for two Rv3066 molecules bound to the 30-bp DNA. Thus, the stoichiometry of the Rv3066–IR1 complex is 1:1 dimeric Rv3066-to-DNA molar ratio.
Figure 8.

Representative gel-filtration experiment. The experiment demonstrated that two Rv3066 molecules are bound to one 30-bp DNA containing the IR1 operator. The y-axis values were defined as: Kav = (Ve − V0)/(VT − V0), where VT, Ve and V0 are the total column volume, elution volume and void volume of the column, respectively. Standards used were: A, cytochrome C (Mr 12 400); B, carbonic anhydrase (Mr 29 000); C, albumin bovine serum (Mr 66 000); D, alcohol dehydrogenase (Mr 150 000); and E, β-Amylase (Mr 200 000). The void volume was measured using blue dextran (Mr 2 000 000).
Docking of ligands into the multidrug drug binding site
To understand how Rv3066 binds different ligands, we used the program AutoDock Vina (29) to identify potential binding modes for a variety of drug molecules. We first predicted an ethidium-binding site in Rv3066. We found that the predicted bound ethidium molecule was completely overlapped with the bound ethidium identified from the crystal structure and their binding modes are nearly identical (Supplementary Figure S10), suggesting that AutoDock Vina is sufficiently precise for identification of potential drug-binding pockets. When Vina was used to search for binding sites for different Rv3066 drugs, including acriflavine, proflavine, pyronin Y, safranin O and thioridazine, it was found that all these drug molecules were bound within the ethidium-binding site identified by X-ray crystallography (Figure 9a and Table 5).
Figure 9.
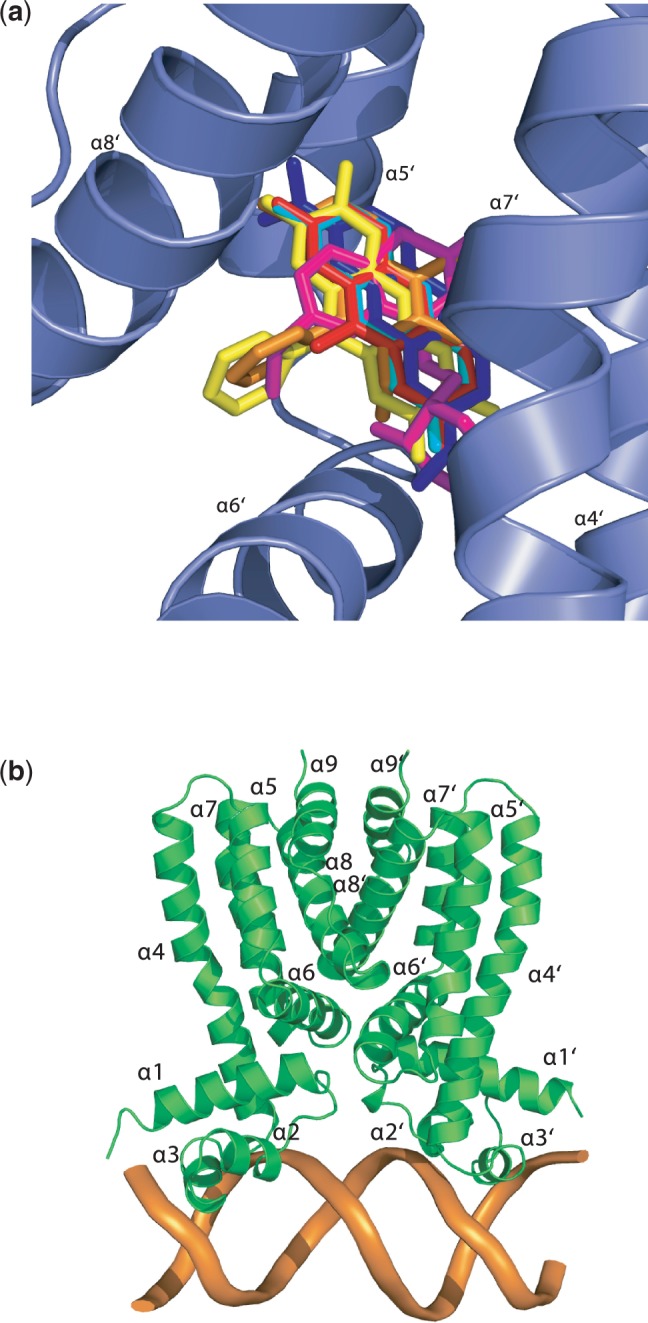
Docking of drugs and DNA onto the structure of Rv3066. (a) This is a composite figure showing the locations of the predicted bound ligands in the ligand-binding pocket. The ligands shown in stick models are ethidium (orange), acriflavine (red), proflavine (cyan), pyronin Y (blue), safranin O (yellow) and thioridazine (magenta). (b) Speculative model of Rv3066 in its DNA-bound form. It is expected that the Rv3066–IR1 complex is formed by binding a dimer of Rv3066 (green) to a double-stranded IR1 (orange).
Table 5.
Docking of ligands and DNA onto the Rv3066 regulator
| Binding affinity (kcal/mol) | |
|---|---|
| Rv3066–ethidium | −12.7 |
| Rv3066–acriflavine | −11.6 |
| Rv3066–proflavine | −10.8 |
| Rv3066–pyronin Y | −7.3 |
| Rv3066–safranin O | −8.9 |
| Rv3066–thioridazine | −8.3 |
| Rv3066–IR1 | −10.9 |
Predicting the structure of DNA-bound form of Rv3066
AutoDock Vina (29) was also used to generate a model of the Rv3066–DNA complex structure (Figure 9b and Table 5). This model reveals that the two N-terminal domains of Rv3066 within the dimer are able to fit well into the two successive major grooves of the target DNA. Extensive interactions between the regulator and DNA have also been found to stabilize this protein–DNA complex structure. Specifically, T52 is found to make a contact with one base of IR1. In addition, Y53 participates to interact directly with two different bases. Additional stabilization of the complex comes from R15, H37 and R38, in which these residues make phosphate contacts with the DNA.
DISCUSSION
With the rising incidences of multidrug resistant strains of TB, it has become increasingly important to understand how individual proteins function to recognize and confer resistance to multiple antibiotics in this pathogen. The crystal structures of Rv3066 both in the absence and presence of the bound ethidium provide direct information about how this regulator controls the expression of the Mmr multidrug efflux pump, which mediates the resistance of several antimicrobial agents. It appears that ethidium binding triggers a series of cooperativity motions of the C-terminal helices, including the horizontal shifts of helices α5, α6 and α7 toward the dimer interface, and an upward movement of helix α8 within one subunit of the regulator. These conformational changes initiate a rotational motion of the second subunit of Rv3066 with respect to the horizontal axis passing through the two ligand-binding pockets of the dimer (Figures 3b, 5a and b), presumably making the relative orientation of the two N-terminal DNA-binding domains no longer compatible with the two consecutive major grooves of the operator B-DNA. The net result is that this dimeric regulator is released from the promoter, initiating the expression of the Mmr multidrug efflux pump.
We generated a speculative model of DNA-bound Rv3066 using AutoDock Vina (29). The model suggests that the two N-terminal DNA-binding domains of the dimeric apo-Rv3066 regulator (Form I) can easily be docked onto the two consecutive major groove of IR1, suggesting that the structure of the regulator in the Rv3066–IR1 complex may be very similar to the Form I structure of apo-Rv3066. By comparing with the apo-Rv3066, Rv3066–ethidium and the speculative Rv3066–DNA structures, it appears that the induction mechanism of Rv3066 seems to be attributed to the rigid body rotational motion of the two subunits triggered by ethidium binding (Figure 5c). As mentioned above, this motion changes the relative orientation of the two DNA-binding domains of Rv3066, which makes the dimer incompatible with the two successive major grooves of the IR and results in disallowing the regulator to bind the DNA duplex. This induction mechanism is quite distinct from those of QacR (33,34) and TetR (31,32). However, a similar induction mechanism, which is triggered by the movement as rigid bodies, can be found in the SimR regulator (43), where rigid body rotation within subunits of the dimer in relation to one another contributes to the induction.
In comparison with the Form I and ethidium bound structures, the shift in position of helices α5, α6 and α7 toward the dimer interface results in the formation of four new hydrogen bonds. These hydrogen bonds are found within the dimer interface between H120 and R109′, and between R121 and Q113′. In addition, the backbone oxygens of R129 and T165 also contribute to the dimer interface. These backbone oxygens interact with I164′ and R129′ to form two hydrogen bonds. The formation of these new hydrogen bonds is presumed to stabilize the tertiary structure of the ligand bound form of the Rv3066 dimer.
Coupled with the movements of these C-terminal helices, residues located at the binding site are also found to readjust their positions to accommodate for the binding of ethidium. Noticeably, Y115 shifts upward by 2.4 Å presumed to make an interaction with the phenyl group of the bound ethidium, whereas F155 is found to swing upward by 90° to enlarge the volume of the binding site. In addition, W131 adjusts its position to shift upward by 2.3 Å and makes an aromatic stacking interaction with the three-ring system of the phenanthridinium group of ethidium. W80 and Y101 also slightly switch in location by 1.1 and 2.0 Å to contribute aromatic π–π and stacking interactions with the bound ligand (Figure 4c). One common characteristic of multidrug-binding proteins is their flexibility to accommodate for different ligands in a single ligand-binding pocket. This plasticity and flexibility can easily be seen in the Rv3066 regulator in which many of these residues lining the binding site are found to participate and relocate their side chain positions upon ethidium binding.
To investigate if Rv3066 can accommodate different drugs, we used the program AutoDock Vina (29) to study how Rv3066 binds a variety of drugs. The docking study shows that the large cavity of the multidrug-binding site of each Rv3066 monomer can accommodate many other drugs, such as acriflavine, proflavine, pyronin Y, safranin O and thioridazine. In each case, the bound drug was completely buried in the Rv3066 molecule, and strong interaction was observed between the bound drug and the regulator (Table 5). The dockings suggested that all these ligands are bound in the same multidrug-binding site with a similar binding mode, suggesting that the process of induction by these drugs is similar.
A distinguishing feature of multidrug-binding proteins that bind cationic drugs is the presence of buried acidic glutamates or aspartates in the ligand-binding pockets. This was clearly demonstrated by the structures of the QacR–ligand complexes (33). Indeed, a completely buried negatively charged aspartate, which is essential for cationic ligand recognition, has also been found in the ligand-binding pocket of the AcrR multidrug efflux regulator (39). A similar characteristic for the TetR-family regulators that recognize negatively charged antimicrobials has also been observed through x-ray crystallography (38,44). In this case, positively charged histidines or lysines within the ligand-binding pockets are critical for interacting with the negatively charged drugs. For Rv3066, it is found that there is one negatively charged residue (D156) inside the multidrug-binding pocket. D156 is critical for ethidium binding as shown using fluorescence polarization and mutagenesis studies, although this residue does not seem to contribute a significant electrostatic interaction to the cationic ligand. A mutation of D156 with an alanine drastically decreases the Rv3066–ethidium-binding affinity by 20-fold. Instead of contributing hydrogen-bonded interaction to neutralize the formal positive charge of the bound ethidium, the D156 residue, together with N112, is responsible for forming hydrogen bonds with the aromatic residues, Y101, Y115 and W131 (Figure 4b). These three residues, in addition to W80, form an aromatic cage-like binding pocket to position the bound ethidium (Supplementary Figure S6), suggesting that D156 is important for the organization of the ligand-binding site. The importance of the cage-like arrangement of these aromatic residues to bind ethidium is further demonstrated using mutagenesis and fluorescence polarization studies, in which the W80–W131 double mutant has been found to bind ethidium 20 times weaker than the wild-type Rv3066.
It is found that the Rv3066 dimer binds two drug molecules, with each subunit of the regulator contributing to bind one drug. Gel-filtration experiment confirmed that the Rv3066–IR1 complex should be in the form of 1:1 dimeric Rv3066-to-DNA molar ratio. Real-time quantitative RT–PCR analysis suggested that the mmr gene was significantly up-regulated by thioridazine induction. This result is indeed in good agreement with a recent finding that the treatment of thioridazine on M. tuberculosis causes a profound increase in the expression of the Mmr multidrug efflux pump (12). The structures of the Rv3066 regulator both in the absence and presence of bound ethidium, together with the experimental data from electrophoretic mobility shift, footprinting analysis, qRT–PCR, mutagenesis, gel filtration and fluorescence polarization, support the role of Rv3066 in regulating the expression level of the multidrug efflux pump Mmr in M. tuberculosis.
PROTEIN DATA BANK ACCESSION CODES
Coordinates and structural factors for the structures of Rv3066 have been deposited at the RCSB Protein Data Bank with accession codes 3T6N (Form I, apo-Rv3066), 3V6G (Form II, apo-Rv3066) and 3V78 (Rv3066–ethidium).
SUPPLEMENTARY DATA
Supplementary Data are available at NAR Online: Supplementary Figures 1–10.
FUNDING
National Institutes of Health (NIH) [DK063008 to Q.Z. and GM086431 to E.W.Y.]; Use of the Advanced Photon Source is supported by the U.S. Department of Energy, Office of Basic Energy Sciences [DE-AC02-06CH11357]; Community College Institute of Science Internship (CCI) and Science Undergraduate Laboratory Internship (SULI) from the DOE (to J.E.G. and D.C.M.). Funding for open access charge: NIH [GM086431].
Conflict of interest statement. None declared.
Supplementary Material
ACKNOWLEDGEMENTS
The authors are grateful to Susan T. Howard at the University of Texas Health Science Center (Tyler) for providing the pMV261plasmid used in this study. This work is based upon research conducted at the Northeastern Collaborative Access Team beamlines of the Advanced Photon Source, supported by award RR-15301 from the National Center for Research Resources at the National Institutes of Health.
REFERENCES
- 1. World Health Organization. (2010) Fact sheet no. 104: tuberculosis.
- 2.Goldman RC, Plumley KV, Laughon BE. The evolution of extensively drug resistant tuberculosis (XDR-TB): history, status and issues for global control. Infect. Disord. Drug Targets. 2007;7:73–91. doi: 10.2174/187152607781001844. [DOI] [PubMed] [Google Scholar]
- 3.Iseman MD. Treatment of multidrug-resistant tuberculosis. N. Engl. J. Med. 1993;329:784–791. doi: 10.1056/NEJM199309093291108. [DOI] [PubMed] [Google Scholar]
- 4.Frieden TR, Sterling T, Pablos-Mendez A, Kilburn JO, Cauthen GM, Dooley SW. The emergence of drug-resistant tuberculosis in New York City. N. Engl. J. Med. 1993;328:521–556. doi: 10.1056/NEJM199302253280801. [DOI] [PubMed] [Google Scholar]
- 5.Pillay M, Sturm AW. Evolution of the extensively drug-resistant F15/LAM4/KZN strain of Mycobacterium tuberculosis in KwaZulu-Natal, South Africa. Clin. Infect. Dis. 2007;45:1409–1414. doi: 10.1086/522987. [DOI] [PubMed] [Google Scholar]
- 6.Udwadia ZF, Amale RA, Rodrigues C. Totally drug-resistant tuberculosis in India. Clin. Infect. Dis. 2012;54:579–581. doi: 10.1093/cid/cir889. [DOI] [PubMed] [Google Scholar]
- 7.Nikaido H. Preventing drug access to targets: cell surface permeability barriers and active efflux in bacteria. Semin. Cell. Dev. Biol. 2001;12:215–223. doi: 10.1006/scdb.2000.0247. [DOI] [PubMed] [Google Scholar]
- 8.Li XZ, Nikaido H. Efflux-mediated drug resistance in bacteria. Drugs. 2004;64:159–204. doi: 10.2165/00003495-200464020-00004. [DOI] [PubMed] [Google Scholar]
- 9.De Rossi E, Ainsa JA, Riccardi G. Role of mycobacterial efflux transporters in drug resistance: an unresolved question. FEMS Microbiol. Rev. 2006;30:36–52. doi: 10.1111/j.1574-6976.2005.00002.x. [DOI] [PubMed] [Google Scholar]
- 10.Danilchanka O, Mailaender C, Niederweis M. Identification of a novel multidrug efflux pump of mycobacterium tuberculosis. Antimicrob. Agents Chemother. 2008;52:2503–2511. doi: 10.1128/AAC.00298-08. [DOI] [PMC free article] [PubMed] [Google Scholar]
- 11.De Rossi E, Branzoni M, Cantoni R, Milano A, Riccardi G, Ciferri O. mmr, a Mycobacterium tuberculosis gene conferring resistance to small cationic dyes and inhibitors. J. Bacteriol. 1998;180:6068–6071. doi: 10.1128/jb.180.22.6068-6071.1998. [DOI] [PMC free article] [PubMed] [Google Scholar]
- 12.Dutta NK, Mehra S, Kaushal D. A Mycobacterium tuberculosis sigma factor network responds to cell-envelope damage by the promising anti-mycobacterial thioridazine. PLoS One. 2010;5:e10069. doi: 10.1371/journal.pone.0010069. [DOI] [PMC free article] [PubMed] [Google Scholar]
- 13.Grkovic S, Brown MH, Skurray RA. Regulation of bacterial drug export systems. Microbiol. Mol. Biol. Rev. 2002;66:671–701. doi: 10.1128/MMBR.66.4.671-701.2002. [DOI] [PMC free article] [PubMed] [Google Scholar]
- 14.Ramos JL, Martinez-Bueno M, Molina-Henares AJ, Teran W, Watanabe K, Zhang XD, Gallegos MT, Brennan R, Tobes R. The TetR family of transcriptional repressors. Microbiol. Mol. Biol. Rev. 2005;69:326–356. doi: 10.1128/MMBR.69.2.326-356.2005. [DOI] [PMC free article] [PubMed] [Google Scholar]
- 15.Yu Z, Reichheld SE, Savchenko A, Parkinson J, Davidson AR. A comprehensive analysis of structural and sequence conservation in the TetR family transcriptional regulators. J. Mol. Biol. 2010;400:847–864. doi: 10.1016/j.jmb.2010.05.062. [DOI] [PubMed] [Google Scholar]
- 16.Otwinowski Z, Minor M. Processing of X-ray diffraction data collected in oscillation mode. Methods Enzymol. 1997;276:307–326. doi: 10.1016/S0076-6879(97)76066-X. [DOI] [PubMed] [Google Scholar]
- 17.Schneider TR, Sheldrick GM. Substructure solution with SHELXD. Acta Crystallogr. 2002;D58:1772–1779. doi: 10.1107/s0907444902011678. [DOI] [PubMed] [Google Scholar]
- 18.Pape T, Schneider TR. HKL2MAP: a graphical user interface for macromolecular phasing with SHELX programs. J. Appl. Crystallogr. 2004;37:843–844. [Google Scholar]
- 19.McCoy AJ, Grosse-Kunstleve RW, Adams PD, Winn MD, Storoni LC, Read RJ. Phaser crystallographic software. J. Appl. Crystallogr. 2007;40:658–674. doi: 10.1107/S0021889807021206. [DOI] [PMC free article] [PubMed] [Google Scholar]
- 20.Cowtan K. Recent developments in classical density modification. Acta Crystallogr. 2010;D66:470–478. doi: 10.1107/S090744490903947X. [DOI] [PMC free article] [PubMed] [Google Scholar]
- 21.Adams PD, Grosse-Kunstleve RW, Hung LW, Ioerger TR, McCroy AJ, Moriarty NW, et al. PHENIX: building new software for automated crystallographic structure determination. Acta Crystallogr. 2002;58:1948–1954. doi: 10.1107/s0907444902016657. [DOI] [PubMed] [Google Scholar]
- 22.Emsley P, Cowtan K. Coot: model-building tools for molecular graphics. Acta Crystallogr. 2004;D60:2126. doi: 10.1107/S0907444904019158. [DOI] [PubMed] [Google Scholar]
- 23.Brünger AT, Adams PD, Clore GM, DeLano WL, Gros P, Grosse-Kunstleve RW, Jiang JS, Kuszewski J, Nilges M, Pannu NS, et al. Crystallography & NMR system: A new software suite for macromolecular structure determination. Acta Crystallogr. 1998;D54:905–921. doi: 10.1107/s0907444998003254. [DOI] [PubMed] [Google Scholar]
- 24.Alekshun MN, Kim YS, Levy SB. Mutational analysis of MarR, the negative regulator of marRAB expression in Escherichia coli, suggests the presence of two regions required for DNA binding. Mol. Microbiol. 2000;35:1394–1404. doi: 10.1046/j.1365-2958.2000.01802.x. [DOI] [PubMed] [Google Scholar]
- 25.Zianni M, Tessanne K, Merighi M, Laguna R, Tabita FR. Identification of the DNA bases of a DNase I footprint by the use of dye primer sequencing on an automated capillary DNA analysis instrument. J. Biomol. Techniques. 2006;17:103–113. [PMC free article] [PubMed] [Google Scholar]
- 26.Jacobs WR, Jr, Kalpana GV, Cirillo JD, Pascopella L, Snapper SB, Udani RA, Jones WD, Jr, Barletta RG, Bloom BR. Genetic systems for mycobacteria. Methods Enzymol. 1991;204:537–555. doi: 10.1016/0076-6879(91)04027-l. [DOI] [PubMed] [Google Scholar]
- 27.Li XZ, Zhang L, Nikaido H. Efflux pump-mediated intrinsic drug resistance. Mycobacterium smegmatis. Antimicrob. Agents Chemother. 2004;48:2415–2423. doi: 10.1128/AAC.48.7.2415-2423.2004. [DOI] [PMC free article] [PubMed] [Google Scholar]
- 28.Livak KJ, Schmittgen TD. Analysis of relative gene expression data using real-time quantitative PCR and the 2(-Delta Delta C(T)) method. Methods. 2001;25:402–408. doi: 10.1006/meth.2001.1262. [DOI] [PubMed] [Google Scholar]
- 29.Trott O, Olson AJ. AutoDock Vina: improving the speed and accuracy of docking with a new scoring function, efficient optimization, and multithreading. J. Comp. Chem. 2010;31:455–461. doi: 10.1002/jcc.21334. [DOI] [PMC free article] [PubMed] [Google Scholar]
- 30.Bellinzoni M, Buroni S, Schaeffer F, Riccardi G, De Rossi E, Alzari PM. Structural plasticity and distinct drug-binding modes of LfrR, a mycobacterial efflux pump regulator. J. Bacteriol. 2009;191:7531–7537. doi: 10.1128/JB.00631-09. [DOI] [PMC free article] [PubMed] [Google Scholar]
- 31.Hinrichs W, Kisker C, Duvel M, Muller A, Tovar K, Hillen W, Saenger W. Structure of the Tet repressor-tetracycline complex and regulation of antibiotic resistance. Science. 1994;264:418–420. doi: 10.1126/science.8153629. [DOI] [PubMed] [Google Scholar]
- 32.Orth P, Schnappinger D, Hillen W, Saenger W, Hinrichs W. Structural basis of gene regulation by the tetracycline inducible Tet repressor-operator system. Nat. Struct. Biol. 2000;7:215–219. doi: 10.1038/73324. [DOI] [PubMed] [Google Scholar]
- 33.Schumacher MA, Miller MC, Grkovic S, Brown MH, Skurray RA, Brennan RG. Structural mechanisms of QacR induction and multidrug recognition. Science. 2001;294:2158–2163. doi: 10.1126/science.1066020. [DOI] [PubMed] [Google Scholar]
- 34.Schumacher MA, Miller MC, Grkovic S, Brown MH, Skurray RA, Brennan RG. Structural basis for cooperative DNA binding by two dimers of the multidrug-binding protein QacR. EMBO J. 2002;21:1210–1218. doi: 10.1093/emboj/21.5.1210. [DOI] [PMC free article] [PubMed] [Google Scholar]
- 35.Natsume R, Ohnishi Y, Senda T, Horinouchi S. Crystal structure of a γ-butyrolactone autoregulator receptor protein in Streptomyces coelicolor A3(2) J. Mol. Biol. 2003;336:409–419. doi: 10.1016/j.jmb.2003.12.040. [DOI] [PubMed] [Google Scholar]
- 36.Dover LG, Corsino PE, Daniels IR, Cocklin SL, Tatituri V, Besra GS, Futterer K. Crystal structure of the TetR/CamR family repressor Mycobacterium tuberculosis EthR implicated in ethionamide resistance. J. Mol. Biol. 2004;340:1095–1105. doi: 10.1016/j.jmb.2004.06.003. [DOI] [PubMed] [Google Scholar]
- 37.Frenois F, Engohang-Ndong J, Locht C, Baulard AR, Villeret V. Structure of EthR in a ligand bound conformation reveals therapeutic perspectives against tuberculosis. Mol. Cell. 2004;16:301–307. doi: 10.1016/j.molcel.2004.09.020. [DOI] [PubMed] [Google Scholar]
- 38.Gu R, Su C-C, Shi F, Li M, McDermott G, Zhang Q, Yu EW. Crystal Structure of the transcriptional regulator CmeR from Campylobacter jejuni. J. Mol. Biol. 2007;372:583–593. doi: 10.1016/j.jmb.2007.06.072. [DOI] [PMC free article] [PubMed] [Google Scholar]
- 39.Li M, Gu R, Su C-C, Routh MD, Harris KC, Jewell ES, McDermott G, Yu EW. Crystal structure of the transcriptional regulator AcrR from Escherichia coli. J. Mol. Biol. 2007;374:591–603. doi: 10.1016/j.jmb.2007.09.064. [DOI] [PMC free article] [PubMed] [Google Scholar]
- 40.Hernández A, Maté MJ, Sánchez-Díaz PC, Romero A, Rojo F, Martínez JL. Structural and functional analysis of SmeT, the repressor of the Stenotrophomonas maltophilia multidrug efflux pump SmeDEF. J. Biol. Chem. 2009;284:14428–14438. doi: 10.1074/jbc.M809221200. [DOI] [PMC free article] [PubMed] [Google Scholar]
- 41.Amaral L, Boeree MJ, Gillespie SH, Udwadia ZF, van Soolingen D. Thioridazine cures extensively drug-resistant tuberculosis (XDR-TB) and the need for global trials is now! Int. J. Antimicrob. Agents. 2010;35:524–526. doi: 10.1016/j.ijantimicag.2009.12.019. [DOI] [PubMed] [Google Scholar]
- 42.Hoffmann KM, Williams D, Shafer WM, Brennan RG. Characterization of the multiple transferable resistance repressor, MtrR, from Neisseria gonorrhoeae. J. Bacteriol. 2005;187:5008–5012. doi: 10.1128/JB.187.14.5008-5012.2005. [DOI] [PMC free article] [PubMed] [Google Scholar]
- 43.Le TBK, Schumacher MA, Lawson DM, Brennan RG, Buttner MJ. The crystal structure of the TetR family transcriptional repressor SimR bound to DNA and the role of a flexible N-terminal extension in minor groove binding. Nucleic Acids Res. 2011;39:9443–9447. doi: 10.1093/nar/gkr640. [DOI] [PMC free article] [PubMed] [Google Scholar]
- 44.Alguel Y, Meng C, Terán W, Krell T, Ramos JL, Gallegos M-T, Zhang X. Crystal structures of multidrug binding protein TtgR in complex with antibiotics and plant antimicrobials. J. Mol. Biol. 2007;369:829–840. doi: 10.1016/j.jmb.2007.03.062. [DOI] [PMC free article] [PubMed] [Google Scholar]
Associated Data
This section collects any data citations, data availability statements, or supplementary materials included in this article.