

Abstract
In retinal surgery, surgeons face difficulties such as indirect visualization of surgical targets, physiological tremor and lack of tactile feedback, which increase the risk of retinal damage caused by incorrect surgical gestures. In this context, intra-ocular proximity sensing has the potential to overcome current technical limitations and increase surgical safety. In this paper we present a system for detecting unintentional collisions between surgical tools and the retina using the visual feedback provided by the opthalmic stereo microscope. Using stereo images, proximity between surgical tools and the retinal surface can be detected when their relative stereo disparity is small. For this purpose, we developed a system comprised of two modules. The first is a module for tracking the surgical tool position on both stereo images. The second is a disparity tracking module for estimating a stereo disparity map of the retinal surface. Both modules were specially tailored for coping with the challenging visualization conditions in retinal surgery. The potential clinical value of the proposed method is demonstrated by extensive testing using a silicon phantom eye and recorded rabbit in vivo data.
Index Terms: Visual tracking, surgical tool tracking, stereo disparity estimation, proximity detection, stereo microscopy, retinal surgery
I. Introduction
Sight-threatening conditions such as retinal detachment and macular holes currently require technically challenging surgical interventions. Surgeons face several difficulties, starting with the indirect visualization of surgical targets, physiological hand tremor and lack of tactile feedback. In recent years, the first generation of robotic assistants has been developed for overcoming some of the challenges in retinal surgery. For active hand tremor cancellation and autonomous intra-operative guidance, solutions such as the SteadyHand robot [29] and the Micron manipulator [20] have been developed. Recently, micro robots [9] have been proposed for intra-ocular drug delivery. In addition, smart sensing tools such as the micro force sensor in [14] and the optical coherence tomography (OCT) instrument in [1] have been proposed for providing valuable intra-ocular measurements and active assistance for surgeons.
In this context, computer vision techniques have the potential for providing valuable intra-operative guidance and augmentation [10]. In this paper, we describe how the visual feedback provided by the stereo endoscope can be used for contactless proximity detection. The goal is to increase surgical safety by warning surgeons when the distance between surgical tools and the delicate intra-ocular structures is small and therefore avoid potentially dangerous unintentional collisions. The proposed system can be used to assist surgeons during intra-operative OCT scans [1] or in more common procedures such as vitrectomies.
Using stereo images, proximity can be detected when the difference between tool and retina stereo disparities is small. To this end, two modules were developed: a surgical tool tracking method and a retina disparity tracking method. In both modules, tracking is formulated as a direct visual tracking method [4]. For coping with the challenging visualization conditions in retinal surgery, a robust image similarity measure called the Sum of Conditional Variance (SCV) [17] is employed. The proposed methods were tested using images from a phantom eye and recorded in vivo rabbit experiments. In addition, a comparative study using ground-truth motion provided by the SteadyHand robot was performed.
This paper is organized as follows. In sections 2 and 3, we describe in detail the surgical tool tracking and retina disparity estimation modules, respectively. Section 4 describes how the two developed modules are combined for proximity detection. Section 5 describes the experiments conducted for validating the system. Finally, section 6 provides a conclusion and discussion on future work directions.
II. Visual tracking of surgical tools
A. Background
In this work, we focus on tracking surgical instruments that resemble the surgical pick shown in Figure 1. In the literature, works on surgical tool tracking can be coarsely categorized into two classes [12]: color-based and geometry-based approaches. In color-based approaches [8], [30], [33], tools are detected and tracked based on the color difference between tool and background. Artificial markers are often employed. In addition to an appearance tool model, geometry-based approaches also explore the shape of surgical tools [16], [28], [32]. Although tracking based on geometry information is generally more complex than color-based tracking, practical issues concerning bio-compatibility and sterilisability related to the use of artificial markers can be avoided.
Fig. 1.

(Bottom) Surgical tools inside the human eye and the eye phantom used in the experiments. (Top) Visualization through the microscope.
The challenges involved in tracking surgical instruments start with the illumination conditions during surgery. Surgeons often use a hand-held light pipe to illuminate the retina (Figure 1), causing shadows and highly variable lighting between frames. Exterior lighting (from the operating room) and inter reflections from the microscope lenses can also cause glares, further complicating the visual tracking task. In addition, image distortions caused by the eye, microscope and contact lenses used during surgery are difficult to correct due to their complexity and variability (Figure 2).
Fig. 2.

Typical images of a surgical tool tip (hypodermic needle 25ga) during experiments with an eye phantom.
For coping with the challenging conditions cited above, tool tracking is formulated as a direct visual tracking method based a robust similarity metric called Sum of Conditional Variance (SCV) [17]. The SCV is a metric closely related to the Correlation Ratio (CR) [21]. It was originally proposed in the medical imaging domain for registering multi-modal images. The SCV was recently explored in the visual tracking context in [19] and it was chosen in this specific context for its low computational requirements and invariance to nonlinear illumination variations, which enables tracking to cope with the challenging illumination conditions described earlier. Compared to similarity measures such as such as Normalized Cross Correlation or Mutual Information [7] (which has been employed in our previous work in [18]), the SCV has a significantly smaller computational complexity. Furthermore, efficient optimization strategies can be derived for the SCV [19], allowing real-time tracking performance to be easily achieved without any dedicated hardware (e.g. GPUs).
B. Visual tracking using the Sum of Conditional Variance (SCV)
Let I and T be (n×m) matrices representing the current and reference images of a surgical tool, respectively. Let x = (x, y) be a vector containing pixel coordinates such that (x, y) ∈ {1, 2, …, m}×{1, 2, …, n}, and w(x, p) a transformation function of parameters p that maps pixel positions x from the reference image T (x) to the current image I from the microscope: x ↦ w(x, p). In this work, the surgical tool is tracked using a 3 DOF motion model (an Euclidean transformation). Furthermore, the tool tip is tracked separately on both stereo images from the microscope.
Let I ∈ [0, dI] and T ∈ [0, dT], where dI and dT are the number of possible discrete pixel intensity values in I and T, respectively. The SCV between images I and T can be computed as:
| (1) |
with:
| (2) |
where
 (.) is the expectation operator. Notice that the equation above is equivalent to the SSD if we assume T̂(x) =
(I(w(x, p))|T (x)) = T (x), showing that the SSD can be considered as a specific case of the SCV.
(.) is the expectation operator. Notice that the equation above is equivalent to the SSD if we assume T̂(x) =
(I(w(x, p))|T (x)) = T (x), showing that the SSD can be considered as a specific case of the SCV.
The term T̂ is computed from the joint intensity distribution between I and T. The joint distribution P is discrete (i.e. a dT × dI matrix), where each element P (i, j) (also called bin) represents the probability of the intensity co-occurrence (I(w(x, p)) = i, T (x) = j) for a given pixel x:
| (3) |
where q = n · m, δ(s) = 1 for s = 0, δ(s) = 0 otherwise and i ∈ [0, dI ] and j ∈ [0, dT ]. Hence, the conditional expectation can be computed as:
| (4) |
where α = Σi P (i, T (x)). During tracking, the expected image T̂ is computed only once for every incoming frame using I(w(x, p)) from the previous tracking step. This step allows T̂ to ‘adapt’ to the current illumination conditions. Notice the low computational complexity compared to techniques that require the estimation of photometric correction parameters at every iteration [2], [23]. The specific reference images T (x) used in equation (2) is discussed in details in subsection D.
C. Invariance to illumination variations
Figure 3 shows a comparison between four similarity measures in different tracking conditions. As shown in Figure 3(b), measures such as the SSD vary largely under variations of brighness and contrast, while measures such as the NCC and the SCV remain invariant. In fact, all similarity measures can be derived from the joint intensity distribution. For instance, the SSD is a measure of the probability density deviation from the diagonal elements of the joint distribution. For this reason, it is affected by any violation of the brighness constancy between images. On the other hand, the NCC is a measure of the affine dependency between intensity levels on a pair of images. For this reason, it is invariant to linear variations such as the one shown in Figure 3(b). The SCV is a measure of the deviation from the conditional expected intensity between a pair of images. As discussed in [19], the SCV is the only measure invariant to non-linear illumination changes. Finally, the MI is a measure of the sparsity of the joint distribution between a pair of images. When images do not match, the joint distribution is spread (Figure 3(c)) and similarity scores is low. Notice MI is also robust to most types of illumination variation but the similarity score is not invariant due to the fact that the MI penalizes by the clustering of the marginals in the joint intensity distribution [13].
Fig. 3.

(a) The joint intensity distribution of an image with itself (b) illumination changes (c) misaligned images (d) an image with its inverse. The x and y axes correspond to intensity bins of the reference and target images, respectively.
An important issue arises from the fact that distributions such as the one illustrated in Figure 3(d) obtain high similarity scores, even though they make no sense in practice. Intuitively, it is very unlikely that bright pixels turn dark and dark pixels turn bright simultaneously in sequential frames. In our previous work in [18], we circumvented this problem by applying weights to the joint intensity distribution and reducing the similarity score of configurations such as in Figure 3(d). However, the weighted MI formulation proposed in [18] cannot be easily applied in a gradient-based optimization setting. In this work, this issue is avoided by computing the joint distribution only once per frame. In this manner, we make the assumption that inter-frame illumination variations are small and avoid issues with joint distribution configurations with little physical meaning.
D. Optimization
The direct visual tracking problem can therefore be written as the problem of finding the transformation parameters p that minimize the SCV:
| (5) |
In our work, we decouple the estimation of the parameters p due to the geometry of the tracked tool. For estimating the 3 transformation parameters, tracking is divided into two stages:
Gradient-based tracking - the tool rotation and vertical translation component are estimated using the Efficient Second-Order Minimization (ESM) [4]. For this step, the reference image T (x) shown in Figure 4(a) is used.
Brute force search - For an accurate estimation of the tool tip position, a search along the tool shaft is performed at discrete 0.25 pixel steps (see illustration in Figure 4(b)).
Fig. 4.
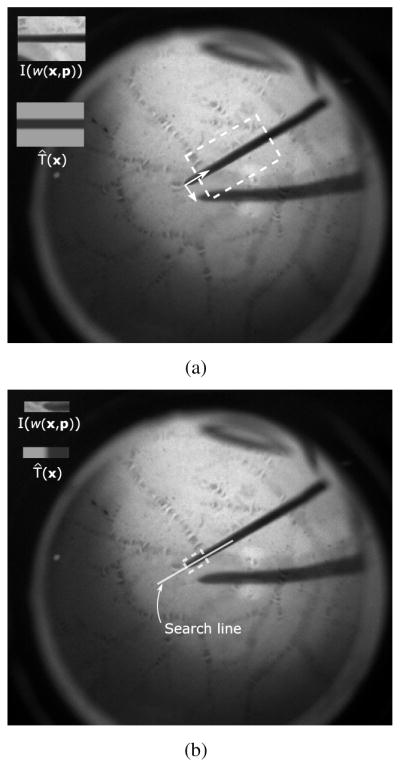
(a) Gradient-based estimation of tool rotation and vertical translation (b) Brute force search along tool shaft for estimating the tool tip position. Notice different reference images T (x) are used in each specific optimization step.
This decoupling has shown to be necessary in practice for a more accurate tool tip estimation. The specific appearance models for the tool in each step above were chosen to represent a dark shaft on a bright background and were designed to avoid possible tracking lock onto specific background patterns. Since we use the SCV, tracking can adapt to different illumination conditions and the reference images T (x) in Figure 4 remain constant across all experiments. Notice also that different reference images T (x) are used in the two optimization steps described above.
Finally, another advantage of the SCV over measures such as NCC or MI is the fact that efficient optimization techniques such as the ESM can be easily derived for the SCV. In the case of the NCC and MI, a Newton optimization method with a constant Hessian must be employed [7], which has a considerably slower convergence speed compared to the ESM [19].
E. Handling scale changes
In practice, significant changes in tool scale occur very seldom when tracking inside the eye. However, a method for coping with slight changes in the tool scale in the images can increase tracking stability. For this purpose, we adopt a method similar to the scale estimation in mean-shift tracking [5]: a discrete variation of ±1px in the tool shaft diameter is applied to the reference tool image. The SCV between the modified template T (x) and the most recent warped image I(w(x, p)) is computed and template size that yields the smallest SCV score is used for tracking in the next incoming frame.
III. Retina disparity tracking
A. Background
Depth estimation from stereo images is a classic computer vision problem [22]. Given a rectified stereo rig [11], relative depth can be recovered by estimating the horizontal disparity between stereo images. Furthermore, if the camera calibration parameters of the stereo rig are known, then 3D information can be inferred from the estimated stereo disparity. In our work, we avoid the complex problem of calibrating the microscope cameras and identifying lens model parameters by working only with stereo disparities.
In retinal surgery, stereo disparity estimation is made difficult by the same issues mentioned in the previous section: lens distortions and significant image blur. Under such disturbances, methods based on matching of salient image features [26] have limited performance. On the other hand, direct visual tracking methods (also known as template-based methods) perform better due to the fact that disparity is estimated using texture information from a large region of the image. This allows the disparity estimation to function in cases where only low frequency texture components are available in the images.
Compared to similar visual-based tracking systems for endoscopic surgery [25], [31], the simpler geometry of the retinal surface offers certain advantages: simpler disparity map parameterizations can be employed and tracking is less affected by the complex illumination conditions.
B. Method
For detecting proximity between the surgical tool and the retina, the accurate estimation of a disparity map of the retina is required. To this end, a region of interest in the left camera image is selected as template (see Figure 5). Only the central region on the image is considered where the estimation of the retinal surface disparity is not severely affected by lens distortions. Here we consider that the surgical microscope cameras are mechanically rectified (see Appendix 1 for more details). The objective is to estimate the parameters d of the horizontal disparity warping that best align the the selected template R to the right camera image Ir:
| (6) |
Fig. 5.

The disparity map of the retinal surface is estimated using a direct method. Notice that only the central eye region on the image is considered.
Notice the difference between the disparity transformation function wd(x, d) above and the tool transformation function w(x, p) used in section II-B. The Sum of Squared Differences (SSD) is used as similarity measure between images and the minimization problem above is solved using the Efficient Second-Order Minimization (ESM). Due to the relatively simple geometry of the retinal surface, robust image similarity measures such as the SCV are not required because differences in the illumination conditions between cameras are negligible.
For defining the horizontal warping function wd(x, d), certain assumptions about the geometry of the retinal surface must be made. We have tested four models which have been previously used in the literature: a cubic B-spline deformable model with 16 control points [6], [18], a 6 DOF quadratic model [24], a 3 DOF affine model and a simple 1 DOF translation model. A comparative analysis was conducted using phantom eye from Figure 1 and results can be found in Appendix 1. In practice, we have observed that due to the shallow depth of field of microscopic lens and other disturbances that cause loss of visual information, the estimation of a disparity map with a large number of degrees of freedom is prone to error. Furthermore, surgeons often place a contact lens on top of the patient’s eye during surgery for a magnified view of the retina, which narrows the field of view to 15–40 degrees. For this reason, a 1 DOF model is adopted in our system (i.e. disparity is modeled as a horizontal translation). Notice that in this work we assume that the surgical microscope cameras are mechanically rectified, which allows us to consider perspective distortions between stereo images negligible.
C. Occlusion maps
Another issue that must be taken into consideration in the estimation of the retina disparity map is the occlusion by surgical tools. Since the surgical tool has a different stereo disparity than the retinal surface, the corresponding pixels on both stereo images must be detected and removed from the retina disparity computation in equation (6) to avoid errors. To this purpose, we use the tool position estimated by the tool tracking module for creating an ‘occlusion map’. An example of a typical occlusion map is given in Figure 6, where pixels marked in black correspond to the surgical tool. Let the pixels belonging to the retinal surface on both left and right images be denoted by Al and Ar, respectively. Equation (6) can be rewritten as:
| (7) |
where A = Al ∩ Ar. The set A can be easily estimated by a logical AND operation between the occlusion maps from left and right images (Figure 6(c)).
Fig. 6.

The position of the surgical tools estimated by the tool tracking module is used for creating an occlusion map and removing pixels corresponding to the tool from the disparity map estimation. (a) left and right camera images of the tool and retina (b) tool tip position and scale available from the tool tracking module (c) occlusion maps, where pixels corresponding to the tool are marked in black.
IV. Proximity detection
Proximity between the surgical tools and the retinal surface can be detected when the difference between tool and retina disparities is small (below a certain threshold). By working only with pixel disparity, we are able to avoid the extremely complex task of modeling and identifying the microscope and eye lens distortion parameters. A schematic overview of the system is given in figure 7.
Fig. 7.

A schematic overview of the proximity detection method.
A. Defining safety limits
In the proposed system, the disparity difference threshold for a safe distance between tools and retina is manually defined by the surgeon. This distance is defined in pixels and can be adjusted manually according to the desired safety level. Although the diameter of the surgical tool shaft can be used as reference for an approximated conversion between pixels and millimeters, this reference for convertion only holds for each image individually since the baseline for the stereo cameras is unknown. Therefore, in order to define a meaninful safety limit for proximity warnings, the ratio r between disparity and millimeters must be estimated. Notice this ratio is different than the conversion between pixels and millimeters in each individual image mentioned earlier. The ratio r can be achieved by performing a known motion parallel to the left camera axis (recall the left camera center is taken as reference). In Sections V-A3 and V-B we describe in details how we estimate this ratio using the SteadyHand robot [29].
B. Measuring proximity detection confidence
For additional safety, a measure of detection confidence is necessary for warning surgeons that the quality of the visual feedback is too low for reliable proximity detection. This is done by analyzing three confidence measures: η1, η2 and η3. Measures η1, η2 come from the tool tracking module, while η3 is a measure from the disparity tracking module. If any of the scores falls below a specific threshold, the proximity detection system is suspended and a message is shown to the user warning that no reliable proximity detection is possible at the moment.
From the tool tracking module, the confidence score η1 corresponds to the smallest normalized cross correlation (NCC) score between expected and current warped images of the tool, T̂(x) and I(w(x, p)) respectively, computed for left and right images. The NCC is chosen in this context because it is a bounded measure (η1 ∈ [−1, 1]). Notice this specific NCC score computed for η1 uses the expected template T̂(x) from the SCV instead of the reference image T (x). The measure η2 is defined as the vertical difference between the estimated tool tip position on both stereo images. If η2 rises above a certain threshold ε2, tracking is suspended. In a similar fashion to η1, η3 is obtained by computing the NCC score between R(x) and Ir(wd(x, d) in the disparity map estimation. In practice, tracking is suspended if η1 or η3 are below respective thresholds ε1 and ε3. In such events, tool tracking must be manually re-initialized. In practice, the threshold values were empirically chosen as ε1 = ε3 = 0.4 and ε2 = 5 pixels. In the next section, these practical issues are discussed in detail.
V. Experiments
Experiments are divided into three parts. First, we analyze tool tracking performance under illumination variations, partial occlusions and rapid motions. A comparison between the SCV and the standard SSD is also provided. We also perform an evaluation of the tool tracking accuracy using the SteadyHand robot. Next, we evaluate the performance of the retina disparity map estimation method. Finally, we evaluate the efficiency of the proposed proximity detection system.
For acquiring images, two Grasshopper 20S4C cameras (Point Grey, Canada) coupled to a Carl Zeiss OPMI MD stereo microscope acquiring 1600×1200 pixel images at 30fps were used. The acquired images are converted to 8-bit grayscale (dI = dT = 256). Since the retina does not occupy the entire full resolution microscopic image, we crop a 500×500 pixel region of interest on the images containing the visible retina by intensity thresholding. The proposed proximity detection system has been developed in C++ using OpenCV and the CISST library developed at JHU [15]. The system runs on a Dell Precision PC with a multicore Xeon 2.13GHz Processor at framerate.
A. Tool tracking performance
Next, we evaluate the accuracy of the tool tracking method proposed in Section II. The size of the tool reference images T (shown in steps 1 and 2 of Figure 4) was defined as 150×120 and 10 × 50 pixels, respectively. These specific sizes were chosen according to the image resolution and remain constant for all experiments. All experiments were conducted on stereo images, unless mentioned otherwise.
1) Phantom experiments
The eye phantom is used to evaluate the performance of the proposed tool tracking method under three aspects: illumination variations, partial occlusions and fast tool motions. Figure 8 shows tool tracking under challenging illumination conditions. It is important to highlight that tracking must also be robust to occlusions caused by the tool shadow when the tool is close to the retinal surface. A tracking performance comparison between the SCV and the SSD can be found in the supplementary videos for the sequence in Figure 9. As shown in the videos, tracking using SSD eventually fails due to large illumination variations.
Fig. 8.

Left camera images showing tracking of surgical tools under challenging illumination conditions in a phantom human eye. The solid line indicates the tracked portion of the tool. On the bottom, the current warped image I(w(x, p)) and expected template T̂(x) for the tool shaft, respectively. Notice also the change in tool length in the expected templates.
Fig. 9.

(Top) The large vertical difference at t = 53.0s indicated in the plot is caused by an error in the tool tip estimation in the left camera image. (Bottom) Vertical difference between tracked tool tip in left and right images.
Although rapid tool motions are not expected during real surgeries, we analyze the proposed tool tracking method performance in these conditions on images extracted from a single camera. At every new frame, the gradient descent step is initialized using the tool position in the previous image. In practice, the SCV convergence radius is only as large as the tool shaft. If large inter-frame displacements occur and the tool shaft position in the previous and current images do not overlap, tracking may converge to a local minimum.
An important information from tool tracking is the vertical difference between the tracked tool tips on both left and right cameras. Ideally, the vertical difference between both cameras should be zero but since no stereo constraints are imposed, inconsistent results may occur. Figure 9 illustrates the vertical difference for the tracking experiments shown in Figure 8. The error plot indicates that even though no tracking constraints are imposed, the vertical difference η2 is usually much smaller than the safety threshold ε2 = 5 pixels (section IV-B). However, inconsistent results can be detected in t = 53.0s, when the difference is above 10 pixels. This is caused by an error in the estimation of the tool tip in the left camera image (Figure 9(top)). In such cases, tracking is suspended and must be manually re-initialized.
In case of tracking loss, the surgeon must move the tool to a pre-defined region in the center of the eye for tracking to be manually initialized. This practical side of the system can be improved by incorporating a surgical tool detector such as [27] for reestablishing tracking in the event of a failure.
2) Experiments with in vivo data
The proposed tool tracking method has been applied to several image sequences extracted from an in vivo experiment conducted on a rabbit eye. A 2kg Dutch Belted rabbit was chosen for the experiment and a lensectomy and vitrectomy were performed prior to the image acquisition. A flat 30 degree contact lens (Dutch Ophthalmic) was placed on top the cornea to eliminate optical effects of the cornea. In comparison, the rabbit eye is about 70% of the diameter of a human eye and furthermore, in this specific experiment the rabbit pupil was not fully dilated (due to an inflammation of the iris). This is slightly compensated by a lensectomy to increase the field of view inside the eye. Despite of these difficulties, the proposed tracking method is capable of accurately retrieving the tool tip position, even in presence of large illumination variations, clutter and unmodeled changes in the tool appearance (see Figure 10).
Fig. 10.

The proposed method tracking method for estimating the tool position in images from an in vivo experiment conducted on a rabbit eye. The solid line indicates the tracked portion of the tool.
3) Experiments with the SteadyHand robot
For a quantitative evaluation of the tool tracking performance, we compared the a known motion executed by the SteadyHand robot (1.0 μm precision [29]) with the estimated motion in pixels. We used the setup shown in Figure 11 for simulating the phantom eye optics while avoiding trocart contact forces which compromise the precision of the robot motion. In the experimental setup, the robot base is approximately parallel to the imaging plane of the stereo microscope.
Fig. 11.

Setup for the comparative experiments using the SteadyHand robot.
In the first experiment, the robot moved the tool to 8 points in space corresponding to the corners of a 1.0 × 1.0 × 2.0 mm cube. The estimated tool tip motion and disparity in pixels is plotted in Figure 12(top). The left camera image is used as reference for the disparity computation. The two 1.0 × 1.0 mm cube facets τ1 and τ2 defined by points (p1, .., p4) and (p5, .., p8) respectively, are parallel to the robot base and camera plane. For assessing the accuracy of the retrieved motion, we measured the distance in pixels between the adjacent corners from each facet parallel to the camera plane. As suggested in section IV-A, the diameter of the surgical tool shaft is used as reference for an approximated conversion between pixels and millimeters. In the experiment, the tool shaft size in pixels and millimeters is equal to 0.5 mm and 10 pixels, respectively, which yields a ratio of 20 pixels per millimeter. The converted average and standard deviation of the estimated distance between corners is 1.03 mm and 0.3 mm, respectively. Even though these results indicate that high precision and sub-milimeter accuracy can be achieved using the proposed method, it is still not accurate enough for tasks such as vein cannulation [3], which require higher accuracy (under 200 μm). A possible solution to this problem is to increase the camera resolution for increasing tracking robustness to disturbances caused by partial occlusions and distortions or increase magnification via microscope zoom. As indicated in Table I, the points belonging to the same plane have roughly the same stereo disparity. This is expected since the described motion is small. It is also important to highlight the noticeable difference in disparity between planes τ1 and τ2, which indicates that small variations in depth can be easily detected from the difference in stereo disparity. Taking the average disparity difference between the two planes, the disparity to millimeters ratio r introduced in Section IV-A in this experiment is approximately 5.35 px/mm.
Fig. 12.

(Top) The estimated tool tip motion and disparity in pixels for experiments using the SteadyHand robot. (Bottom) Second experiment using the SteadyHand robot for estimating the disparity to millimeters ratio.
Table I.
Pixel coordinates and stereo disparity for points highlighted in Figure 12.
| x | y | disparity | ||
|---|---|---|---|---|
|
| ||||
| τ1 | p1 | 240.7 | 155.2 | 19.0 |
| p2 | 245.0 | 135.0 | 19.2 | |
| p3 | 265.0 | 139.5 | 19.0 | |
| p4 | 260.7 | 159.2 | 19.0 | |
|
| ||||
| τ2 | p5 | 238.5 | 161.7 | 15.5 |
| p6 | 243.5 | 142.2 | 17.0 | |
| p7 | 261.7 | 146.5 | 16.5 | |
| p8 | 258.2 | 165.5 | 16.5 | |
In the second experiment, we recomputed the disparity to millimeters ratio r by performing five 1.0 mm steps parallel to the the left camera axis. Confirming the ratio found in the previous experiment, the results plotted in Figure 12(bottom) show a ratio r of approximately 5.24 px/mm.
B. Retina disparity tracking performance
For evaluating the accuracy of the retina disparity estimation proposed in Section III, we vary the relative distance from a planar surface to the microscope and measure the variations in pixel disparity (see Figure 13). In all experiments in this section, the template image R(x) (Figure 5) is a 100×100 pixel window centered on the left camera image, for avoiding large lens distortions. We varied the distance from ±0.5 cm in 1.0 mm intervals. From the plot in Figure 13, we can observe that very small depth variations can be easily detected from the stereo disparity values (as in the experiments described earlier in this section). Furthermore, the plot shows the relationship between disparity and depth is approximately linear (r = 5.3 pixels per millimeter for the given displacement interval). Notice the estimated ratio is consistent with the disparity difference between planes τ1 and τ2 in Table I. It is important to notice that the total displacement in this experiment was 1 cm, which is very large in the context of retinal surgery. Due to the shallow depth of field of the surgical microscope, images are blurry in the extremes of the displacement interval. However, the disparity estimation is still able to provide accurate results. This is an advantage of using direct methods, which allow the disparity estimation to function in cases where only low frequency texture components are available in the images.
Fig. 13.

Measuring pixel disparities as a function of depth using the proposed disparity tracking module. As shown in the plot, the relationship between disparity and depth is roughly linear and small variations in depth can be easily detected from the stereo disparity values.
C. Proximity detection
For demonstrating its practical value, the two modules developed in this paper were combined for detecting proximity between the surgical tool and the retinal surface. The proximity threshold was set to 10 pixels in the phantom and rabbit experiments (which corresponds to 2.0 mm using the estimated ratio r in section V-B).
Using the phantom eye, detection efficiency was assessed using a surgical pick with a built-in 2DOF force sensor [14] for providing contact forces as ground-truth data. As expected, the force sensor readings (the norm of forces applied on the tool shaft) shown in Figure 15 coincide with the proximity warnings given by the proposed proximity detection method.
Fig. 15.

(Top) The difference between tool tip and retina stereo disparities in the phantom eye (the proximity threshold shown in dashed is set to 10 pixels). (Bottom) The norm of forces applied on the tool shaft overlaid on the proximity warnings estimated by the proposed method.
The proposed system also provides consistent proximity detection results on experiments conducted using recorded in vivo rabbit data (see Figure 14 and supplementary videos). Since no force information is available for the in vivo experiments, a visual evaluation of the detection results is performed using the tool shadow, which is a cue often used by surgeons as means of detecting proximity between tool and retina during the surgical procedure. It is important to highlight the fact that in comparison to the tool shadow, the proposed method has the advantage of working with all types of illumination sources (e.g. chandeler lights) and does not dependent on the relative position between the light pipe and retinal surface. The proposed system also has the potential to assist in surgical training, reducing the time required for novice surgeons to learn to estimate the distance between tool and retina.
Fig. 14.

(Top) The tool tip and retina stereo disparities in a rabbit eye. (Bottom) the absolute difference between stereo disparities and the chosen proximity threshold (10 pixels).
VI. Conclusion and future work
In this paper we propose a vision-based proximity detection method for retinal surgery. The system complements recently developed smart surgical tools, increasing surgical safety by avoiding unintentional collisions between surgical tools and retina. It comprises two major components: a surgical tool tracking module and a retina disparity tracking module. Both modules have been specifically tailored to cope with the challenging visualization conditions in retinal surgery. Extensive experimentation with phantom and in vivo rabbit data attest the practical value of the proposed method in a real clinical scenario.
Future work will focus on incorporating stereo constraints to the tracking of surgical tools for improving tracking stability and cross checks for increasing the accuracy of the retina disparity map estimation. Currently, we are working on incorporating methods for automatically detecting the surgical tools in the microscopic images for automatic tracking initialization. We are also working on improving the appearance model of surgical tools for coping with more complex appearance changes and expanding the tool tracking module for tracking surgical tools with more complex geometrical models such as forceps and cutters. Finally, we are studying the replacement of the visual warning currently displayed on the screen by an auditory warning message to reduce the cognitive load for the surgeon.
Supplementary Material
Acknowledgments
This work was supported in part by the NIH Bioengineering Research Partnership grant NIH 1R01 EB007969. The authors would like to thank Dr. James Handa and Dr. Peter Gehlbach from the Wilmer Eye Institute at Johns Hopkins for acquiring the in vivo data used in the experiments and Balázs Vágvölgyi for the assistance with the CISST library.
Contributor Information
Marcin Balicki, Email: balicki@jhu.edu.
Raphael Sznitman, Email: sznitman@jhu.edu.
Eric Meisner, Email: emeisner1@jhu.edu.
Russell Taylor, Email: rht@jhu.edu.
Gregory Hager, Email: hager@jhu.edu.
References
- 1.Balicki M, Han J, Iordachita I, Gehlbach P, Handa J, Taylor R, Kang J. Single fiber optical coherence tomography microsurgical instruments for computer and robot-assisted retinal surgery. Medical Image Computing and Computer-Assisted Intervention (MICCAI ’09), volume 5761 of Lecture Notes in Computer Science (LNCS); London, UK. Springer; 2009. pp. 108–115. [DOI] [PubMed] [Google Scholar]
- 2.Bartoli A. Groupwise geometric and photometric direct image registration. IEEE Transactions on Pattern Analysis and Machine Intelligence (PAMI) 2008;30(12):2098–2108. doi: 10.1109/TPAMI.2008.22. [DOI] [PubMed] [Google Scholar]
- 3.Becker B, Voros S, Lobes L, Jr, Handa J, Hager G, Riviere C. Retinal vessel cannulation with an image-guided handheld robot. Proceedings of IEEE International Conference of the Engineering in Medicine and Biology Society (EMBC’10); October 2010; pp. 5420–5423. [DOI] [PMC free article] [PubMed] [Google Scholar]
- 4.Benhimane S, Malis E. Homography-based 2D Visual Tracking and Servoing. International Journal of Robotics Research. 2007;26(7):661–676. [Google Scholar]
- 5.Comaniciu D, Ramesh V, Meer P. Kernel-based object tracking. IEEE Transactions on Pattern Analysis and Machine Intelligence (PAMI) 2003;25(5):564–577. [Google Scholar]
- 6.Corso J, Ramey N, Hager G. Technical report. The Johns Hopkins University; 2003. Stereo-Based Direct Surface Tracking with Deformable Parametric Models. CIRL Lab Technical Report 2003-02. [Google Scholar]
- 7.Dame A, Marchand E. Accurate real-time tracking using mutual information. Proceedings of the IEEE Int. Symp. on Mixed and Augmented Reality (ISMAR ’10); Taipei, Taiwan. October 2010.pp. 47–56. [Google Scholar]
- 8.Doignon C, Nagoette F, de Mathelin M. Segmentation and guidance of multiple rigid objects for intra-operative endoscopic vision. Proceedings of the International Workshop on Dynamical Vision, in conjunction with ECCV’06; Graz, Austria. 2006. [Google Scholar]
- 9.Ergeneman O, Bergeles C, Kummer M, Abbott J, Nelson B. Wireless intraocular microrobots: Opportunities and challenges. In: Rosen J, Hannaford B, Satava R, editors. Surgical Robotics: Systems, Applications, and Visions. chapter 13. Springer; 2010. pp. 271–311. [Google Scholar]
- 10.Fleming I, Voros S, Vagvolgyi B, Pezzementi Z, Handa J, Taylor R, Hager G. Intraoperative visualization of anatomical targets in retinal surgery. IEEE Workshop on Applications of Computer Vision (WACV’08); 2008. pp. 1–6. [Google Scholar]
- 11.Fusiello A, Trucco E, Verri A. A compact algorithm for rectification of stereo pairs. Machine Vision Applications. 2001 Jul;12(1):16–22. [Google Scholar]
- 12.Groeger M, Arbter K, Hizinger G. Motion tracking for minimally invasive robotic surgery. I-Tech Education and Publishing. 2008 Jan;:117–148. [Google Scholar]
- 13.Hermosillo G, Chefd’Hotel C, Faugeras O. Variational methods for multimodal image matching. International Journal of Computer Vision. 2002;50:329–343. [Google Scholar]
- 14.Iordachita I, Sun Z, Balicki M, Kang J, Phee S, Handa J, Gehlbach P, Taylor R. A sub-millemetric, 0.25 mn resolution fully integrated fiber-optic force sensing tool for retinal microsurgery. International Journal of Computer Assisted Radiology and Surgery (IJCARS) 2009;4(4):383–390. doi: 10.1007/s11548-009-0301-6. [DOI] [PMC free article] [PubMed] [Google Scholar]
- 15.Laboratory of Computational Sensing and Robotics – Johns Hopkins University. CISST software library. 2011 http://trac.lcsr.jhu.edu/cisst/
- 16.Pezzementi Z, Voros S, Hager G. Articulated object tracking by rendering consistent appearance parts. Proceedings of IEEE International Conference on Robotics and Automation (ICRA’09); Kobe, Japan. May 2009.pp. 3940–3947. [Google Scholar]
- 17.Pickering M, Muhit AA, Scarvell JM, Smith PN. A new multi-modal similarity measure for fast gradient-based 2d–3d image registration. Proceedings of IEEE International Conference of the Engineering in Medicine and Biology Society (EMBC’09); Minneapolis, USA. 2009. pp. 5821–5824. [DOI] [PubMed] [Google Scholar]
- 18.Richa R, Balicki M, Meisner E, Sznitman R, Taylor R, Hager G. Visual tracking of surgical tools for proximity detection in retinal surgery. Information Processing in Computer Assisted Interventions (IPCAI’11); Berlin, Germany. 2011. pp. 55–66. [Google Scholar]
- 19.Richa R, Sznitman R, Taylor R, Hager G. Visual tracking using the sum of conditional variance. Proceedings of IEEE Conference on Intelligent Robots and Systems (IROS’11); San Francisco, USA. 2011. pp. 2953–2958. [Google Scholar]
- 20.Riviere C, Rader R, Thakor N. Adaptive canceling of physiological tremor for improved precision in microsurgery. Proceedings of IEEE Transactions on Biomedical Engineering. 1998;45(7):839–846. doi: 10.1109/10.686791. [DOI] [PubMed] [Google Scholar]
- 21.Roche A, Malandain G, Pennec X, Ayache N. The correlation ratio as a new similarity measure for multimodal image registration. Medical Image Computing and Computer-Assisted Intervention (MIC-CAI’98), volume 1496 of Lecture Notes in Computer Science (LNCS); Cambridge, USA. Springer; 1998. pp. 1115–1124. [Google Scholar]
- 22.Scharstein D, Szeliski R. A taxonomy and evaluation of dense two-frame stereo correspondence algorithms. International Journal of Computer Vision. 2002;47(1–3):7–42. [Google Scholar]
- 23.Silveira G, Malis E. Unified direct visual tracking of rigid and deformable surfaces under generic illumination changes in grayscale and color images. International Journal of Computer Vision. 2010;89(1):84–105. [Google Scholar]
- 24.Stewart C, Tsai C-L, Roysam B. The dual-bootstrap iterative closest point algorithm with application to retinal image registration. IEEE Transactions on Medical Imaging. 2003 Nov;22(11):1379–1394. doi: 10.1109/TMI.2003.819276. [DOI] [PubMed] [Google Scholar]
- 25.Stoyanov D, Darzi A, Yang GZ. A practical approach towards accurate dense 3D depth recovery for robotic laparoscopic surgery. Computer Aided Surgery. 2005 Jul;4(10):199–208. doi: 10.3109/10929080500230379. [DOI] [PubMed] [Google Scholar]
- 26.Stoyanov D, Scarzanella M, Pratt P, Yang GZ. Real-time stereo reconstruction in robotically assisted minimally invasive surgery. Medical Image Computing and Computer-Assisted Intervention (MIC-CAI ’10), volume 6361 of Lecture Notes in Computer Science (LNCS); London, UK. Springer; 2010. pp. 275–282. [DOI] [PubMed] [Google Scholar]
- 27.Sznitman R, Basu A, Richa R, Handa J, Gehlbach P, Taylor R, Jedynak B, Hager G. Unified detection and tracking in retinal microsurgery. Medical Image Computing and Computer-Assisted Intervention (MICCAI’11), Lecture Notes in Computer Science (LNCS); Toronto, Canada. Springer; 2011. page to appear. [DOI] [PubMed] [Google Scholar]
- 28.Sznitman R, Rother D, Handa J, Gehlbach P, Hager G, Taylor R. Adaptive multispectral illumination for retinal microsurgery. Medical Image Computing and Computer-Assisted Intervention (MICCAI’10), volume 6363 of Lecture Notes in Computer Science (LNCS); London, UK. Springer; 2010. pp. 465–472. [DOI] [PubMed] [Google Scholar]
- 29.Taylor R, Jensen P, Withcomb L, Barnes A, Kumar R, Stoianovici D, Gupta P, Wang Z, Dejuan E, Kavoussi L. A steady-hand robotic system for microsurgical augmentation. The International Journal of Robotics Research (IJRR) 1999;18(12):1201–1210. [Google Scholar]
- 30.Tonet O, Thoranaghatte R, Megali G, Dario P. Tracking endoscopic instruments without a localizer: a shape-analysis-based approach. Computer Aided Surgery. 2007;12(1):35–42. doi: 10.3109/10929080701210782. [DOI] [PubMed] [Google Scholar]
- 31.Vinsentini-Scarzanella M, Merrifield R, Stoyanov D, Yang G-Z. Tracking of irregular graphical structures for tissue deformation recovery in minimally invasive surgery. Medical Image Computing and Computer-Assisted Intervention (MICCAI’10), volume 6363 of Lecture Notes in Computer Science (LNCS); London, UK. Springer; 2010. pp. 261–268. [DOI] [PubMed] [Google Scholar]
- 32.Voros S, Orvain E, Long JA, Cinquin P. Automatic detection of instruments in laparoscopic images: a first step towards high level command of robotized endoscopic holders. The International Journal of Robotics Research (IJRR) – Special Issue on Robot Vision. 2007;26(11–12):173–119. [Google Scholar]
- 33.Wei GQ, Arbter K, Hizinger G. Real-time visual servoing for laparoscopic surgery. Proceedings of IEEE International Conference of the Engineering in Medicine and Biology Society (EMBC’97); Chicago, USA. 1997. pp. 40–45. [DOI] [PubMed] [Google Scholar]
Associated Data
This section collects any data citations, data availability statements, or supplementary materials included in this article.