Abstract
The goal of this study was to measure characteristics of seat loading in manual wheelchair users with complete spinal cord injury (SCI). Pressure distribution on the seating area of 25 adult males with SCI and eight non-injured adult males was measured in a relaxed and an upright posture on a standardized hard surface. Subjects with SCI were also tested in their wheelchairs. Maximum pressure, contact area, area of the highest pressure, and three asymmetry indices were compared. Subjects with SCI have higher pressure distributed over a smaller area, have a much smaller contact area, and distribute the loading more asymmetrically than non-injured subjects. Upright posture only corrects for some loading problems, while the wheelchair corrects for more loading parameters. Routine clinical seat loading evaluation may lead to improved chair and cushion selection for patients with SCI and may even alert clinicians to patients at high risk for complications due to high or unbalanced loads.
Keywords: Paraplegia, Sitting, Pressure distribution, Contact area, Load imbalance
Introduction
Spinal cord injury (SCI) occurs in a substantial proportion of trauma. A study from major trauma centers in the United States reports that SCI occurred in 2.6% of trauma patients, or approximately 1 in 40 patients, reported between 1982 and 1989, of whom 79% were male [4]. Wheelchair-ambulating patients with SCI are often susceptible to joint pain, spine deformity, or pressure sores [5, 6, 9, 10, 13].
Pressure on the seating area alters dramatically after SCI. The muscle atrophy that often results from SCI, combined with the loss of other soft tissues, reduces the area of the surface and the distribution of pressure to the underlying structures. Pressure, defined as force per unit area, increases rapidly with decreasing contact area. High pressures on the seating surface lead to pressure sores, a major concern of persons with SCI for both health and quality-of-life reasons.
Asymmetry of static sitting in SCI has been little studied in the literature. Complications such as spine deformity, a common secondary effect of muscle imbalance, and loss of sensory ability and perception may lead to an asymmetry in loading. This asymmetry will further exacerbate the consequences of high pressures on the loading area [13].
Previous studies have investigated the effects of seat-cushion materials [3, 5, 7, 8, 15] and body posture [14] on seating pressure in static sitting. Other studies have compared and determined higher seating pressures in persons with SCI than in able-bodied subjects [16]. A recent study has derived an algorithm to define the area of highest pressure under the ischial tuberosity (IT) region and have shown that the IT weight-bearing area in subjects with SCI is half that of able-bodied controls [1].
This study aimed to describe the loading characteristics of persons with SCI as they pertain to pressure, contact area, and symmetry of loading, and to determine whether postural adjustments or abdominal muscle innervation have any effect on seat loading.
Materials and methods
Subjects
A consecutive series of 44 adult males with complete (ASIA A) [12] thoracic (T1–T12) traumatic SCI, under the age of 50 years, all users of manual wheelchairs, were recruited. Inclusion criteria were trauma occurring after the age of 15 years and at least 2 years prior to the study. Six subjects with psychological problems were excluded, and eight chose not to participate. Thirty subjects were tested in conjunction with their annual check-ups at the SCI clinic. Data from five subjects were corrupted. The final number of subjects analyzed in this study is 25 (weight: μ=76.1 kg, σ=11.7 kg; Table 1). The subjects were divided into two groups based on their SCI level and subsequent trunk muscle innervation. Group 1 was defined as SCI injury at a vertebral level between T1 and T8 (no innervation to abdominal muscles), group 2 as injury between T9 and T12 (some possible innervation to upper abdominal muscles). Simultaneous digital photographs were taken to analyze positions of markers attached to the subjects’ joints, and have been presented in a prior study [2]. Prevalence of pressure sores either at the time of testing or within the previous 5 years was recorded. Data from eight healthy male adult controls under 50 years of age were used as comparison (weight: μ=84.6 kg, σ=13.7 kg).
Table 1.
Subject distribution: groups, count and mean (range, standard deviation) of age, weight, and years since SCI
| SCI group | n | Age (years) | Weight (kg)a | Years since SCI |
|---|---|---|---|---|
| T1–T8 | 18 | 36.4 (26–48, 6.9) | 74.2 (55–100, 11.5) | 15.9 (5–32, 8.4) |
| T9–T12 | 7 | 40 (31–48, 7.3) | 80.9 (60–99, 11.6) | 15.9 (4–28, 7.2) |
| Control | 8 | 30.6 (16–44, 9.6) | 84.6 (62–105, 13.7) | – |
aNo statistical difference in weight was determined between any two groups
Pressure measurements
The subjects sat on both a standardized wooden surface and in their own wheelchairs. They were given standard instructions to sit in two positions: first in a relaxed and then in an upright posture. The standardized surface was a table with a solid hardwood (beech) surface and four steel legs, on which the subjects sat as far back as possible with the backs of their knees flush with the table edge and their legs suspended. In the wheelchairs, subjects seated themselves as usual. In all positions, the subjects sat with their arms on their laps and looked straight ahead. Control subjects sat only on the standardized surface.
The seating surfaces were equipped with a sensor, which measured pressure distribution under the seating surface (ClinSeat Type 5315 Sensor, Tekscan, Boston, Mass., USA). The mat was 42.7×48.8 cm with a thickness of approximately 0.1 mm. The sensor consists of two thin, flexible polyester sheets with parallel strips of electrodes in the lining, the strips on one side being perpendicular to those on the other side, and with a semi-conductive ink layer between the sheets. The ink produces an electrical resistance charge at the intersection of electrodes, one intersection every 1.03 cm2. The charge is pressure-sensitive, and sensitivity can be adjusted to one of 10 levels. A calibration file was recorded and saved with three healthy adults of varying body weight and body type at each sensitivity level used, according to the manufacturer’s recommended calibration procedure. For each subject’s pressure recording, the calibration file of the person with the nearest maximum pressure and the appropriate sensitivity level was chosen. For each subject recording, a noise filter was applied such that the lowest 1.18% (3 of 255 raw measurement units) of the overall sensing capacity was eliminated. Pressure sensors from this manufacturer have been previously validated in another application [11].
The mat was located at an identical position on the standardized surface for all subjects. On the wheelchair, it was located under the seating surface, avoiding contact with the backrest.
Pressure data were recorded for 3 s at a sampling rate of 8 Hz, and an averaging algorithm in the software was used to smooth pixel data into smooth pressure distribution data. One final distribution was determined by each pixel’s maximum reading during the 3 s period. The pressure distribution was viewed as a two-dimensional image on a PC and the image was divided into left and right sides based on the pressure pattern. The software located the 2×2 cm area with the highest pressure as well as the center of force (CoF, the weighted center of all pixel readings of force) measured by the sensor.
The data recorded were as follows:
- (1)
Maximum pressure (left side, right side, and overall; g/cm2)
- (2)
Contact area (left side, right side, and overall; cm2)
- (3)
Mass (left side, right side, and overall; kg)
- (4)
Active area of highest 75% of the maximum pressure (left side, right side, and overall; cm2)
- (5)
Distance from each side’s peak pressure location to the CoF (cm)
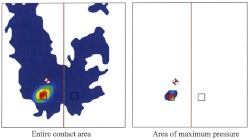
Pressure and force were normalized to body weight, and active area of the top 75% pressure was normalized to the contact area and expressed as a percent (Fig. 1). Three asymmetry indexes were defined from the data: CoF Asymmetry (measures the asymmetry of the distance between the CoF and the left and right peak pressure location), Force Asymmetry and Area Asymmetry. In each case, the left and right side parameters were compared using the following formula:
 |
where “max” refers to the larger of the two distances between the maximum pressure location and the CoF, the higher of the two sides’ forces, or the larger of the two sides’ contact areas (Fig. 2), and “mean” refers to the mean of these measures of the left and right sides.
Fig. 1.
Pressure sensor output. In the first image, the entire contact is shown with the line in the center dividing left and right sides, the small box on each side indicating the location of the maximum pressure of each side, and the red and white diamond indicating the overall center of pressure. The second image shows only the area of the highest 25% pressure of the same data recording
Fig. 2.
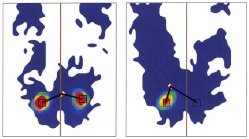
Calculation of the CoF Asymmetry for two subjects. This asymmetry index is a function of the distance from each side’s peak pressure location to the overall center of pressure. The image on the left shows a subject with near-perfect symmetry (CoF Asymmetry <0.01) and the image on the right shows a person with much less symmetry (CoF Asymmetry ≈0.31)
This index was designed to give a value of
 |
where 0 represents perfect equality of the left and right sides’ measures, and 1 represents the situation where the measure lies entirely on one of the sides, with a linear relationship in between. Specifically, if CoF Asymmetry approaches 0, the CoF is equidistant from each side’s maximum pressure location, and if CoF Asymmetry approaches 1, the CoF is located on one side’s maximum pressure location. Similarly, if Area Asymmetry equals 0, then the sides have equal contact area, while if Area Asymmetry equals 1, then all contact area is located on one side.
Data analysis
The variables considered in the data analysis were:
SCI versus control
Standardized versus wheelchair sitting (SCI subjects only)
Relaxed versus upright sitting
High versus low thoracic SCI
The following parameters were used to test the appropriate variables:
Force (total and normalized to body weight)
Maximum pressure (absolute and normalized to body weight)
Contact area
Contact area of the highest 25% pressure (absolute and normalized to total contact area)
Force Asymmetry
Area Asymmetry
CoF Asymmetry
Means and standard deviations are displayed for each group. Statistical significance was determined using nonparametric tests (Mann-Whitney for different groups and Wilcoxon for intra-subject comparisons). All statistics were calculated in commercially available software (SPSS).
Repeatability was evaluated by testing two healthy adults (1 male, 1 female) for 10 days, once per day at different times, and in random order. On one of the days, each person’s seating pressure distribution was tested 10 times, for a total of 19 trials per person in each of the relaxed and upright positions. The following seven parameters were evaluated for their variation: total force, maximum pressure, contact area, highest pressure area, force asymmetry, area asymmetry, and CoF asymmetry. The means and standard deviations were calculated.
Results
SCI versus control
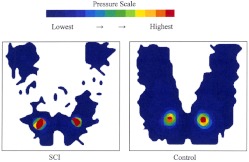
Significant differences were found in all tested parameters (Table 2, Fig. 3). Maximum pressure in SCI subjects was approximately double that in controls, despite relatively similar body weights. In SCI subjects, pressure on the standardized surface was observed to be as high as 1.2 kg/cm2. The contact area in SCI subjects was less than half that in the controls. The area of the highest pressure was also smaller in SCI subjects (10 cm2 compared with 17 cm2 in controls), which corresponded to a larger percentage of available contact area. All asymmetry indices displayed much more asymmetry in SCI sitting than in able-bodied sitting (Table 2, Fig. 4).
Table 2.
Mean (standard deviation) of all parameters are shown as a comparison of SCI subjects versus controls
| Max. pressure (g/cm2) | Normalized pressure (×1000 cm-2) | Total area (cm2) | Peak 25% area (cm2) | Normalized peak 25% area (%) | Force Asymmetry | Area Asymmetry | COF Asymmetry | |
|---|---|---|---|---|---|---|---|---|
| SCI | 1,205 (440) | 16.0 (6.5) | 316 (147) | 9.75 (3.7) | 3.7 (2.1) | 0.20 (0.18) | 0.095 (0.09) | 0.23 (0.22) |
| Control | 603 (273) | 7.5 (3.7) | 809 (202) | 16.66 (9.6) | 2.0 (1.0) | 0.07 (0.08) | 0.032 (0.03) | 0.10 (0.12) |
| p | <0.01 | <0.01 | <0.01 | 0.03 | 0.01 | 0.02 | 0.04 | 0.03 |
Fig. 3.
Images from the pressure sensor reveal the greater total loading area of the control subject (left) versus the SCI subject (right) in the relaxed position on the standardized surface. The pressure color scale is indicated, where blue indicates the lowest pressure and red the highest
Fig. 4.
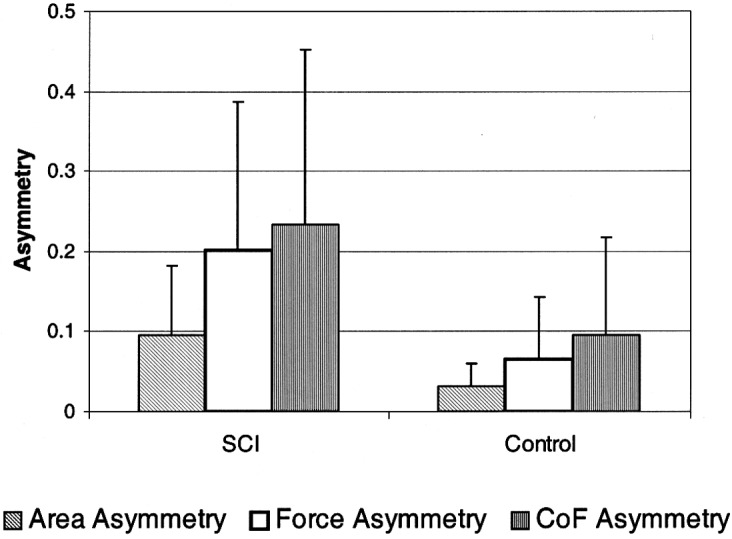
Asymmetry indices +1 SD in the relaxed position on the standardized surface. The SCI subjects display more asymmetry than the controls in all indices
Standardized surface versus wheelchair
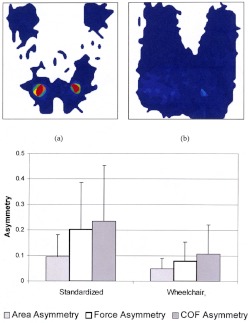
The wheelchair was observed to improve most parameters (Table 3, Fig. 5). While the total force on the seating area increased in the wheelchair, the pressure decreased and the contact area increased significantly. The area of highest pressure was distributed onto a somewhat larger percentage of available contact area, though this result was not statistically significant (p=0.06). Asymmetry of force and CoF location were observed to improve in the wheelchair.
Table 3.
Mean (standard deviation) of all parameters as a comparison of standarized surface versus wheelchair in relaxed position
| Total force (N) | Max. pressure (g/cm2) | Total area (cm2) | Top 25% area (cm2) | Normalized peak 25% area (%) | Force Asymmetry | Area Asymmetry | COF Asymmetry | |
|---|---|---|---|---|---|---|---|---|
| Standardized surface | 482 (187) | 1,205 (440) | 316 (147) | 9.7 (3.7) | 3.7 (2.1) | 0.20 (0.18) | 0.095 (0.05) | 0.23 (0.22) |
| Wheelchair | 754 (179) | 245 (89) | 1,274 (174) | 33.3 (40.4) | 2.5 (2.7) | 0.08 (0.08) | 0.049 (0.04) | 0.11 (0.11) |
| p | <0.01 | <0.01 | <0.01 | <0.01 | 0.06 | <0.01 | 0.09 | <0.01 |
Fig. 5.
Comparison between subjects on the standardized surface (a) and in their own wheelchairs (b). The pressure measurement shows the same subject on the same visual pressure scale. The asymmetry measurement of subjects with SCI in the wheelchairs is close to that of the controls on the standardized surface (bottom)
Relaxed versus upright posture
The upright posture resulted in only one significant difference during sitting in the control group: the total force on the seating area increased by 52% (Table 4a). In the SCI group on the standardized surface, the total force did not increase (Table 4b). Three parameters, however, improved with upright sitting: both raw and normalized maximum pressure decreased by 10%, while the contact area increased by 22%. None of these parameters, however, improved when the SCI subjects adjusted to upright posture in the wheelchair (Table 4c). The only parameter to change was the area of highest pressure, which increased by 5%. Symmetry was not observed to be improved significantly by the postural adjustment in any sitting configuration.
Table 4.
Mean (standard deviation) of all parameters with varying seat postures
| Total force (N) | Max. pressure (g/cm2) | Normalized pressure (×1000 cm-2) | Total area (cm2) | Top 25% area (cm2) | Normalized peak 25% area (%) | Force Asymmetry | Area Asymmetry | COF Asymmetry | |
|---|---|---|---|---|---|---|---|---|---|
| (a) Control: standardized table | |||||||||
| Relaxed | 398 (179) | 603 (273) | 7.5 (3.7) | 809 (202) | 16.7 (9.58) | 2.0 (1.0) | 0.07 (0.08) | 0.03 (0.03) | 0.1 (0.12) |
| Upright | 605 (140) | 593 (196) | 7.3 (2.8) | 811 (172) | 11.7 (6.44) | 1.4 (0.7) | 0.09 (0.07) | 0.03 (0.03) | 0.11 (0.09) |
| p | 0.01 | 1.00 | 1.00 | 0.89 | 0.09 | 0.09 | 0.16 | 0.67 | 0.58 |
| (b) SCI: standardized table | |||||||||
| Relaxed | 482 (187) | 1,205 (440) | 16.0 (6.5) | 316 (147) | 9.7 (3.74) | 3.7 (2.1) | 0.20 (0.18) | 0.10 (0.09) | 0.23 (0.22) |
| Upright | 492 (186) | 1,079 (374) | 14.4 (5.7) | 386 (165) | 10.0 (3.26) | 3.2 (2.0) | 0.18 (0.19) | 0.11 (0.09) | 0.21 (0.24) |
| p | 0.36 | 0.01 | 0.00 | 0.00 | 0.64 | 0.20 | 0.38 | 0.10 | 0.21 |
| (c) SCI: wheelchair | |||||||||
| Relaxed | 754 (179) | 245 (89) | 3.3 (1.4) | 1,274 (174) | 33.3 (40.4) | 2.5 (2.7) | 0.08 (0.08) | 0.05 (0.04) | 0.11 (0.11) |
| Upright | 739 (173) | 238 (87) | 3.2 (1.4) | 1,492(1058) | 34.9 (36.4) | 2.6 (2.6) | 0.09 (0.09) | 0.07 (0.15) | 0.13 (0.10) |
| p | 0.67 | 0.24 | 0.26 | 0.81 | 0.04 | 0.19 | 0.81 | 0.45 | 0.25 |
High versus low thoracic SCI
No significant differences in the seating parameters were observed between persons with SCI in T1–T8 and those with SCI in T9–T12 in any seating configuration.
Repeatability of method and parameters
The total force had a standard deviation of approximately 33 N, which was nearly 5% of the mean value measured in the repeatability study. The standard deviation of the contact area was approximately 31 cm2, which was also equivalent to less than 5% of the mean contact area measured. The standard deviation of the maximum pressure was approximately 34 g/cm2, or between 6% and 20% of the measured maximum pressure. All asymmetry indices had a measured standard deviation of 0.012–0.055, which is equivalent to measurement repeatability of 1.2–5.5% asymmetry, since the asymmetry is on a 0–1 scale. Area Asymmetry had the smallest standard deviation (0.015), followed by Force Asymmetry (0.026), and CoF Asymmetry had the largest (0.039). All standard deviation values measured in the repeatability study were much lower than the significant differences reported above between different subject populations. The method and parameters can therefore be considered repeatable.
Discussion
The main finding in this study is that reliable estimates of asymmetry in the loading area of wheelchair-ambulating persons can be achieved with pressure measurements. Several different seat-loading parameters were chosen to be evaluated due to their different implications. The asymmetry indices are useful in comparing different individuals with unique anatomy as well as for comparing pressure from the different sensitivities in the pressure sensors. The indices were designed to show slightly different characteristics of loading. They measure essentially the percent difference from each side to their mean. The Force Asymmetry describes a potential risk for skeletal problems such as scoliosis and muscular problems in balance maintenance. Area Asymmetry addresses further anatomical deficiencies in the loading area and can be important in choosing appropriate orthotic cushions. CoF Asymmetry provides even more information about risks for acquiring pressure sores, since it gives qualitative information about the likelihood that all upper body force is centered on one point. The force and area asymmetries are applicable with the current protocol if a subject needs to stabilize himself by placing his hands on the pressure mat, whereas the CoF asymmetry will then be inaccurate.
The maximum pressure area describes the area that takes up most of the loading. In all cases, this area was extremely small: in control subjects a mere 17 cm2 and only 10 cm2 in SCI subjects. This corresponded well with the findings of Aissaoui et al. [1], who reported that the area supported by the ischial tuberosity region in SCI subjects was approximately half that of the able-bodied subjects. As the total surface area was nearly 3 times larger in control subjects than in SCI subjects, the maximum loading area does not decrease proportionally. The SCI subjects, in fact, are using nearly double the available contact area (respectively) compared with the controls. This measure illustrates the unnatural loading requirements of the soft tissues on the seating area.
The subjects’ seating pressures on their wheelchairs were only one-fifth of the pressures on the hard surface. The maximum pressure on the wheelchair was measured at a mean of 245 g/cm2, equivalent to 180 mmHg. This again corresponds to the findings of Aissaoui et al. [1], who reported SCI subjects as having a maximum pressure of 199–212 mmHg, equivalent to 271–288 g/cm2, in a standard chair with a flat-foam cushion. The pressure on the hard surface of 1,205 g/cm2, equivalent to 886 mmHg, also correlates with results from Thorfinn et al. [16], who reported a maximum pressure of 11.7 N/cm2, equivalent to 877 mmHg or 1,192 g/cm2, in SCI subjects sitting on a glass plate.
Adjustment in posture from the relaxed to the upright position improved some seating parameters in subjects with SCI when subjects sat on the standardized table, but in their own wheelchairs, postural adjustments made extremely little difference. These findings, in combination with findings of 245 g/cm2 of pressure, put these subjects at high risk for pressure sores. Loading was more symmetric in the subjects’ wheelchairs, approaching the symmetry values of non-injured subjects, but thresholds of asymmetry for risk-loading have not been developed, and it is possible that even small reductions in symmetry may increase risk. Future studies correlating individual postures with loading characteristics may provide more conclusive goals for seating design, as may evaluation of seating during functional and dynamic activities.
One goal of this investigation was to determine whether innervation to the abdominal muscles had any effect on seat loading. No differences in any parameters were found, due in part to the low number of test subjects. Since the subjects with little abdominal muscle innervation may not have a large range of seating postures, the voluntary change in posture may have been small. Individual postural adjustments, rather than group averages, however, may yield more insight into seat loading improvements in subjects with little innervation to the abdominal muscles.
Conclusion
Seating pressure is higher in subjects with SCI, which can alone lead to complications, but the high pressures are further exacerbated by loading asymmetries and are often accompanied by spine deformities. Measuring the asymmetry of loading in addition to maximum pressure is an important assessment in choosing appropriate wheelchair characteristics and could provide information useful in the prevention of secondary complications in persons with complete SCI. Routine measurement of seating pressure, area, and asymmetry may aid in the selection of appropriate chair adjustments and cushion characteristics and may alert clinicians to patients who may be at risk for secondary complications associated with high seating pressure and imbalance.
Acknowledgments
This project was funded by Permobil AB, Timrå, Sweden, Spinalis Foundation, Stockholm, Sweden and Norrbacka-Eugenia Foundation, Stockholm, Sweden.
References
- 1.Aissaoui Med Eng Phys. 2001;23:359. doi: 10.1016/S1350-4533(01)00052-2. [DOI] [PubMed] [Google Scholar]
- 2.Alm Spinal. 2003;Cord:in. [Google Scholar]
- 3.Apatsidis Arch Phys Med Rehabil. 2002;83:1151. doi: 10.1053/apmr.2002.33987. [DOI] [PubMed] [Google Scholar]
- 4.Burney Arch Surg. 1993;128:596. doi: 10.1001/archsurg.1993.01420170132021. [DOI] [PubMed] [Google Scholar]
- 5.Garber Am J Occup Ther. 1978;32:565. [PubMed] [Google Scholar]
- 6.Gerhart Arch Phys Med Rehabil. 1993;74:1030. doi: 10.1016/0003-9993(93)90057-h. [DOI] [PubMed] [Google Scholar]
- 7.Hobson Spine. 1992;17:293. [PubMed] [Google Scholar]
- 8.Koo Arch Phys Med Rehabil. 1996;77:40. doi: 10.1016/s0003-9993(96)90218-x. [DOI] [PubMed] [Google Scholar]
- 9.Levi Paraplegia. 1995;33:308. doi: 10.1038/sc.1995.70. [DOI] [PubMed] [Google Scholar]
- 10.Levi Paraplegia. 1995;33:585. doi: 10.1038/sc.1995.125. [DOI] [PubMed] [Google Scholar]
- 11.Luo J Rehabil Res Dev. 1998;35:186. [PubMed] [Google Scholar]
- 12.Maynard Spinal Cord. 1997;35:266. doi: 10.1038/sj.sc.3100432. [DOI] [PubMed] [Google Scholar]
- 13.Samuelsson Scand J Occ Ther. 1996;3:28. [Google Scholar]
- 14.Shields Phys Ther. 1992;72:218. doi: 10.1093/ptj/72.3.218. [DOI] [PubMed] [Google Scholar]
- 15.Takechi Acta Med Okayama. 1998;52:245. doi: 10.18926/AMO/31321. [DOI] [PubMed] [Google Scholar]
- 16.Thorfinn Scand J Plast Reconstr Surg Hand Surg. 2002;36:279. doi: 10.1080/028443102320791824. [DOI] [PubMed] [Google Scholar]


