Abstract
There is evidence in the literature for both a congenital and a post-traumatic aetiology for os odontoideum. In no series published to date has CT been used to aid in the diagnosis. This is a prospective study of the history of trauma and presence of diagnostic features on CT of 18 consecutive cases with os odontoideum. Our objective was to derive clinically useful radiological features enabling accurate differentiation between congenital and post-traumatic aetiologies. A mid-sagittal CT reconstruction of the atlanto-dens joint was obtained. Hypertrophy of the anterior arch of the atlas was quantified by measurement of the arch-peg-area ratio. The presence of dysplastic features (a positive “jigsaw” sign) of the atlanto-axial joint were noted. These included narrowing of the cartilage space and interdigitation of the two joint surfaces. A history of a potential traumatic aetiology was only obtained in one of the 18 (6%) in our series. A significant elevation of the arch–peg ratio was found when comparing this series to 85 controls. And a positive jigsaw sign was observed in 75% of cases. These features were not seen in paediatric cases of atlanto-axial instability, including odontoid non-union. In conclusion, an elevated arch–peg ratio and the presence of a jigsaw sign are sensitive and specific diagnostic criteria for os odontoideum. This series supports a congenital aetiology for this condition.
Keywords: Os odontoideum, Aetiology, Computerized tomography, Diagnosis
Introduction
Both congenital and post-traumatic aetiologies for os odontoideum have been proposed in the literature. The debate regarding aetiology can lead to confusion in a medico-legal setting and even lead to inappropriate treatment. In favour of a post-traumatic aetiology are the reported cases with radiologically documented progression from a normal odontoid to os odontoideum after significant traumatic injury [4, 3, 5, 10, 7]. In addition, a large series reported a high incidence with a previous history of significant trauma: 17 of 35 [2]. Only four of these, however, had specific trauma to the head or neck.
The congenital-aetiology argument is supported by the condition’s association with several congenital syndromes—Down’s, Klippel-Feil, Morquio’s and spondyloepiphyseal dysplasia [1]—and a postmortem study revealing pathological features of congenital osseous and ligamentous changes [11]. Twin studies have been reported both supporting [8, 9] and refuting [13] a congenital cause. To date no large series has been reported utilising computerised tomography (CT) images to aid in this differentiation. Our objective was to derive clinically useful radiological features enabling accurate differentiation between congenital and post-traumatic aetiologies.
Materials and methods
X-ray and CT examinations were performed on a series of 18 cases of os odontoideum. These were part of a consecutive series of 26 cranio-cervical anomalies presenting to a busy radiological practice (Table 1) over a 5 year period. Cases associated with congenital disorders, such as Down’s and Morquio’s syndromes, and inflammatory disorders, such as rheumatoid arthritis, were excluded. Acute fractures, as typified by sharp edges of the defect and absence of cortical sclerosis of the margins in the setting of an acute injury, were also excluded.
Table 1.
Diagnosis in a consecutive series of 26 cranio-cervical abnormalities
| Diagnosis | Number of cases |
| Os odontoideum | 18 |
| Odontoid fracture non-union | 2 |
| Ruptured transverse ligament | 1 |
| Avulsed ossiculum terminale | 2 |
| Vertebral assimilation | 2 |
| Unilateral aplasia of atlas | 1 |
The criteria of Fielding et al. [2] were used to differentiate os odontoideum from non-union after a fracture of the odontoid. In os odontoideum there is a wide gap between the os and the axis. The os is rounded or oval shaped, has smooth, uniform cortical margins and is smaller than the normal odontoid. The line of separation is above the superior, articular process of the axis [13], and the anterior arch of the atlas is hypertrophied [6]. In the case of a non-union, the fragment retains the size and shape of the odontoid, and the line of separation is narrow and below the level of the superior, articular process of the axis. There may be sclerosis or cyst formation at the fracture site.
Clinical data
Clinical data was obtained prospectively. This included: demographic details and a history of recent or remote trauma
Radiological data
>Standard cervical X-rays were obtained including lateral views in flexion and extension. CT scans were obtained with the head in a neutral position, using a Toshiba Aquilion Multislice (4x) scanner (Toshiba, Japan). Five-mm-thick slices were obtained 4 mm apart at a pitch of 3.5 and a field of view (FOV) of 160 mm. Scanning time was 0.5 s per slice. Exposure was 120 kV and 150 mA.
Measurements
The mid-sagittal CT reconstruction was used to diagnose hypertrophy of the anterior arch of C1 and abnormalities of the atlanto-dens joint. The arch–peg ratio was used as an index of anterior arch hypertrophy. This was defined as the ratio between the cross-sectional area of the arch of the atlas and that of the os (Fig. 1). It was measured by plotting the perimeters of these structures on the scanner workstation, which then produced a digital readout of the area enclosed.
Fig. 1.
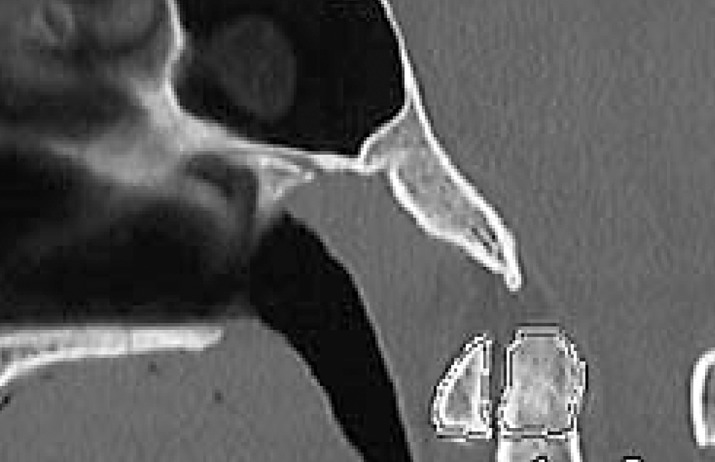
The arch–peg ratio on a control CT scan taken for examination of the para-nasal sinuses
The arch–peg ratio was determined for cases with os odontoideum, cases with other cranio-cervical abnormalities from the series and a group of controls. Control data was obtained from a series of mid-sagittal CT reconstructions from 75 patients matched for age, who underwent CT of the sinuses. As there was no defect in the peg to define its lower limit, the area of the peg at and above the level of the arch was substituted for the area of the os (Fig. 1).
The jigsaw sign is seen where there is an abnormality of atlanto-dens joint thickness and configuration. It was defined as positive where there was a narrowed cartilage space and an interdigitating or ankylosed joint line (Fig. 2).
Fig. 2.
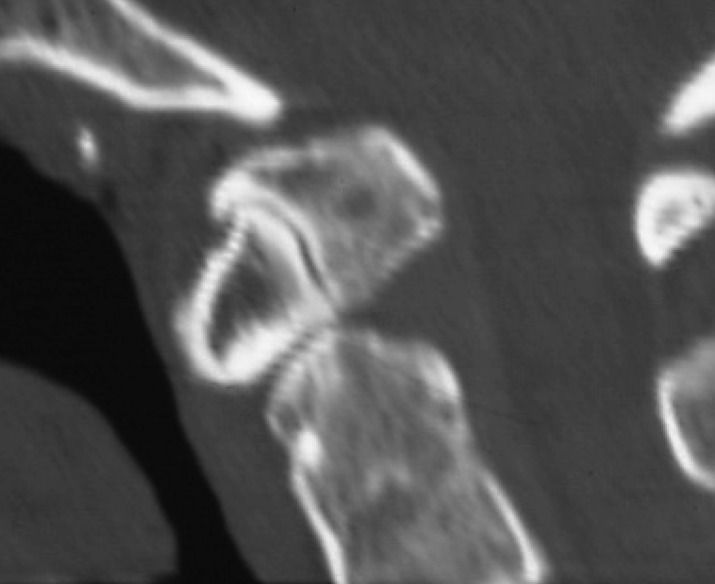
A positive jigsaw sign in a typical case of os odontoideum. Note the interdigitation and narrowing of the atlanto-axial joint line. The arch-peg-area ratio is elevated
Statistical methods
The presence or absence of a history of significant trauma in the 18 cases with os odontoideum was first determined. The cases with os odontoideum were then compared with the 75 control cases with respect to the presence or absence of each of the two CT signs: a raised arch–peg ratio and the presence of a jigsaw sign. The two-tailed t-test and the χ2 test were used for statistical analysis. The criterion for significance was a 95% or greater probability that the result was not due to chance.
Hypotheses
The hypotheses that we tested were:
That os odontoideum is an acquired post-traumatic condition, associated with a history of high-velocity trauma to the neck
That os odontoideum is associated with an increase in the arch–peg ratio, compared with normal
That os odontoideum is associated with a jigsaw sign: narrowing and irregularity of the atlanto-dens joint
The sensitivity, specificity, positive and negative predictive value and overall test efficiency were calculated for each of the two CT signs in the diagnosis of os odontoideum (see Appendix for formulae).
Results
There were ten females and eight males with os odontoideum. The average age at presentation was 33 (range 5–66) years. Seven cases were 15 years of age or younger. A history of high-velocity trauma remote in time from the presentation was obtained in only one case. This was a 45-year-old female who presented after her third motor-vehicle accident. The first of these occurred 20 years previously. In each of the accidents, the car had rolled over (Fig. 3).
Fig. 3.
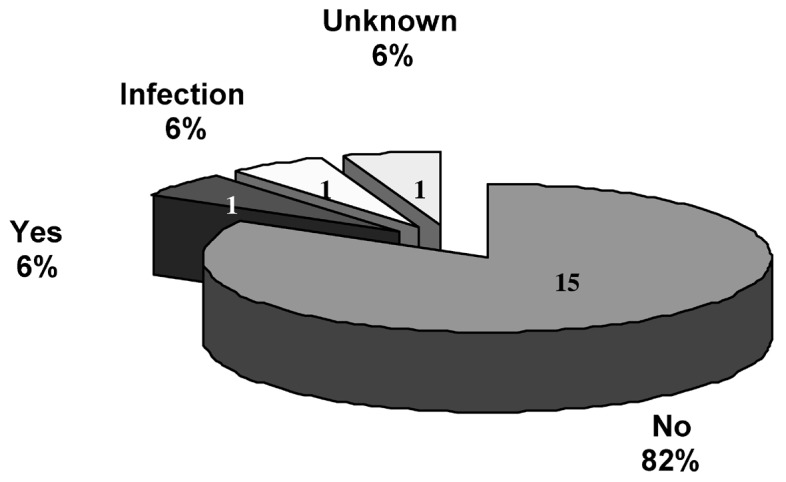
The incidence of a history of severe trauma remote from the time of presentation in the 18 cases of os odontoideum
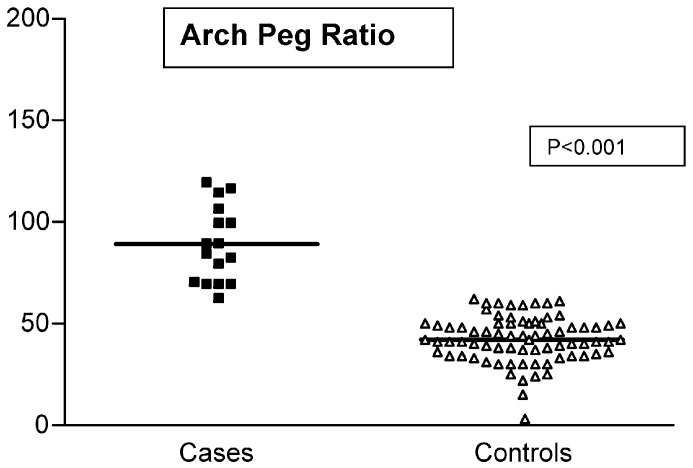
Of interest was one patient who had osteomyelitis of the cervical spine at 4 years of age. Presumably, this was in the upper-cervical spine, as X-ray of the cervical spine was normal below the atlanto-axial joint. The arch–peg ratio was significantly greater for cases than for controls (Fig. 4).
Fig. 4.
The ratio between the cross-sectional area of the anterior arch of the atlas and the odontoid peg (t-test)
Thirteen of the controls had a ratio above 0.5, the maximum being 0.62. None of the cases had a ratio below 0.5 (the lowest being 0.63).
The value of the arch–peg ratio as a diagnostic test for os odontoideum as applied to our series is shown for ratios >0.5, >6.3 and >6.5 (Table 2).
Table 2.
The diagnostic value of the arch-peg-area ratio (>0.5) as a test for os odontoideum (see Appendix for definitions of terms)
| Diagnostic value of the arch–peg ratio (%) | >0.5 | >0.63 | >0.65 |
| Sensitivity | 100 | 100 | 94 |
| Specificity | 83 | 100 | 100 |
| Positive predictive value | 55 | 100 | 100 |
| Negative predictive value | 100 | 100 | 99 |
| Test efficiency | 86 | 100 | 99 |
>There were four cases with os odontoideum who were negative for the jigsaw sign. None of the controls were positive. Of the four cases that were negative, two were skeletally immature. In these cases the atlanto-dens articulation would normally have a greater cartilage thickness. The bony outline does not follow the contour of the articulation as closely in this age group.
The diagnostic value of the jigsaw sign as a test for os odontoideum in our series is shown in Table 3.
Table 3.
The diagnostic value of the jigsaw sign as a test for os odontoideum (see Appendix for definitions of terms)
| Diagnostic value of the jigsaw sign | % |
| Sensitivity | 75 |
| Specificity | 100 |
| Positive predictive value | 100 |
| Negative predictive value | 95 |
| Test efficiency | 96 |
One patient had an aplasia of the anterior arch of the atlas (Fig. 5). A second patient was examined by X-ray, but not CT. Consequently, these two patients were omitted from the calculations of test performance for the jigsaw sign.
Fig. 5.
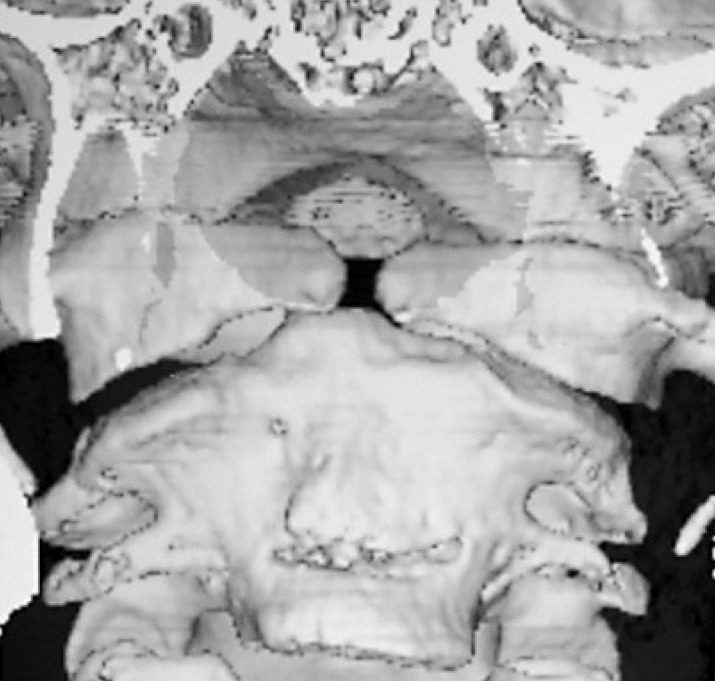
Anterior view of a CT 3D reconstruction of a case with os odontoideum and aplasia of the anterior arch of the atlas and clivus
There were five cases of long-standing (5 years minimum) post-traumatic atlanto-axial instability: two non-unions after a dens fracture; two cases of avulsed ossiculum terminale and one case of chronic instability due to transverse ligament deficiency. In none of these was a thickened arch or an abnormal atlanto-dens joint observed (Fig. 6).
Fig. 6.
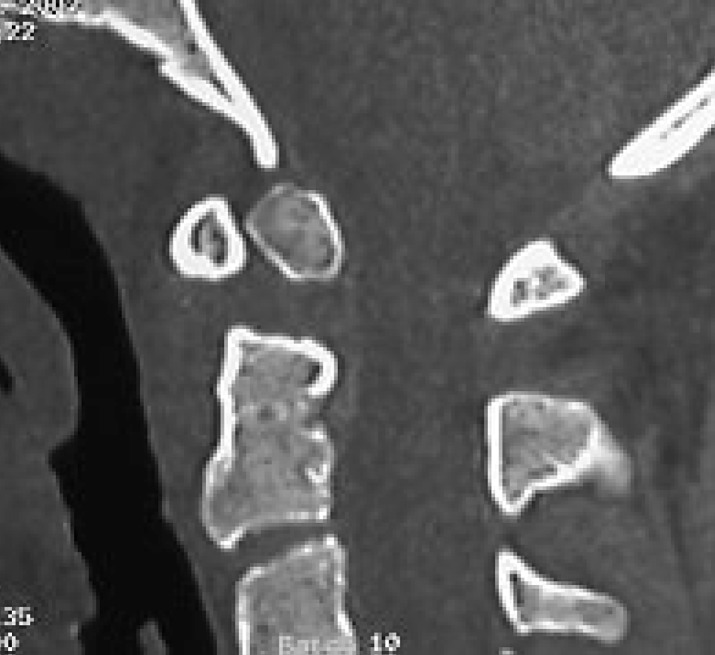
An18-year-old woman with a 9-year-old non-union of a dens fracture. Note the preservation of the arch–dens articulation and the normal appearance of the anterior arch of the atlas
Discussion
This series is the first to use CT reconstructions to describe and measure the pathological anatomy of os odontoideum. Although the association with hypertrophy of the anterior arch of the atlas has been recognized for some time, it has not previously been quantified. The abnormal jigsaw-like shape of the arch–dens joint has not been described before.
Two other large series of 35 patients [2] and 24 patients [12] are in the literature. Our findings regarding the significance of prior trauma to later presentation with os odontoideum are opposite to those of Fielding et al. (6% vs 49%) [2]. Most of the cases in their series gave a general history of prior trauma. In only four of 17 was the trauma specifically to the head or neck. Furthermore, the series was obtained before CT was available. The diagnosis was made exclusively on plain radiographs. It is possible, therefore, that some of their cases might actually have been fracture non-unions.
Our patient population also differs significantly from that of Stevens et al. [12]. Nineteen of their 24 patients had a generalised skeletal dysplasia. We excluded such patients from our series as our interest was in the aetiology of isolated os odontoideum. Those with an associated skeletal dysplasia are likely to have a congenital aetiology and often have additional factors such as ligamentous laxity contributing to the pathology.
Advocates of a traumatic aetiology for os odontoideum have proposed that arch hypertrophy can be the result of acquired atlanto-axial instability prior to skeletal maturity [12]. Our total series of atlanto-axial abnormalities included six with a remote history of high-velocity trauma. One was a case with os odontoideum. The remaining five comprised two examples of fracture non-union, a transverse ligament rupture and two cases of avulsed ossiculum terminale (Table 1). Four of these five sustained their injuries 5–24 years previously while skeletally immature. Yet their CTs do not show arch hypertrophy or joint dysplasia (see Fig. 6).
There are a number of case reports in the literature in which os odontoideum has been observed to develop after trauma in subjects said to have had normal cervical spine X-rays taken at the time of initial injury [4, 3, 5, 10, 7]. Generally, these injuries occurred in skeletally immature individuals. These reports were published prior to the advent of CT and relied on plain-film evaluation. The arch hypertrophy is mild in the published photographs. It is possible, therefore, that these are cases of un-displaced fractures that have gone on to become non-union. This may have been confirmed, had CT been available.
We have proposed two CT signs of os odontoideum: the arch–peg ratio and the jigsaw sign. The former quantifies a well-recognized radiological feature for the first time. The latter has not been described before. Both rely on sagittal reconstructions of fine-cut CT examinations.
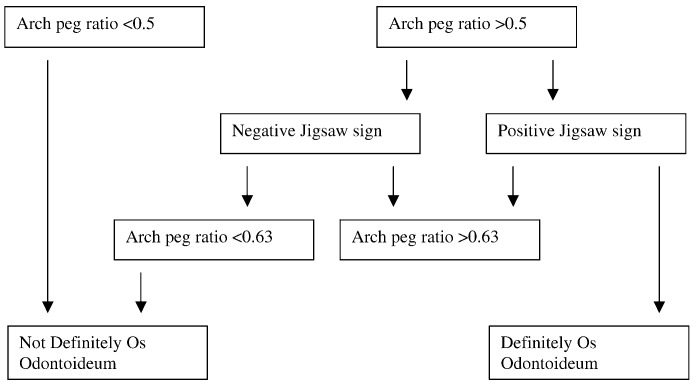
In Table 2 we have shown how the test efficiency of the arch–peg ratio is maximal when set at >0.63 for the diagnosis of os odontoideum. This is not an easy number to remember, however. Consequently, we propose a diagnostic approach summarised in the following algorithm (Fig. 7).
Fig. 7.
Algorithm for diagnosis of os odontoideum from mid-sagittal CT scan, using arch–peg ratio and jigsaw sign as diagnostic criteria
The arch–peg ratio is the first factor to consider in making the diagnosis of os odontoideum as it is the most sensitive of the two tests. If it is less than 0.5, the diagnosis cannot be made confidently. If it is greater than 0.5 the jigsaw sign should be looked for as it is highly specific for os odontoideum. If the jigsaw sign is positive, the diagnosis of os odontoideum can be confidently made. If the jigsaw sign is negative, the arch-peg-area ratio should be measured using the plotting function on the CT workstation; and a diagnosis of os odontoideum can only be confidently made if the arch-peg-area ratio is elevated >0.63, the level at which specifity approaches 100% in our series.
The morphological features of the jigsaw sign are consistent with a congenital aetiology. The dens is believed to originate as the centrum of the atlas. A dysplastic appearance of the atlanto-dens joint is consistent with a failure of segmentation of the dens from the anterior arch of the atlas. The clinical presentation in our series is also consistent with a congenital aetiology. A history of potential traumatic aetiology was obtained in only one of our 18 cases with os odontoideum (6%). As a remote history was unobtainable in one of our cases, at worst 88% of our series had no history of prior trauma to account for their pathology.
Conclusions
We have found os odontoideum to have a characteristic appearance on sagittal CT reconstructions of the atlanto-dens joint. Hypertrophy of the anterior C1 arch can be quantified as the arch-peg-area ratio and is elevated above 0.5. In addition, there is dysplasia of the atlanto-dens joint or a positive jigsaw sign. These radiological signs are not observed after dens fractures. They provide good evidence for a congenital aetiology. This is consistent with the absence of a history of trauma in the majority of cases in our series. These signs are both sensitive and specific in the radiologic diagnosis of os odontoideum.
Appendix: Formulae for predictive value of a test
Predictive-value formulas
| Test positive | Test negative | |
| Disease present |
True positive (TP) | False negative (FN) |
| Disease absent |
False positive (FP) | True negative (TN) |
Sensitivity
Sensitivity of a test is measured as the percentage of all patients with disease present who have a positive test for the disease.
 |
1 |
Specificity
Specificity of a test is the percentage of all patients without disease who have a negative test.
 |
2 |
Predictive value
The predictive value of a test is a measure (%) of the times that the value (positive or negative) is the true value, i.e., the percentage of all positive tests that are true positives is the positive predictive value.
 |
3 |
 |
4 |
Test efficiency:
The efficiency of a test is the percentage of the times that the test gives the correct answer, as compared with the total number of tests.
 |
5 |
Footnotes
Institution where work carried out: Spine Research Group, School of Mechanical, Manufacturing and Medical Engineering, Queensland University of Technology, Mater Misericordiae Hospitals Brisbane, GPO Box 2434 Brisbane Q4001, Australia
References
- 1.Dietz F (2001) Congenital abnormalities of the cervical spine. In: Weinstein SL (ed) The paediatric spine: principles and practice. Lippincott, Philadelphia p 239–252
- 2.Fielding J Bone Joint Surg Am. 1980;62:376. [PubMed] [Google Scholar]
- 3.Freiberger J Bone Joint Surg Am. 1965;47:1231. [PubMed] [Google Scholar]
- 4.Gwinn Am J. 1962;Roentgenol:424. [PubMed] [Google Scholar]
- 5.Hawkins J Bone Joint Surg Am. 1976;58:413. [PubMed] [Google Scholar]
- 6.HoltRadiology 19891732072781009 [Google Scholar]
- 7.Hukuda Spine. 1980;5:207. doi: 10.1097/00007632-198005000-00001. [DOI] [PubMed] [Google Scholar]
- 8.Kirlew Skeletal Radiol. 1993;22:525. doi: 10.1007/BF00209102. [DOI] [PubMed] [Google Scholar]
- 9.Morgan J Neurosurg. 1989;70:636. doi: 10.3171/jns.1989.70.4.0636. [DOI] [PubMed] [Google Scholar]
- 10.Ricciardi J Bone Joint Surg Am. 1976;58:410. [PubMed] [Google Scholar]
- 11.SherkSpine 19816427209674 [Google Scholar]
- 12.StevensBrain 19941171338149207 [Google Scholar]
- 13.Verska Spine. 1997;22:706. doi: 10.1097/00007632-199703150-00026. [DOI] [PubMed] [Google Scholar]


