Abstract
The tissue microarray (TMA) technology provides the means for high-throughput analysis of multiple tissues and cells. The technique is used within the Human Protein Atlas project for global analysis of protein expression patterns in normal human tissues, cancer and cell lines. Here we present the assembly of 1 mm cores, retrieved from microscopically selected representative tissues, into a single recipient TMA block. The number and size of cores in a TMA block can be varied from approximately forty 2 mm cores to hundreds of 0.6 mm cores. The advantage of using TMA technology is that large amount of data can rapidly be obtained using a single immunostaining protocol to avoid experimental variability. Importantly, only limited amount of scarce tissue is needed, which allows for the analysis of large patient cohorts 1 2. Approximately 250 consecutive sections (4 μm thick) can be cut from a TMA block and used for immunohistochemical staining to determine specific protein expression patterns for 250 different antibodies. In the Human Protein Atlas project, antibodies are generated towards all human proteins and used to acquire corresponding protein profiles in both normal human tissues from 144 individuals and cancer tissues from 216 different patients, representing the 20 most common forms of human cancer. Immunohistochemically stained TMA sections on glass slides are scanned to create high-resolution images from which pathologists can interpret and annotate the outcome of immunohistochemistry. Images together with corresponding pathology-based annotation data are made publically available for the research community through the Human Protein Atlas portal (www.proteinatlas.org) (Figure 1) 3 4. The Human Protein Atlas provides a map showing the distribution and relative abundance of proteins in the human body. The current version contains over 11 million images with protein expression data for 12.238 unique proteins, corresponding to more than 61% of all proteins encoded by the human genome.
Keywords: Genetics, Issue 63, Immunology, Molecular Biology, tissue microarray, immunohistochemistry, slide scanning, the Human Protein Atlas, protein profiles
Protocol
1. How to Prepare Tissues for Tissue Microarray Production (Animation 1)
Select relevant formalin fixed paraffin embedded material (tissue or cell samples) including corresponding hematoxylin stained tissue section.
Mark relevant area on the tissue section. It is recommended to have a freshly cut hematoxylin stained section corresponding to the paraffin block.
Design the template used for TMA production. Randomize the samples within the template to avoid artifacts caused by technical problems such as coverage of the antibody over the whole TMA section and sectioning problems. Add additional orientation markers to the template for orientation.
Organize the tissues according to the template.
2. Manual Tissue Microarray Production (Essential for filming)
To be able to obtain a standardized length of the tissue cores, mark the stylet eg 4.5 mm (Figure 2). Guidelines for spacing between sample centers: core size 0.6 mm – 0.8-1.0 mm core size 1.0 mm – 1.8-2.0 mm core size 1.5 mm – 2.0-3.0 mm core size 2.0 mm – 2.5-4.0 mm It is recommended to leave 2.5-3.0 mm margins on each side of the paraffin block to avoid cracking of the paraffin.
- Mount the selected punches to be used. Start by loosening the hex socket screws that holds the punch in place. The punch is correctly positioned when the groove in the punch hub is firmly placed against the metal rod in the plastic v-block. Fasten the screws and make sure that the edge of the metal clip is horizontal.
- The recipient punch (marked in green and red, specific for distributor) should be placed to the left. The donor punch (marked in green and blue, specific for distributor), which has a slightly larger diameter, should be placed to the right (Figure 3).
- Move the punches along the x- and y-axes by using the XY adjustment knobs. The right adjustment knob moves the punches along the x-axis and the left adjustment knob moves the punches along the y-axis. There is a digital micrometer readout on both adjustment knobs. These are activated when moving the knobs.
- Reset → press the ZERO/ABS button. Shift between inches and mm → press the IN/mm button. The space between the holes should be 2.0 mm (measured between the centers of the holes) when using a 1 mm punch for a 9x8 template.
- To ensure that you do not push the punch too far down into the block, hitting the cassette and destroying the punch, put a cassette without paraffin in the holder and set the bottom position of the recipient punch to 1 mm above the bottom of the cassette by using the depth stop screw at the upper left corner of the Z-guide (Figure 3).
- Put the recipient block in the holder and use the smallest screwdriver to fasten the screws. Do not fasten the screws to tight or the paraffin might break loose from the cassette.
- Push the recipient punch downward approximately 5 mm into the recipient block and use the handle in the punch to rotate the punch back and forth once (Figure 3). The hole will be 5 mm deep when pushing the punch as far down into the block as possible.
- Relieve the downward pushing pressure slowly, so that the springs can move the punch up. Use the stylet to empty the punch and discard the paraffin core.
Move the turret to switch to the donor punch (Figure 3).
Place the donor block bridge with the donor block over the recipient block holder (Figure 3).
- Push the donor punch into the selected area of the donor block. Use a corresponding hematoxylin and eosin stained slide where the region of interest has been marked to locate the tissue that is to be sampled. Manually hold the donor block in position with your left hand and push the punch with your right hand. Note that you should not push on the stylet. The depth stop does not block the punch motion at the proper position for the donor block, so it is important that you stop pushing when the second mark is visible on the stylet.
- Rotate the handle on the punch once (Figure 3). Slowly release the downwards pressure while still holding the donor block on the donor block bridge.
- The donor tissue is preferably punched 0.5 mm shorter than the recipient core. This process will ensure an adjustable alignment of the cores on the recipient block surface, avoiding loss of valuable representative tissue.
Remove the bridge and the donor block. Make sure that the donor punch is aligned with the hole that was made earlier (point 4). You must adjust the punch position using the set screws if the donor punch and the hole in the recipient block are not aligned.
Carefully push the punch downward until its tip reaches the top of the hole in the recipient block. While holding this position, use the stylet to empty the tissue core into the hole. The core surface should be in alignment with the block surface.
Move the turret back to the recipient punch.
Move to the next position with the XY adjustment knobs.
Repeat from point 4c above until the array is complete.
When the whole recipient block is finished, loosen the screws in the recipient block holder. Bake the block in 42 °C for 40 minutes. Put the block with the sectioning area facing down on a glass slide. Place the glass slide with the block on top of a test tube holder (or other appropriate construction) and place in the oven. After baking, remove the test tube holder from the oven and flatten the surface of the block by gently stroking the glass slide.
Place the block with the glass slide on a cooling plate for 10 minutes. To ensure representative tissue throughout the TMA a quality control on each 50th section is performed.
3. How to Section TMAs (Animation 2)
Cut 4 μm thick sections by using a microtome with section transfer system (HM 355S, Microm). The system can be used with all current rotary microtomes. The system consists of a blade carrier with integrated transfer bridge, a heated water bath and a control unit. From the blade the sections glide on the wet transfer surface via a transfer bridge into the water bath.
The sections should be taken from the water bath immediately after they have stretched out, to avoid melting of sensitive tissue spots (eg. lipid rich tissues like breast and brain). Place the section on a superfrost glass slide. The time the sections can be left in the water depends on the type of paraffin waxed used and the water temperature. Our lab use paraffin wax from HistoLab Products AB, which have a melting point of 56-58 ° C and we recommend a water bath temperature of 37-39 °C.
Place the slides in a slide holder for drying in room temperature (RT) over night.
The slides are baked in 50 °C for 12-24 hours. Using a microtom without STS you have to transport the section from the blade to a water bath manually by using e.g. a brush.
4. Test and Titration Procedure for Immunohistochemistry (Animation 3)
Each antibody is subjected to a standardized test procedure using specially designed TMAs containing a mix of tissues and different cell types. The aim is to assess an individual and optimized immunostaining protocol for each antibody. Initially one dilution, based on antibody stock concentration of the primary antibody is tested. The outcome of this test staining is used to guide further dilutions and optimization of the protocol.
Deparaffinization and hydration in xylene and graded ethanol to distilled water are performed prior to immunostaining.
A blocking step to quench endogeneous peroxidase is performed in 0.3 % H2O2 in 95% ethanol for 5 minutes.
Heat Induced Epitope Retrieval (HIER) is performed in a retrieval buffer pH 6, using a pressure boiler (Decloaking chamber, Biocare Medical) as heat source for 4 minutes at 125 °C. After completed boiling, slides remain in the pressure boiler and are allowed to cool to 90 °C. The total processing time for HIER is approximately 45 minutes.
If no conclusive result is obtained in the initial test, further tests are done based on the observed staining pattern 5 6. A pilot study, within the HPA high-throughput set-up, showed that the most useful antigen retrieval where HIER pH 6, but other retrieval methods such as pre-incubation with proteinase, microwave and boiling in buffer with higher or lower pH can of course be used. By changing the IHC condition eg changing antibody incubation times, antibody dilutions and Diaminobenzidine (DAB) incubation times the staining pattern can give more conclusive results.
5. Staining Program, Autostainer 480 (Thermo Fisher Scientific)
All incubations are done at RT and this protocol can also be used in as a manual setup with the same reagents.
Rinse in wash buffer.
Incubation with Ultra V block for 5 minutes.
Rinse in wash buffer.
Incubation with primary antibody for 30 minutes.
Rinse in wash buffer (x2).
Incubation with labeled horse radish peroxidase-polymer for 30 minutes.
Rinse in wash buffer (x2).
Developing in DAB solution for 10 minutes.
Rinse in wash buffer (x2).
Counterstaining in Mayers hematoxylin for 5 minutes*. When using a progressive staining method (e.g. Mayers hematoxylin) the intensity depends on time and no differentiation is required. A regressive staining method e.g. Harris hematoxylin requires differentiation to remove excess dye from tissues in order to accentuate a structure.
Rinse in tap water*.
Rinse in lithium carbonate water, diluted 1:5 from saturated solution for 1 minute*.
Rinse in tap water for 5 minutes*.
The slides are dehydrated in graded ethanol and slides are coverslipped (PERTEX, Histolab)
All reagents are applied at a volume of 300 μl per slide. * Steps 10-14 are done in a histostaining instrument (Autostainer XL, Leica) and coverslipping is additionally done in a coverslipper system (Automated glass coverslipper CV5030, Leica).
6. How to Scan a Slide
The method of scanning slides is dependant on the digital scanner being utilized, this protocol only defines how to scan a slide using the automated scanning system Aperio XT (Aperio Technologies). In the Human Protein Atlas set-up 20x magnification for the tissue and 40x for the cells are used. Automated scanning could encounter focus problems due to heterogeneity of the tissue and the number of different tissues included in a TMA.
Clean the glass slide from dirt, glue and check for air bubbles between the coverslip and the section. In case of air bubbles remount the slide.
Put the slide in a rack and place the rack in the digital scanner. The time to scan a TMA at 20x magnification is approximately 6 minutes. A software from Aperio is used to select area of interest. Focus point selection is made automatically within the software. Manually selection of scan area and focus points is also possible.
After the image has been generated it can be used for evaluation and annotation of the IHC staining. Images remain as a result file of the experiment and can be distributed to colleagues for discussions and further used for publishing the data. The images can be viewed in a freely available software from Aperio.
7. How to Search for your Favorite Protein in the Human Protein Atlas
Browse to www.proteinatlas.org.
Enter the name of your favorite protein, Ensembl id, UniProt accession number or HGNC name eg insulin.
Enter the summary page and scroll down to normal tissue and organ summary. The overview shows protein expression in pancreas.
Click on "more tissue data". You enter the normal tissues view where you can see all tissues included sorted by organ.
Click on pancreas to view the IHC results for 3 antibodies directed towards the same protein. To view a high-resolution image of pancreas click on the image.
Additional information about protein expression in cancer tissue, cells and further validation data within the Human Protein Atlas can be found by browsing the Human Protein Atlas website.
8. Representative Results
Animation 1. How to prepare tissues for tissue microarray production. Click here to view Animation 1.
Animation 2. How to section TMAs. Click here to view Animation 2.
Animation 3. The immunohistochemistry technique is described. Click here to view Animation 3.
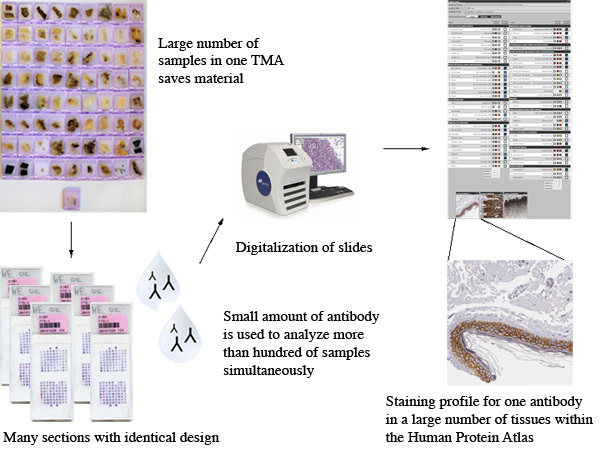 Figure 1. Overall scheme of the process within the Human Protein Atlas Uppsala.
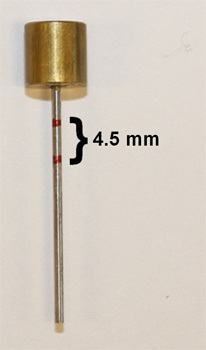 Figure 2. Donor stylet marked for standardized length of tissue cores eg 4.5 mm.
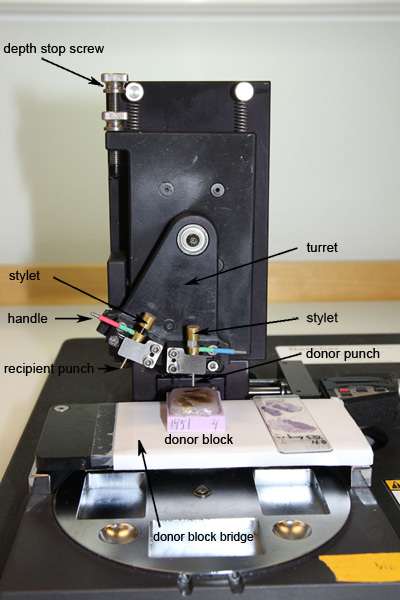 Figure 3. Manual tissue microarrayer.
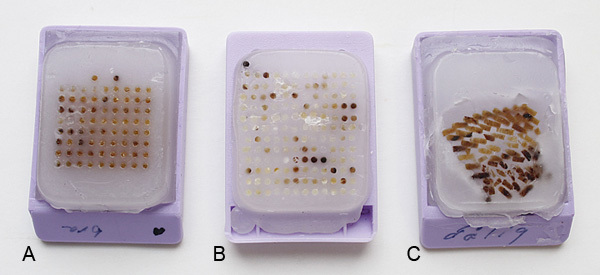 Figure 4. Examples of different quality of produced TMAs. (A) A straight and properly aligned TMA with sufficient space between the rows and columns as well as to the edge of the paraffin. (B) A TMA with some of the cores too close to the edge resulting in probable difficulties when sectioning. (C) A TMA that have been baked for too long resulting in a collapsed TMA without the correct template.
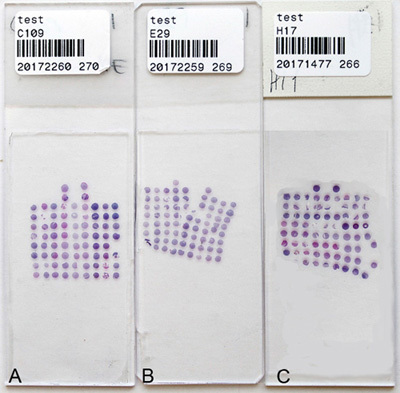 Figure 5. Hematoxylin and eosin stained TMAs. (A) A properly cut section with straight and aligned columns and rows. Using a bad or dirty blade could result in splitting (B) or compressed sections (C).
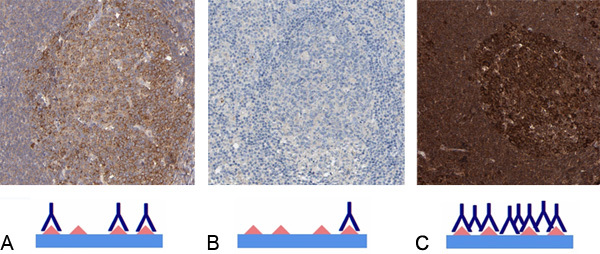 Figure 6. Titration of antibodies. (A) Reaction center cells in lymph node shows an optimally titrated antibody resulting in a specific cytoplasmic staining (shown in brown) without background. (B) The tissue section shows weak staining. Negative or weak staining is found when the concentration of primary antibody is too low or if the target protein is not present in the immunostained tissues. (C) The tissue section is overstained due to use of too high concentration of primary antibody. The dark color results in difficulties determining the subcellular location due to spill over, cross reactivity and false positivity.
Discussion
Immunohistochemistry is by far the most commonly used application for TMAs. The combination of IHC and TMAs can be used in several different settings, e.g. high-throughput screening of protein expression patterns in tissues 7 8 and cells 9 10, biomarker discovery studies based on tissue samples from large patient cohorts 11 12 and more basic tumor biology studies, including different phenotypes/genotypes, differentiation stages, progression and metastasis 13. One advantage of using TMAs is that material from large cohorts can be analyzed at one time, both saving valuable biological material and ensuring more reproducible experiments. Moreover, the use of TMA technology saves on reagent costs and laboratory processing time. As a TMA only contains a limited amount of tissue, tissue heterogeneity is an issue. Depending on the type of tissue and questions to be addressed, several samples may be needed from the same specimen. For tumor tissues, the use of two to four cores from each specimen is recommended as it has been shown to result in a high degree of accuracy in representation of whole tissue sections 13 14. Depending on tissue composition the diameter of the punches (ranging from 0.6 mm to 2 mm) can be adjusted. Tissues are complex and composed of both several different cell types, structures and extra-cellular matrix. The composition of each different tissue type containing variable amount of fat, blood vessels, connective tissue, cartilage etc., will affect the pressure needed for punching and collecting separate cores. It is therefore of importance to practice all steps in the procedure on material that is not of any value, before producing a TMA with defined tissues for the intended experiments.
When sectioning a variety of different tissues within one TMA block the composition of the block could influence the ability to acquire high quality sections. Certain tissues, e.g. skin, bone marrow, fat, brain and breast, render sectioning of the TMA block difficult due to the effect of differences in texture effecting how sections stretch out in the water bath and how different hardness is cut by the blade etc. It is therefore recommended to group tissues with similar features e.g. lipid rich tissue into one TMA, when applicable. The majority of cancer tissues are in this sense homogenous, which facilitates sectioning of cancer TMAs. An alternative sectioning method for stabilizing the microarray cores can be employed when handling a TMA with heterogeneous types of tissues. The use of an adhesive tape can be helpful to avoid the loss of cores and fall-out in the sectioned TMA. The use of adhesive tape should be employed with caution, since the tape can influence the thickness of sectioned cores and subsequently also the outcome of IHC staining 15. In the Human Protein Atlas set-up a TMA template of 9x8 (excluding markers) cores are used. It is of importance to obtain maximal number of sections and keep all tissues represented throughout the block. To save reagents and scanning time, 2 sections are placed on one glass slide allowing a maximum template of 9x8.
The major repository for protein information, Universal Protein Resource 16 includes approximately 20.300 reviewed human protein entries, of which only approximately 66% have evidence at the protein level. Also for a majority of the genes for which there is evidence of existence on the protein level, there is scarce or no information on protein function and distribution of expression. An important challenge for the future is to analyze the distribution pattern and relative abundance of these unknown proteins in various types of human tissue. The information from databases such as Uniprot, ENSEMBL, published data from PubMed can be used as a guide to establish if immunohistochemical staining patterns using antibodies towards unknown proteins represent actual protein profiles of the intended target protein. In addition, several other validation strategies are needed to ensure antibody functionality, for example antibody functionality in protein arrays, Western blot, immunofluorescence, immuno-precipitation and pull-down experiments. Perhaps the most important tool for validation of antibody functionality is to use paired antibodies, i.e. two different antibodies raised against separate, non-overlapping epitopes on the same target protein, to compare assay-specific outcome 17.
Based on the compiled information, antibodies are tested and titrated according to IHC standards and the experience from testing and validating over 35.000 antibodies in the Human Protein Atlas project. For over 20% of all genes with protein profiles, data from paired antibodies (2 or more antibodies towards non-overlapping epitopes on the same protein) has been used to determine a best estimate of the corresponding protein expression pattern. Paired antibodies provide an ultimate strategy for validating specific immunohistochemistry-based protein expression patterns. This strategy is valuable because the multitude of different tissues included in the basic screening increases the risk for cross-reactivity. It should also be noted that certain tissues are in general more prone to show background staining e.g macrophages, smooth muscle, distal tubules in kidney and hepatocytes in liver. Additional issues to consider include variations in tissue processing techniques over time for the tissues taken from archival material, which can result in false negative or inappropriate positive IHC staining patterns. This phenomenon is also encountered in large section analysis. Both negative and positive controls are vital and should be used whenever possible. For deeper studies including functional analyses, cell lines with forced expression and specific knock-down of corresponding transcripts (siRNA technology) can be used to create controls. For optimal results in IHC, it is important to test and use antigen retrieval systems, since the formalin fixation induces various chemical modifications e.g. cross-linking, hydrolysis of Schiff bases masking the antigen 18.
In conclusion, antibody-based proteomics employing TMA technology and IHC is a powerful strategy for generating protein expression data on a large scale. The Human Protein Atlas project has been set up to create a map of human protein expression in normal human tissues and cancer. The aim of this project is to present a first draft of a comprehensive Human Protein Atlas by 2015. In addition to providing protein profiles in normal organs and tissues, this effort also provides a starting point for biomedical research projects, including clinical biomarker discovery efforts. The ultimate goal is to add a next information layer on top of the human genome sequence that will be crucial for a deeper understanding of the biology underlying various disease states, and provide a basis for developing novel diagnostic and therapeutic tools.
Disclosures
We have nothing to disclose.
Acknowledgments
This work was supported by grants from the Knut and Alice Wallenberg foundation. The entire staffs of the Human Protein Atlas centers in Uppsala, Stockholm and India are acknowledged for their efforts to generate the Human Protein Atlas. The authors wish to especially thank Frank Hammar and Sofie Gustafsson for assistance with the photos and Elené Karlberg for assistance with the TMA production when filming.
References
- Battifora H. The multitumor (sausage) tissue block: novel method for immunohistochemical antibody testing. Lab Invest. 1986;55:244–244. [PubMed] [Google Scholar]
- Kononen J, Bubendorf L, Kallioniemi A. Tissue microarrays for high-throughput molecular profiling of tumor specimens. Nat. Med. 1998;4:844–844. doi: 10.1038/nm0798-844. [DOI] [PubMed] [Google Scholar]
- Berglund L, Bjorling E, Oksvold P. A genecentric Human Protein Atlas for expression profiles based on antibodies. Mol. Cell Proteomics. 2008;7:2019. doi: 10.1074/mcp.R800013-MCP200. [DOI] [PubMed] [Google Scholar]
- Uhlen M, Bjorling E, Agaton C. A human protein atlas for normal and cancer tissues based on antibody proteomics. Mol. Cell Proteomics. 2005;4:1920. doi: 10.1074/mcp.M500279-MCP200. [DOI] [PubMed] [Google Scholar]
- Paavilainen L, Edvinsson A, Asplund A. The impact of tissue fixatives on morphology and antibody-based protein profiling in tissues and cells. J. Histochem. Cytochem. 2010;58:237–237. doi: 10.1369/jhc.2009.954321. [DOI] [PMC free article] [PubMed] [Google Scholar]
- Paavilainen L, Wernerus H, Nilsson P. Evaluation of monospecific antibodies: a comparison study with commercial analogs using immunohistochemistry on tissue microarrays. Appl. Immunohistochem. Mol. Morphol. 2008;16:493–493. doi: 10.1097/PAI.0b013e31817c645e. [DOI] [PubMed] [Google Scholar]
- Kampf C, Andersson AC, Wester K. Antibody-based tissue profiling as a tool for clinical proteomics. Clinical Proteomics. 2004;1:285–285. [Google Scholar]
- Ponten F, Jirstrom K, Uhlen M. The Human Protein Atlas - a tool for pathology. J. Pathol. 2008;216:387–387. doi: 10.1002/path.2440. [DOI] [PubMed] [Google Scholar]
- Andersson AC, Stromberg S, Backvall H. Analysis of protein expression in cell microarrays: a tool for antibody-based proteomics. J. Histochem. Cytochem. 2006;54:1413–14. doi: 10.1369/jhc.6A7001.2006. [DOI] [PMC free article] [PubMed] [Google Scholar]
- Stromberg S, Bjorklund MG, Asplund C. A high-throughput strategy for protein profiling in cell microarrays using automated image analysis. Proteomics. 2007;7:2142. doi: 10.1002/pmic.200700199. [DOI] [PubMed] [Google Scholar]
- Jogi A, Brennan DJ, Ryden L. Nuclear expression of the RNA-binding protein RBM3 is associated with an improved clinical outcome in breast cancer. Mod. Pathol. 2009;22:1564. doi: 10.1038/modpathol.2009.124. [DOI] [PubMed] [Google Scholar]
- Magnusson K, De Wit M, Brennan DJ. SATB2 in combination with cytokeratin 20 identifies over 95% of all colorectal carcinomas. Am. J. Surg. Pathol. 2011;35:937. doi: 10.1097/PAS.0b013e31821c3dae. [DOI] [PubMed] [Google Scholar]
- Nocito A, Kononen J, Kallioniemi OP. Tissue microarrays (TMAs) for high-throughput molecular pathology research. Int. J. Cancer. 2001;94:1. doi: 10.1002/ijc.1385. [DOI] [PubMed] [Google Scholar]
- Rimm DL, Camp RL, Charette LA. Tissue microarray: a new technology for amplification of tissue resources. Cancer J. 2001;7:24. [PubMed] [Google Scholar]
- Catchpoole D, Mackie N, McIver S. Tape transfer sectioning of tissue microarrays introduces nonspecific immunohistochemical staining artifacts. Biotech. Histochem. 2010. [DOI] [PubMed]
- UniProt Nucleic acids research. 2011;39:D214. doi: 10.1093/nar/gkq1020. [DOI] [PMC free article] [PubMed] [Google Scholar]
- Uhlen M, Oksvold P, Fagerberg L. Towards a knowledge-based Human Protein Atlas. Nature Biotechnol. 2010;28:1248. doi: 10.1038/nbt1210-1248. [DOI] [PubMed] [Google Scholar]
- Leong AS, Leong TY. Standardization in immunohistology. Method Mol. Cell Biol. 2011;724:37. doi: 10.1007/978-1-61779-055-3_3. [DOI] [PubMed] [Google Scholar]


