Abstract
Insulin produces capillary recruitment in skeletal muscle through a nitric oxide (NO)-dependent mechanism. Capillary recruitment is blunted in obese and diabetic subjects and contributes to impaired glucose uptake. This study's objective was to define whether inactivity, in the absence of obesity, leads to impaired capillary recruitment and contributes to insulin resistance (IR). A comprehensive metabolic and vascular assessment was performed on 19 adult male rhesus macaques (Macaca mulatta) after sedation with ketamine and during maintenance anesthesia with isoflurane. Thirteen normal-activity (NA) and six activity-restricted (AR) primates underwent contrast-enhanced ultrasound to determine skeletal muscle capillary blood volume (CBV) during an intravenous glucose tolerance test (IVGTT) and during contractile exercise. NO bioactivity was assessed by flow-mediated vasodilation. Although there were no differences in weight, basal glucose, basal insulin, or truncal fat, AR primates were insulin resistant compared with NA primates during an IVGTT (2,225 ± 734 vs. 5,171 ± 3,431 μg·ml−1·min−1, P < 0.05). Peak CBV was lower in AR compared with NA primates during IVGTT (0.06 ± 0.01 vs. 0.12 ± 0.02 ml/g, P < 0.01) and exercise (0.10 ± 0.02 vs. 0.20 ± 0.02 ml/g, P < 0.01), resulting in a lower peak skeletal muscle blood flow in both circumstances. The insulin-mediated changes in CBV correlated inversely with the degree of IR and directly with activity. Flow-mediated dilation was lower in the AR primates (4.6 ± 1.0 vs. 9.8 ± 2.3%, P = 0.01). Thus, activity restriction produces impaired skeletal muscle capillary recruitment during a carbohydrate challenge and contributes to IR in the absence of obesity. Reduced NO bioactivity may be a pathological link between inactivity and impaired capillary function.
Keywords: echocardiography, regional blood flow, inactivity
inactive lifestyles and the rising rates of obesity in the US are leading to an increased incidence of adult-onset type 2 diabetes mellitus (DM) and cardiovascular disease (8, 15). The contribution of physical inactivity as a risk factor for insulin resistance (IR) and DM has been firmly established, although the link has not been fully defined (2, 14). One potential link may be in the vascular actions of insulin, which are mediated by molecular events downstream from insulin receptor signaling (13).
In healthy individuals, both exercise and physiological hyperinsulinemia increase skeletal muscle blood flow in part through capillary recruitment (6, 7, 30). Insulin-mediated capillary recruitment occurs in an nitric oxide (NO)-dependent manner within minutes and increases the surface area for glucose uptake, thus contributing to postprandial glucose storage (28, 29). There is evidence that abnormal capillary recruitment plays a primary role in the development of IR by limiting the surface area available for glucose uptake. Contrast-enhanced ultrasound (CEU) studies have demonstrated that capillary recruitment in response to insulin or carbohydrate loading is impaired in states of obesity and DM (4, 5). This impairment can be overcome by contractile exercise, which acutely augments both capillary recruitment and insulin-mediated glucose uptake in muscle (9, 34). Moreover, exercise training in normal and insulin-resistant rats has been shown to improve insulin-mediated glucose uptake, capillary recruitment, and NO-mediated vasodilation, suggesting that exercise potentiates vascular insulin sensitivity as well (17, 19).
In the current study, we tested the hypothesis that inactivity alone, in the absence of obesity, leads to abnormal capillary recruitment and contributes to the development of insulin resistance. To test this hypothesis, CEU was performed to assess capillary responses to glucose challenge and exercise in activity-restricted (AR) nonhuman primates.
METHODS
Study design.
The ethics and protocols for this study were approved by the Animal Care and Use Committee of the Oregon National Primate Research Center and conform to the Guidelines for the Care and Use of Laboratory Animals published by the National Institutes of Health. Nineteen adult male rhesus macaques (Macaca mulatta) 9–12 yr of age were studied. Thirteen animals were AR for a mean of 6 yr in single-cage housing that conformed to US Department of Agriculture and Association for Assessment and Accreditation of Laboratory Animal Care guidelines. The remaining six animals formed the normal-activity (NA) cohort and were group housed in large (1-acre) corrals with access to play structures. All animals were a fed standard chow diet (fiber-balanced monkey diet) in which total caloric content was balanced between carbohydrates (58%), protein (27%), and fat (15%). For all studies, primates were fasted overnight. Telazol (5 mg/kg im) was used for sedation during intravenous glucose tolerance tests (IVGTT) and dual X-ray absorptiometry (DEXA) scans. Ketamine (10 mg/kg im) was used for sedation during ultrasound studies along with isoflurane (1.0–1.5%) for maintenance general anesthesia. A certified primate surgical technician evaluated eyelid activity and end tidal carbon dioxide levels continuously to ensure the adequacy of anesthesia. IVGTTs were performed to assess insulin sensitivity, and DEXA scans were performed for body morphometry. On a separate day, bioactivity of NO was assessed by brachial artery flow-mediated vasodilation (FMD), and skeletal muscle CEU was performed. CEU of the forearm flexors was performed at rest and during contractile exercise, whereas CEU of the gastrocnemius was performed during an intravenous glucose challenge.
IVGTT.
Animals received dextrose (600 mg/kg) intravenously for 1 min. Venous blood samples were obtained at baseline and at 1, 3, 5, 10, 20, 40, and 60 min after injection for measurement of blood glucose (Freestyle; Abbott Laboratories) and plasma insulin concentration by radioimmunoassay (Immulite 2000; Siemens Medical Systems). Time concentration curves were plotted, and data were expressed as the glucose or insulin area-under-the-curve (AUC) concentration from time baseline to 60 min. These parameters where chosen to distinguish the degree of IR between the cohorts due to the heterogeneity in the severity and temporal course of IR in rhesus macaques (11).
Muscle mass and truncal fat assessment.
Body composition for the determination of bone mineral content, lean mass, and fat mass was assessed by DEXA imaging (Discovery A; Hologic). Skeletal muscle mass was computed as the lean mass (kg) of the bilateral extremities. Truncal fat data are expressed as the ratio of truncal fat mass to truncal total mass.
FMD.
The brachial artery was imaged in its long axis using a linear-array 2-D ultrasound transducer (15L8, Sequoia; Siemens Medical Systems) at 10 MHz. Pulsed-wave Doppler was performed to measure centerline average peak velocity. Data were acquired at baseline and every 30 s for 3 min after ischemia produced by 5-min insufflation of a forearm cuff to 50 mmHg above systolic pressure. Brachial artery diameter was measured by averaging nine separate end-diastolic measurements over three cardiac cycles. FMD data were expressed as absolute change in diameter and percent change from baseline.
Skeletal muscle perfusion and functional capillary blood volume.
CEU imaging (Sequoia 512; Siemens Medical Systems) was performed using a linear array transducer at a transmit frequency of 7 MHz. The nonlinear fundamental signal for microbubble contrast agent was detected using multipulse phase and amplitude modulation at a mechanical index of 1.4. Muscles were imaged in the transverse plane, and gain settings were kept constant. Lipid-shelled octafluoropropane microbubbles (Definity; Lantheus Medical Imaging) were diluted with saline (1.3 ml to total volume 30 ml) and infused at intravenously at a rate of 1 ml/min for skeletal muscle imaging and at 0.25 ml/min for blood pool imaging. Blood pool microbubble signal intensity (IB) was determined by averaging several frames during brachial artery imaging at a pulsing interval (PI) of 2 s. Skeletal muscle CEU data were acquired at a PI of 0.075 to 15 s. Several frames acquired at a PI of 0.075 were averaged and used as background to generate background-subtracted time intensity data that were fit to the function y = A(1 − eβt), where y is intensity at time t, A is the plateau intensity reflecting relative blood volume, and the rate constant β is the microvascular flux rate (7, 33). Capillary blood volume (CBV) was quantified by A/(1.06 × IB × F), where 1.06 is tissue density (g/cm3), and F is the scaling factor for the different infusion rate for IB, which was reduced to avoid dynamic range saturation. Microvascular blood flow was quantified by the product of CBV and β (7, 33). Skeletal muscle CEU in the forearm flexors was assessed at rest and 90 s after initiation of contractile exercise via muscle electrostimulation at 1 Hz (10 mA, 1-ms pulse width). CEU of the gastrocnemius was performed at rest and at 15 and 30 min after intravenous administration of dextrose (600 mg/kg for 1 min).
Plasma lipids, inflammatory biomarkers, and epoxyeicosatrienoic acid.
Venous blood samples were collected under general anesthesia for measurement of serum cholesterol and triglycerides. Inflammatory biomarker profile was determined using human inflammatory panel MAP version 1.6 (Rules Based Medicine), which provides cross-reactivity with nonhuman primates for many biomarkers. Plasma 14,15-epoxyeicosatrienoic acid (14,15-EET) level was measured by liquid chromatography-mass spectrometry.
Physical activity level.
Average daily activity level was measured by radiotelemetry collars that detect activity through an accelerometer (Actcall Philips Respironics). Data were obtained only for the AR cohort due to concerns regarding collar use in an unrestricted and group-housed setting. The total daily activity counts were averaged for 2 wk.
Statistical analysis.
Data were analyzed by Prism (version 5.0; GraphPad Software) and are expressed as either means ± SD (Table 1) or means ± SE (Table 2 and Figs. 1–3). D'Agostino and Pearson omnibus test were used to assess data normality. Parametric data were analyzed with unpaired Student's t-test and Pearson's product test for correlations. Nonparametric data were analyzed with Mann-Whitney U-test and Spearman's Rho values for correlations. Studies were performed in a shared primate resource with a maximum of 13 AR primates that were eligible for a comprehensive metabolic and vascular assessment, whereas only six NA primates were identified as age- and weight-matched controls. As such, a priori sample size calculations were not performed.
Table 1.
Demographics, vital signs, and metabolic data
| Normal Activity | Activity Restricted | |
|---|---|---|
| Age, yr | 10.1 ± 1.3 | 9.6 ± 0.9 |
| Heart rate, beats/min | 115 ± 23 | 122 ± 15 |
| Systolic BP, mmHg | 97 ± 14 | 87 ± 10 |
| Diastolic BP, mmHg | 42 ± 8 | 39 ± 11 |
| Weight, kg | 11.5 ± 2.1 | 11.1 ± 1.8 |
| Skeletal muscle mass, kg | 3.4 ± 1.0 | 3.3 ± 0.5 |
| Truncal fat, % | 23 ± 9.5 | 21 ± 8.9 |
| Basal glucose, mg/dl | 67 ± 16 | 61 ± 7 |
| Basal insulin, μg/ml | 11 ± 4 | 19 ± 13 |
| Insulin AUC, μg·ml−1·min−1 | 2,225 ± 734 | 5,171 ± 3,431* |
Data are means ± SD. BP, blood pressure; AUC, area under the curve concentration.
P < 0.05 vs. normal activity. Data are parametric except for weight, systolic BP, and diastolic BP.
Table 2.
Lipid profile and inflammatory biomarkers
| Normal Activity | Activity Restricted | |
|---|---|---|
| Total cholesterol, mg/dl | 112 ± 8.0 | 129 ± 6.5 |
| HDL cholesterol, mg/dl | 55 ± 5.3 | 61 ± 4.9 |
| LDL cholesterol, mg/dl | 47 ± 8.7 | 56 ± 3.5 |
| Triglycerides, mg/dl | 21 ± 5.2 | 41 ± 6.1* |
| CRP, μg/ml | 0.15 ± 0.06 | 0.13 ± 0.04 |
| Endothelin-1, pg/ml | 4.7 ± 2.9 | 15.4 ± 5.2 |
| TNFα, pg/ml | NCR | NCR |
| Interleukin-1, pg/ml | NCR | NCR |
| Interleukin-8, pg/ml | 516 ± 72 | 1,269 ± 331 |
| Interleukin-10, pg/ml | NCR | NCR |
| MIP-1β, pg/ml | 135 ± 11 | 180 ± 24 |
| PAI-1, ng/ml | 10.2 ± 1.2 | 19.7 ± 5.7 |
| RANTES, ng/ml | 1.8 ± 0.3 | 8.3 ± 3.7 |
| MDC, pg/ml | 46 ± 9.3 | 74 ± 8.8* |
Data are means ± SE. CRP, C-reactive protein; MIP, macrophage inflammatory protein-1β; MDC, monocyte-derived chemokine; NCR, non-cross reactive; PAI-1, plasminogen activator inhibitor-1; RANTES, regulated-on-activation normal T cell-expressed and -secreted chemokine;
P < 0.05 vs. normal activity. Data are parametric except for CRP, endothelin-1, MIP-1β, PAI-1, and RANTES.
Fig. 1.
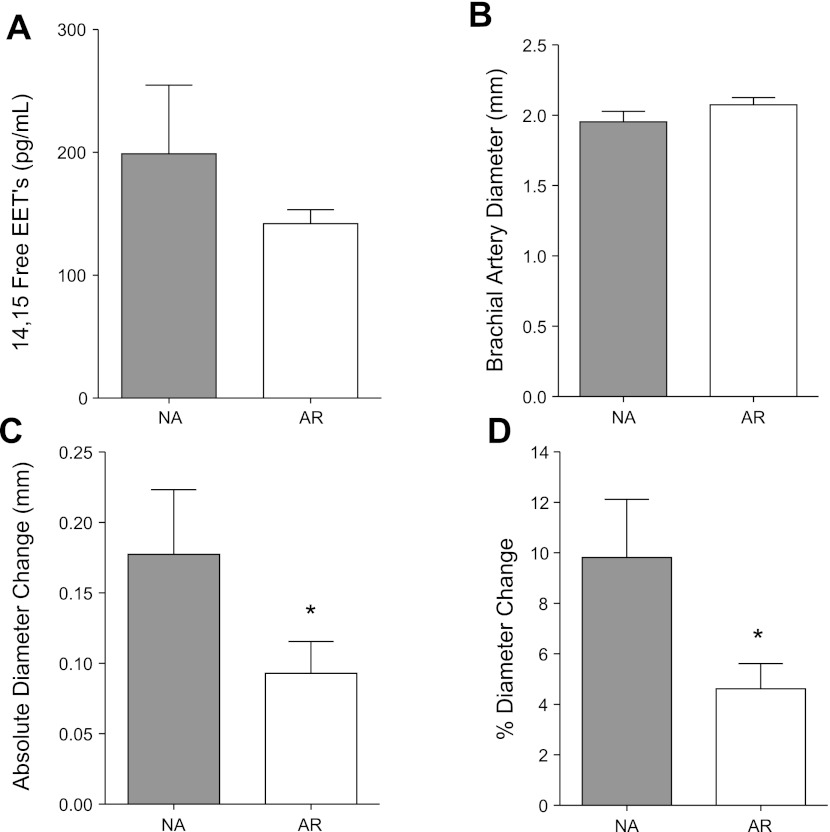
Assessment of 14,15-epoxyeicosatrienoic acids (14,15-EETs) and nitric oxide-mediated vasodilation. A: mean (± SE) values for 14,15-EET levels. B: baseline brachial artery dimension. C: postocclusive change in brachial artery dimension from baseline. D: %change in brachial artery dimension. *P < 0.05 vs. normal activity (NA) group. AR, activity restricted.
Fig. 3.
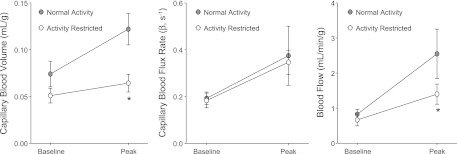
Gastrocnemius baseline and peak perfusion after glucose challenge. Mean (± SE) values for CBV, capillary blood flux rate, and microvascular blood flow from contrast-enhanced ultrasound performed at baseline and peak hyperemia during intravenous glucose tolerance test (IVGTT). *P < 0.05 vs. NA group.
RESULTS
Metabolic and morphometric data.
Body weight, skeletal muscle mass, and truncal fat were similar between the NA and AR cohorts, indicating that neither obesity nor loss of muscle mass developed in the AR group despite activity restriction for 6 ± 2 yr (Table 1). Although the basal insulin and glucose levels were not significantly different between groups, the AR animals had elevated insulin concentration AUC during IVGTT, indicating an insulin-resistant state.
Lipids and biomarker profile.
There were no group-related differences in cholesterol content, whereas triglyceride levels were mildly elevated in the AR cohort (Table 2). Although plasma C-reactive protein was not different between the cohorts, AR animals had significantly higher monocyte-derived chemokine concentration and nonsignificant trends toward higher concentration of endothelin-1 (ET-1), interleukin-8, macrophage inflammatory protein-1β, plasminogen activator inhibitor-1 (PAI-1), and the regulated-on-activation normal T cell-expressed and -secreted chemokine.
Vasoactive assays: 14,15-EET and NO bioactivity.
In the AR group, there was a nonsignificant trend toward lower concentrations of plasma 14,15-EET, an endothelial-derived hyperpolarizing factor implicated in IR (18) (Fig. 1A). Bioactivity of NO was assessed by FMD. Baseline brachial dimensions were not significantly different between the two cohorts (Fig. 1B). However, FMD, assessed by both the absolute and fractional (%) changes in diameter, was significantly reduced in the AR compared with NA cohort (Fig. 1, C and D). There were no group-related differences in brachial artery velocity on Doppler imaging immediately after reflow (average peak velocity 0.42 ± 0.11 vs. 0.49 ± 0.06 m/s for AR and NA, respectively, P = 0.19), implying no significant differences in shear conditions.
Skeletal muscle microvascular response to contractile exercise.
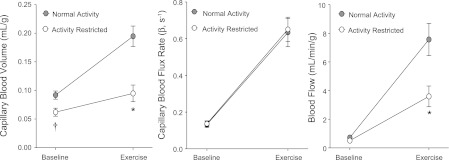
At rest, forearm flexor muscle CBV was slightly lower in the AR compared with NA cohorts, whereas capillary blood flux rate and blood flow were similar between groups (Fig. 2). Contractile exercise produced a similar increase in the peak capillary blood flux rate between the groups. However, there was less of an increase in CBV during exercise in the AR cohort. As a result, skeletal muscle blood flow, calculated by the product of CBV and the capillary blood flux rate, increased to a greater degree in the NA animals.
Fig. 2.
Forearm flexor perfusion at rest and during exercise. Mean (± SE) values for capillary blood volume (CBV), capillary blood flux rate, and microvascular blood flow from contrast-enhanced ultrasound performed at baseline and during contractile exercise for NA and AR primates. *P < 0.05 vs. NA group; †P < 0.05 vs. baseline.
Skeletal muscle microvascular response to glucose challenge.
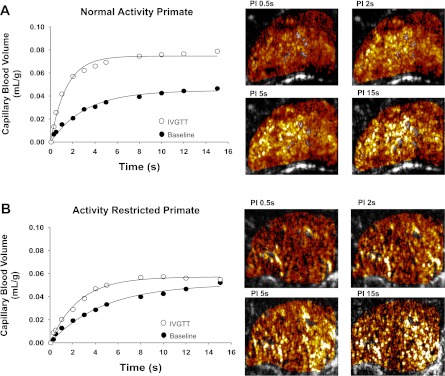
At baseline, gastrocnemius CBV, capillary blood flux rate, and blood flow were similar between the AR and NA cohorts (Fig. 3). After an intravenous glucose challenge, peak capillary blood flux rate increased to a similar degree for AR and NA animals. However, the peak CBV and the change in CBV from baseline (CBV reserve) were reduced significantly in the AR compared with NA animals, indicating less capillary recruitment in response to glucose challenge. As a result, peak skeletal muscle blood flow and the change in blood flow in response to glucose were greater in NA animals. Examples of CEU data obtained at rest and during intravenous glucose challenge from a NA and AR animal are illustrated in Fig. 4.
Fig. 4.
Contrast-enhanced ultrasound in a NA and an AR primate. Contrast-enhanced ultrasound time vs. CBV curves obtained during rest and peak hyperemia during an IVGTT for a NA subject (A) and an AR subject (B). Corresponding background-subtracted color-coded contrast-enhanced ultrasound images at increasing pulsing intervals (PI) are at right.
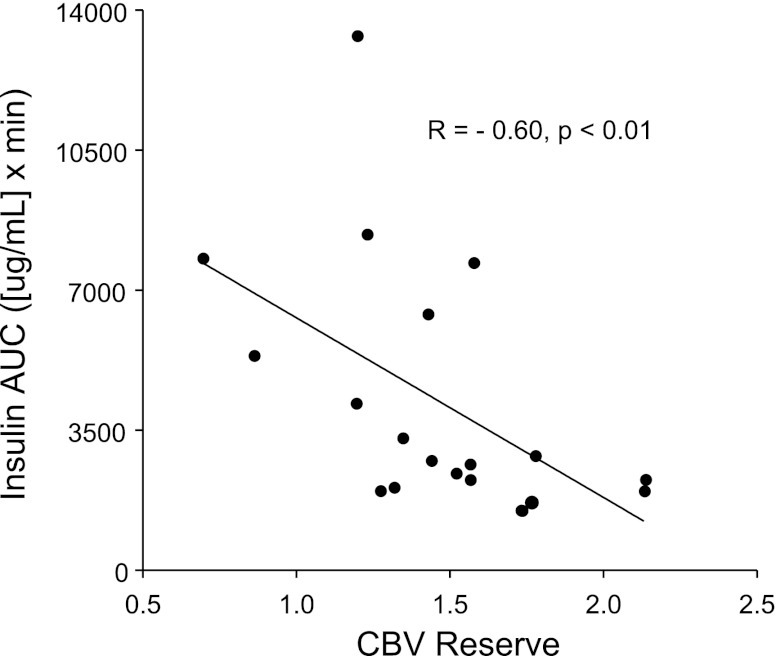
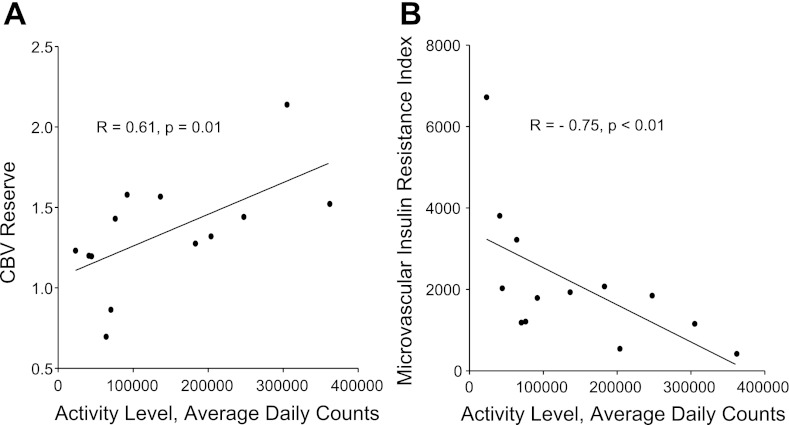
When CBV reserve was analyzed as a continuous variable, there was an inverse correlation between the degree of capillary recruitment (CBV reserve) and the insulin AUC during glucose challenge (Fig. 5), indicating a significant association between impaired microvascular capillary recruitment and IR. To further investigate the idea that activity restriction results in a blunted capillary response to insulin, a microvascular IR index was calculated as the ratio of the peak change in insulin concentration to the peak CBV. The microvascular insulin resistance index was markedly elevated in the AR cohort compared with the NA cohort (2,150 ± 460 vs. 347 ± 15, P < 0.01).
Fig. 5.
Correlation of CBV reserve and insulin resistance. Relation between CBV reserve and insulin area under the curve (AUC) during IVGTT (Spearman's test).
The daily activity for animals measured by radiotelemetry collars showed considerable variation within the AR cohort despite similar environments. When daily activity level was analyzed as a continuous variable, there was a significant positive correlation between average daily activity and CBV reserve (Fig. 6A), indicating a relationship between the degree of activity and the degree of capillary recruitment. Furthermore, there was also a significant inverse correlation between daily activity and the microvascular insulin resistance index (Fig. 6B), indicating a relationship between inactivity and the degree of microvascular IR.
Fig. 6.
Correlation of activity with CBV reserve and microvascular insulin resistance. Relation between daily activity and either CBV reserve during IVGTT (Pearson's test; A) or microvascular insulin resistance index = (Δinsulin/peak CBV) during IVGTT (Spearman's test; B).
DISCUSSION
It has been demonstrated previously that IR can develop after various durations of physical inactivity in both human and nonhuman primates (1, 10, 11, 26). Our study identified for the first time that impaired capillary recruitment occurs as a result of inactivity and probably contributes mechanistically to the development of IR. In addition, this study has provided a potential mechanistic link between impaired capillary recruitment and IR by demonstrating a concurrent reduction in NO bioactivity. Another novel finding of this study was that the impairment in capillary recruitment after activity restriction occurred in the absence of abdominal adiposity, hypertension, and systemic inflammation. Overall, our data indicate that a direct relationship between the degree of inactivity and the degree of insulin-mediated capillary recruitment exists, with reduced NO bioactivity as a potential mechanistic link that contributes to the development of IR.
Our study hypothesis that inactivity alone leads to abnormal capillary recruitment and contributes to the development of IR is based on previous work that demonstrated the importance of recruitable capillary surface area for the diffusion of glucose into skeletal muscle (3). In these previous studies, reduced glucose storage capacity was associated with a reduction in recruitable CBV, measured by capillary xanthine-oxidase activity or CEU, in obese and insulin-resistant animals and humans (4, 5, 32). Furthermore, the importance of capillary recruitment for both glucose uptake and insulin delivery is supported by the reduction in insulin-mediated glucose uptake and insulin receptor signaling after graded microsphere occlusion of skeletal muscle microcirculation without a change in basal glucose uptake and insulin receptor signaling (31). In aggregate, these studies together with our data suggest that microvascular dysfunction is not simply a downstream consequence of DM. Rather, microvascular dysfunction contributes to the development of IR by reducing the capillary surface area needed for the proper transport of glucose and insulin to their sites of metabolic action.
In this study, there was a significant reduction in the capillary response not only to insulin but to exercise as well. This finding may produce some controversy since there are conflicting past data on whether microvascular responses to exercise are impaired in obesity or uncomplicated DM (9, 19, 20, 34, 35). Furthermore, whether impaired exercise-mediated capillary recruitment also contributes to the pathogenesis of IR is unclear, because our study did not define a relationship between the degree of IR and impaired exercise-mediated capillary recruitment. However, when the peak blood volume in response to either contractile exercise (Fig. 2) or to a glucose bolus (Fig. 3) is examined, there is a nearly identical twofold increase in the peak blood volume achieved by the NA cohort. These results suggest that reduced physical activity produces a broad resistance to metabolic stimuli that normally produce capillary recruitment and imply that a generalized mircovascular dysfunction may be contributing to the pathophysiology of metabolic disease states.
Although our study was not able to definitively identify a specific molecular mechanism for the impaired capillary recruitment, our results support the thought that reduced NO bioactivity plays an important role. The predominant microvascular effects of insulin, including capillary recruitment, are NO-dependent and involve downstream insulin receptor signaling and endothelial NO synthase activation through the common phosphatidylinositol (PI) 3-kinase/Akt pathway (21, 25, 29). The slightly increased ET-1 in AR animals in our study is consistent with the concept of a shift in downstream insulin receptor signaling, which differentially controls NO (PI 3-kinase/Akt pathway) and ET-1 production (MAP kinase pathway) (13). Our data that support a possible mechanistic link between impaired NO bioactivity and IR are supported further by findings in a recent nonhuman primate model of metabolic syndrome that demonstrated similar reductions in FMD (36). In addition to shear mediated NO vasodilatory pathways, we also studied the prostaglandin metabolite 14,15-EET, which has vasodilatory actions (both direct and indirect through NO) that become impaired in small-animal models of obesity and IR (18). Interventions that increase 14,15-EET through inhibition of soluble epoxide hydrolase have been shown to increase insulin sensitivity (16). In our study, we were intrigued to find lower 14,15-EET levels in AR animals. Although these differences were not significant, they are hypothesis generating and thus need further investigation in larger primate cohorts.
Although not a major focus of this study, we investigated for any difference in inflammatory biomarkers since a heightened inflammatory state may contribute to the pathogenesis of IR and to increased risk for cardiovascular disease in IR subjects. For the markers that cross-reacted with our rhesus macaque cohorts, almost all were higher in the AR animals, although for most markers these differences did not reach statistical significance.
There are several limitations of our study worth noting. Although we believe that the reduced CBV reserve in AR animals was from a functional impairment in the capillary response, we did not exclude a morphological reduction in capillary number. However, previous CEU studies in obese insulin-resistant rats have demonstrated marked reductions in insulin-mediated CBV reserve without evidence for capillary rarefaction on histology (4). Although the bioactivity of NO was reduced in the AR animals, we were unable to examine whether there were other microvascular regulatory defects. The shared nature of the primate resource limited our ability to test brachial artery reactivity in response to direct NO donors and smooth muscle vasodilators. This testing would have allowed us to further differentiate whether abnormal NO bioactivity occurred from problems with endothelial generation, excess NO scavenging, a vascular smooth muscle cell defect, or whether there was a generalized microvascular defect similar to what has been described in obese humans with the metabolic syndrome (22). We also did not completely exclude other potential mechanisms for IR in the AR group. Since triglyceride levels increased slightly with inactivity, IR from lipotoxicity cannot be excluded (23, 24). In addition, although inflammatory biomarkers tended to rise with activity restriction, TNFα (known to impair insulin signaling) could not be measured because of a lack of cross-reactivity with the human assay. Unfortunately, activity monitoring was possible in the AR cohort only, and no significant correlations between physical activity and either the exercise CBV response or FMD were noted. Finally, we have not proven mechanistically that inactivity leads to impaired capillary recruitment, which in turn contributes to the development of IR. However, we have provided compelling evidence that varying degrees of activity are associated with impaired capillary recruitment (Fig. 6A) and microvascular insulin resistance (Fig. 6B). Furthermore, across the entire cohort of animals, the degree of impaired capillary recruitment, modifiable by increasing activity levels, was strongly associated with the development of IR (Fig. 5). Although it is true that cause and effect are difficult to prove, there is an overwhelming preponderance of published data in rat, human, and now nonhuman primate studies that strongly suggests that inactivity alone, in the absence of obesity, leads to abnormal capillary recruitment and contributes to the development of IR.
We believe the results of this study have significant health implications because of the epidemiological evidence linking physical inactivity to IR and increased cardiovascular risk (8, 12). Understanding both the onset and microvascular mechanisms for IR in the setting of reduced physical activity may alter how providers counsel their patients on adherence to physical activity guidelines (27). In addition, our results and techniques may provide both the insight and the ability to follow how increasing physical activity and targeted therapies for improving microvascular function will have a direct and dependent outcome on the development of IR.
GRANTS
This work was supported by American Heart Association Fellow-to-Faculty Award 0875005N (S. M. Chadderdon) and National Institute of Diabetes and Digestive and Kidney Diseases Grants R01-DK-063508 (J. R. Lindner) and R01-DK-79194 (K. Grove).
DISCLOSURES
All authors have read the manuscript, approve of the submission, and have no conflicts to declare.
AUTHOR CONTRIBUTIONS
S.M.C., K.L.G., and J.R.L. did the conception and design of the research; S.M.C., J.T.B., and L.P. performed the experiments; S.M.C., J.T.B., E.S., L.P., and P.K. analyzed the data; S.M.C. interpreted the results of the experiments; S.M.C. prepared the figures; S.M.C. drafted the manuscript; S.M.C., K.L.G., and J.R.L. edited and revised the manuscript; S.M.C., J.T.B., E.S., L.P., P.K., K.L.G., and J.R.L. approved the final version of the manuscript.
REFERENCES
- 1. Arciero PJ, Smith DL, Calles-Escandon J. Effects of short-term inactivity on glucose tolerance, energy expenditure, and blood flow in trained subjects. J Appl Physiol 84: 1365–1373, 1998 [DOI] [PubMed] [Google Scholar]
- 2. Balkau B, Mhamdi L, Oppert JM, Nolan J, Golay A, Porcellati F, Laakso M, Ferrannini E. Physical activity and insulin sensitivity: the RISC study. Diabetes 57: 2613–2618, 2008 [DOI] [PMC free article] [PubMed] [Google Scholar]
- 3. Bonadonna RC, Saccomani MP, Del Prato S, Bonora E, DeFronzo RA, Cobelli C. Role of tissue-specific blood flow and tissue recruitment in insulin-mediated glucose uptake of human skeletal muscle. Circulation 98: 234–241, 1998 [DOI] [PubMed] [Google Scholar]
- 4. Clerk LH, Vincent MA, Barrett EJ, Lankford MF, Lindner JR. Skeletal muscle capillary responses to insulin are abnormal in late-stage diabetes and are restored by angiotensin-converting enzyme inhibition. Am J Physiol Endocrinol Metab 293: E1804–E1809, 2007 [DOI] [PubMed] [Google Scholar]
- 5. Clerk LH, Vincent MA, Jahn LA, Liu Z, Lindner JR, Barrett EJ. Obesity blunts insulin-mediated microvascular recruitment in human forearm muscle. Diabetes 55: 1436–1442, 2006 [DOI] [PubMed] [Google Scholar]
- 6. Coggins M, Lindner J, Rattigan S, Jahn L, Fasy E, Kaul S, Barrett E. Physiologic hyperinsulinemia enhances human skeletal muscle perfusion by capillary recruitment. Diabetes 50: 2682–2690, 2001 [DOI] [PubMed] [Google Scholar]
- 7. Dawson D, Vincent MA, Barrett EJ, Kaul S, Clark A, Leong-Poi H, Lindner JR. Vascular recruitment in skeletal muscle during exercise and hyperinsulinemia assessed by contrast ultrasound. Am J Physiol Endocrinol Metab 282: E714–E720, 2002 [DOI] [PubMed] [Google Scholar]
- 8. Flegal KM, Carroll MD, Ogden CL, Curtin LR. Prevalence and trends in obesity among US adults, 1999–2008. JAMA 303: 235–241, 2010 [DOI] [PubMed] [Google Scholar]
- 9. Hallsten K, Yki-Jarvinen H, Peltoniemi P, Oikonen V, Takala T, Kemppainen J, Laine H, Bergman J, Bolli GB, Knuuti J, Nuutila P. Insulin- and exercise-stimulated skeletal muscle blood flow and glucose uptake in obese men. Obes Res 11: 257–265, 2003 [DOI] [PubMed] [Google Scholar]
- 10. Hamburg NM, McMackin CJ, Huang AL, Shenouda SM, Widlansky ME, Schulz E, Gokce N, Ruderman NB, Keaney JF, Jr, Vita JA. Physical inactivity rapidly induces insulin resistance and microvascular dysfunction in healthy volunteers. Arterioscler Thromb Vasc Biol 27: 2650–2656, 2007 [DOI] [PMC free article] [PubMed] [Google Scholar]
- 11. Hansen BC, Bodkin NL. Heterogeneity of insulin responses: phases leading to type 2 (non-insulin-dependent) diabetes mellitus in the rhesus monkey. Diabetologia 29: 713–719, 1986 [DOI] [PubMed] [Google Scholar]
- 12. Hughes E; Centers for Disease Control Surveillance for Certain Health Behaviors Among States and Selected Local Areas: United States, 2008. Atlanta, GA: Office of Surrveillance, Epidemiology, and Laboratory Services, Centers for Disease Control and Prevention, US Department of Health and Human Services, 2010, p. 221 [Google Scholar]
- 13. Kim JA, Montagnani M, Koh KK, Quon MJ. Reciprocal relationships between insulin resistance and endothelial dysfunction: molecular and pathophysiological mechanisms. Circulation 113: 1888–1904, 2006 [DOI] [PubMed] [Google Scholar]
- 14. Knowler WC, Barrett-Connor E, Fowler SE, Hamman RF, Lachin JM, Walker EA, Nathan DM. Reduction in the incidence of type 2 diabetes with lifestyle intervention or metformin. N Engl J Med 346: 393–403, 2002 [DOI] [PMC free article] [PubMed] [Google Scholar]
- 15. Lloyd-Jones D, Adams RJ, Brown TM, Carnethon M, Dai S, De Simone G, Ferguson TB, Ford E, Furie K, Gillespie C, Go A, Greenlund K, Haase N, Hailpern S, Ho PM, Howard V, Kissela B, Kittner S, Lackland D, Lisabeth L, Marelli A, McDermott MM, Meigs J, Mozaffarian D, Mussolino M, Nichol G, Roger VL, Rosamond W, Sacco R, Sorlie P, Roger VL, Thom T, Wasserthiel-Smoller S, Wong ND, Wylie-Rosett J; American Heart Association Statistics Committee Stroke Statistics Subcommittee Heart disease and stroke statistics—2010 update: a report from the American Heart Association. Circulation 121: e46–e215, 2010 [DOI] [PubMed] [Google Scholar]
- 16. Luria A, Bettaieb A, Xi Y, Shieh GJ, Liu HC, Inoue H, Tsai HJ, Imig JD, Haj FG, Hammock BD. Soluble epoxide hydrolase deficiency alters pancreatic islet size and improves glucose homeostasis in a model of insulin resistance. Proc Natl Acad Sci USA 108: 9038–9043, 2011 [DOI] [PMC free article] [PubMed] [Google Scholar]
- 17. Mikus CR, Rector RS, Arce-Esquivel AA, Libla JL, Booth FW, Ibdah JA, Laughlin MH, Thyfault JP. Daily physical activity enhances reactivity to insulin in skeletal muscle arterioles of hyperphagic Otsuka Long-Evans Tokushima Fatty rats. J Appl Physiol 109: 1203–1210, 2010 [DOI] [PMC free article] [PubMed] [Google Scholar]
- 18. Mustafa S, Sharma V, McNeill JH. Insulin resistance and endothelial dysfunction: Are epoxyeicosatrienoic acids the link? Exp Clin Cardiol 14: e41–e50, 2009 [PMC free article] [PubMed] [Google Scholar]
- 19. Rattigan S, Wallis MG, Youd JM, Clark MG. Exercise training improves insulin-mediated capillary recruitment in association with glucose uptake in rat hindlimb. Diabetes 50: 2659–2665, 2001 [DOI] [PubMed] [Google Scholar]
- 20. Rattigan S, Wheatley C, Richards SM, Barrett EJ, Clark MG. Exercise and insulin-mediated capillary recruitment in muscle. Exerc Sport Sci Rev 33: 43–48, 2005 [PubMed] [Google Scholar]
- 21. Scherrer U, Randin D, Vollenweider P, Vollenweider L, Nicod P. Nitric oxide release accounts for insulin's vascular effects in humans. J Clin Invest 94: 2511–2515, 1994 [DOI] [PMC free article] [PubMed] [Google Scholar]
- 22. Schinzari F, Tesauro M, Rovella V, Galli A, Mores N, Porzio O, Lauro D, Cardillo C. Generalized impairment of vasodilator reactivity during hyperinsulinemia in patients with obesity-related metabolic syndrome. Am J Physiol Endocrinol Metab 299: E947–E952, 2010 [DOI] [PubMed] [Google Scholar]
- 23. Shulman GI. Cellular mechanisms of insulin resistance. J Clin Invest 106: 171–176, 2000 [DOI] [PMC free article] [PubMed] [Google Scholar]
- 24. Steinberg HO, Baron AD. Vascular function, insulin resistance and fatty acids. Diabetologia 45: 623–634, 2002 [DOI] [PubMed] [Google Scholar]
- 25. Steinberg HO, Brechtel G, Johnson A, Fineberg N, Baron AD. Insulin-mediated skeletal muscle vasodilation is nitric oxide dependent. A novel action of insulin to increase nitric oxide release. J Clin Invest 94: 1172–1179, 1994 [DOI] [PMC free article] [PubMed] [Google Scholar]
- 26. Stuart CA, Shangraw RE, Prince MJ, Peters EJ, Wolfe RR. Bed-rest-induced insulin resistance occurs primarily in muscle. Metabolism 37: 802–806, 1988 [DOI] [PubMed] [Google Scholar]
- 27. US Department of Health and Human Services 2008 Physical Activity Guidelines for Americans: Be Active, Healthy, and Happy! Washington, DC: US Department of Health and Human Services, 2008, p. ix, 61 p [Google Scholar]
- 28. Vincent MA, Barrett EJ, Lindner JR, Clark MG, Rattigan S. Inhibiting NOS blocks microvascular recruitment and blunts muscle glucose uptake in response to insulin. Am J Physiol Endocrinol Metab 285: E123–E129, 2003 [DOI] [PubMed] [Google Scholar]
- 29. Vincent MA, Clerk LH, Lindner JR, Klibanov AL, Clark MG, Rattigan S, Barrett EJ. Microvascular recruitment is an early insulin effect that regulates skeletal muscle glucose uptake in vivo. Diabetes 53: 1418–1423, 2004 [DOI] [PubMed] [Google Scholar]
- 30. Vincent MA, Clerk LH, Lindner JR, Price WJ, Jahn LA, Leong-Poi H, Barrett EJ. Mixed meal and light exercise each recruit muscle capillaries in healthy humans. Am J Physiol Endocrinol Metab 290: E1191–E1197, 2006 [DOI] [PubMed] [Google Scholar]
- 31. Vollus GC, Bradley EA, Roberts MK, Newman JM, Richards SM, Rattigan S, Barrett EJ, Clark MG. Graded occlusion of perfused rat muscle vasculature decreases insulin action. Clin Sci (Lond) 112: 457–466, 2007 [DOI] [PubMed] [Google Scholar]
- 32. Wallis MG, Wheatley CM, Rattigan S, Barrett EJ, Clark AD, Clark MG. Insulin-mediated hemodynamic changes are impaired in muscle of Zucker obese rats. Diabetes 51: 3492–3498, 2002 [DOI] [PubMed] [Google Scholar]
- 33. Wei K, Jayaweera AR, Firoozan S, Linka A, Skyba DM, Kaul S. Quantification of myocardial blood flow with ultrasound-induced destruction of microbubbles administered as a constant venous infusion. Circulation 97: 473–483, 1998 [DOI] [PubMed] [Google Scholar]
- 34. Wheatley CM, Rattigan S, Richards SM, Barrett EJ, Clark MG. Skeletal muscle contraction stimulates capillary recruitment and glucose uptake in insulin-resistant obese Zucker rats. Am J Physiol Endocrinol Metab 287: E804–E809, 2004 [DOI] [PubMed] [Google Scholar]
- 35. Womack L, Peters D, Barrett EJ, Kaul S, Price W, Lindner JR. Abnormal skeletal muscle capillary recruitment during exercise in patients with type 2 diabetes mellitus and microvascular complications. J Am Coll Cardiol 53: 2175–2183, 2009 [DOI] [PMC free article] [PubMed] [Google Scholar]
- 36. Zhang X, Zhang R, Raab S, Zheng W, Wang J, Liu N, Zhu T, Xue L, Song Z, Mao J, Li K, Zhang H, Zhang Y, Han C, Ding Y, Wang H, Hou N, Liu Y, Shang S, Li C, Sebokova E, Cheng H, Huang PL. Rhesus macaques develop metabolic syndrome with reversible vascular dysfunction responsive to pioglitazone. Circulation 124: 77–86, 2011 [DOI] [PMC free article] [PubMed] [Google Scholar]


