Abstract
Chloroquine, a widely used anti-malaria drug, has gained popularity for the treatment of rheumatoid arthritis, systemic lupus erythematosus (SLE), and human immunodeficiency virus (HIV). Unfortunately, chloroquine may also negatively impact renal function for patients whose fluid and electrolyte homeostasis is already compromised by diseases. Chronic administration of chloroquine also results in polyuria, which may be explained by suppression of the antidiuretic response of vasopressin. Several of the transporters responsible for concentrating urine are vasopressin-sensitive including the urea transporters UT-A1 and UT-A3, the water channel aquaporin-2 (AQP2), and the Na+-K+-2Cl− cotransporter (NKCC2). To examine the effect of chloroquine on these transporters, Sprague-Dawley rats received daily subcutaneous injections of 80 mg·kg−1·day−1 of chloroquine for 4 days. Twenty-four hour urine output was twofold higher, and urine osmolality was decreased by twofold in chloroquine-treated rats compared with controls. Urine analysis of treated rats detected the presence chloroquine as well as decreased urine urea and cAMP levels compared with control rats. Western blot analysis showed a downregulation of AQP2 and NKCC2 transporters; however, UT-A1 and UT-A3 abundances were unaffected by chloroquine treatment. Immunohistochemistry showed a marked reduction of UT-A1 and AQP2 in the apical membrane in inner medullary collecting ducts of chloroquine-treated rats. In conclusion, chloroquine-induced polyuria likely occurs as a result of lowered cAMP production. These findings suggest that chronic chloroquine treatment would exacerbate the already compromised fluid homeostasis observed in diseases like chronic kidney disease.
Keywords: aquaporin, AVP, cAMP, chloroquine, urea transporter
chloroquine is most notably known for its antimalarial properties (10); however, this drug also has therapeutic immunosuppressive activities and is currently used to treat mild cases of systemic lupus erythematosus (SLE) and rheumatoid arthritis (15). The exact mechanisms by which this drug mediates immunosuppresion are unclear, but as a weak base, chloroquine can pass through the plasma membrane and concentrate in acidic cytoplasmic vesicles. This results in increased endosomal pH, which can then interfere with endocytosis and exocytosis (37) as well as other cell functions, such as antigen presentation (18), iron metabolism (20), and lymphocyte proliferation (23). Several studies (26, 31, 33) have shown that chloroquine also inhibits human immunodeficiency virus (HIV) replication and modifies gp120 glycosolation patterns, thus potentially eliciting the production of neutralizing antibodies in HIV-infected individuals. These recent findings, in addition to ongoing clinical trials, suggest that chloroquine may be an effective and inexpensive antiretroviral treatment for HIV (8, 34).
Unfortunately, increasing evidence suggests that chloroquine may also negatively impact renal function for patients whose fluid and electrolyte homeostasis is already compromised by diseases such as chronic kidney disease (CKD). For instance, SLE can lead to nephritis, which may ultimately result in CKD (28). As the life expectancy for those with HIV increases, there are increasing instances of complications due to underlying CKD (38). Administering chloroquine for diseases like SLE and HIV requires a prolonged duration of therapy at higher daily dosages than what was originally used for antimalarial therapy. Chloroquine is particularly harmful to the kidney because it accumulates in high concentrations relative to most organs and the half-life of this drug also increases as the dosage is increased (19).
Chloroquine treatment can result in pronounced diuresis (2). Despite reports of a significant decrease in urine osmolality in chloroquine-infused rats (3), studies have also shown that acute chloroquine administration increases plasma vasopressin levels without affecting urine concentration (24). Vasopressin is instrumental in regulating renal water reabsorption in the inner medullary collecting duct via activation of the vasopressin V2 receptors that in turn stimulate cAMP synthesis (9). Defective cAMP signaling in the inner medulla causes the dysfunctional urine concentrating capacity observed in congenital and acquired nephrogenic diabetes insipidus (5). In this study, we have examined how chloroquine treatment results in polyuria by disrupting the function of vasopressin-sensitive transporters involved in the urine concentration mechanism.
METHODS
Experimental animals and protocol.
All animal protocols were approved by the Emory University Institutional Animal Care and Use Committee. Male Sprague-Dawley rats (Charles River Laboratories, Wilmington, MA), weighing 100–150 g, were given free access to tap water and fed standard diet (containing 23% protein). Rats were treated with either a vehicle (saline injectionsc) or chloroquine injection (80 mg/day sc) daily for 4 days. Rats were housed individually in metabolic cages for 24 h on day 4. Urine volume, osmolality, and urea composition were measured over that 24-h interval.
Urine analysis.
Urine osmolality was measured on a Wescor 5520 Vapor Pressure Osmometer (Wescor, Logan, UT). Urine urea concentration was determined using infinity urea reagent from Thermo Scientific (Thermo Fisher Scientific, Chicago, IL). Chloroquine was detected in the urine using a modified Willard T. Haskins' test. Calcium was measured in urine by a colorimetric chemical reaction with arsenazo III. cAMP was measured in the urine and inner medullary tissue using a Cayman kit (Ann Arbor, MI) according to manufacturer's instructions. Glomerular filtration rate (GFR) was calculated from urinary and plasma creatinine that was acquired using a Beckman creatinine analyzer that monitored the colorimetric response of the picric acid reaction (Jaffe reaction).
Sample preparation and Western blot analysis.
Rats were decapitated and kidneys removed. Tissue was dissected into inner medulla tip, inner medulla base, and outer medulla and prepared as detailed previously (7). Protein expression of UT-A1, UT-A3, aquaporin-2 (AQP2), and NKCC2 was measured by Western blot analysis using transporter-specific antibodies prepared by our laboratory. Vasopressin 2 receptor expression was examined using an antibody purchased from Millipore. With the use of ImageJ, densitometry was determined. Densitometry values were calculated based on tubulin loading controls and normalized and are reflected as percentage of control.
Pathology.
Kidneys from rats that were injected intraperitoneally with either vehicle or vasopressin 45 min before death; they were perfusion fixed with 4% paraformaldehyde, embedded in paraffin, and sectioned into 4-μm slices. To perform immunofluorescence, tissue slices were stained for AQP2 or UT-A1 and detected with an Alexa 488 secondary antibody. Tissues were mounted with ProLong Gold containing DAPI (Invitrogen, Carlsbad, CA). Images were collected from the papilla with a ×40 objective. Microscopy was performed with a Nikon Microphot-FX fluorescence microscope equipped with a Spot II digital camera.
Statistical analysis.
Values are means ± SE from each experimental group where four animals were used in each experimental group for five distinct cohorts of experiments (n = 5). Densitometry values were calculated based on tubulin loading controls. The densitometries from each group of animals were averaged and normalized to the untreated control values, and the data were presented as means ± SE for the percent change from the control value. To test for statistical significance between the multiple groups, we used an ANOVA followed by Newman-Keuls test. The criterion for statistical significance was P < 0.05.
RESULTS
Rats treated with chloroquine develop polyuria.
Metabolic data were collected over a 24-h period during the fourth day of treatment with either a vehicle (saline injection sc) or chloroquine injection (80 mg/day sc). Chloroquine-treated rats produced twice the amount of dilute urine than untreated control animals. The GFR was lower in chloroquine-treated rats compared with vehicle-treated control animals. Urine urea was decreased in chloroquine rats and animals also presented with proteinuria. We adapted the Haskins' method, a colorimetric assay that qualitatively detects chloroquine amounts in bodily fluids, and detected an abundant amount of chloroquine filtered in the urine of treated animals. Urine calcium levels were unchanged by chloroquine treatment. Finally, chloroquine-treated animals had decreased cAMP in the urine supporting the idea that chloroquine is inhibiting cAMP synthesis (Table 1). To determine if chloroquine had a direct effect on lowering cAMP concentration in the inner medulla, the amount of the second messenger was measured in the rat papilla. Chloroquine-treated animals had significantly less inner medullary cAMP (29.2 ± 3.63 pmol/mg of protein) compared with the cAMP concentration in the inner medulla of vehicle-treated rats (46.9 ± 0.49 pmol/mg of protein).
Table 1.
Urine analysis of vehicle- and chloroquine-treated rats
| Vehicle-Treated Rats | Chloroquine-Treated Rats | |
|---|---|---|
| 24-h Urine volume, ml | 10.6 ± 2.7 | 21.3 ± 2.3* |
| Urine osmolality, mmol/kgH2O | 1,788 ± 222 | 894.0 ± 185.6* |
| Urine urea, mg/ml | 7.4 ± 1.2 | 3.8 ± 1.0* |
| Urine protein, mg/dl | ≤15 | ≥300 |
| Urine chloroquine | Clear | Dark yellow |
| Urine calcium, mg/ml | 2.14 ± 0.1 | 2.26 ± 0.1 |
| Urine cAMP, pmol/ml | 5,300 ± 710 | 158 ± 15.1* |
| GFR, ml/min | 2.8 ± 0.1 | 0.99 ± 0.1* |
Data are means ± SE. GFR, glomerular filtration rate. Urine was collected for 24 h from rats separately housed in metabolic cages. All measurements were performed within 48 h of urine collection.
P = 0.05; n = 3.
Protein expression of some components of the urine concentration mechanism is altered by chronic chloroquine treatment.
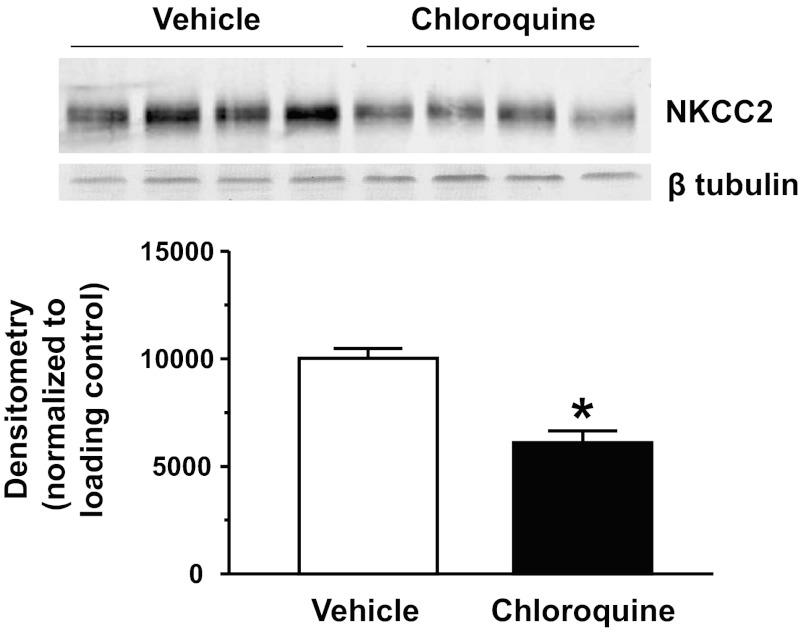
We first examined if NKCC2 protein abundance was affected by chloroquine treatment. Figure 1 shows that the 4-day chloroquine treatment significantly reduced NKCC2 protein abundance by 39% compared with the untreated animals.
Fig. 1.
Na+-K+-2Cl− cotransporter (NKCC2) is reduced in the outer medulla (OM) of chloroquine-treated animals. Western blot shows 1 representative experiment out of the 5 performed. Densitometry represents protein abundance normalized to the loading control for all experiments. Data are means ± SE. *P ≤ 0.05 and n = 5.
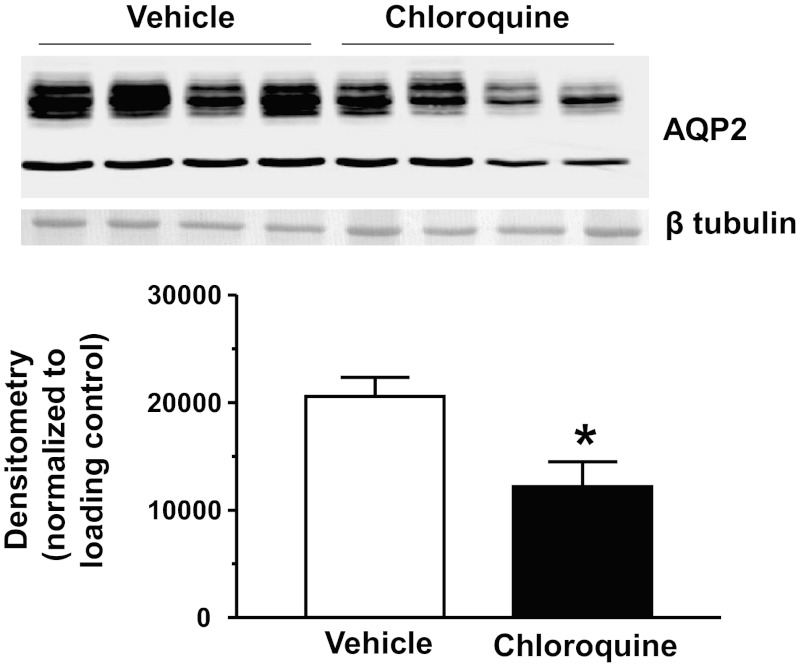
We next looked at the expression of AQP2 in the inner medulla tip after 4 days of chloroquine treatment. AQP2 expression was decreased in the inner medulla tip by 41% (Fig. 2). We also looked at the inner medulla base and found that chloroquine-treated animals had a 54% reduction of AQP2 (data not shown). We have observed a similar pattern of AQP2 protein reduction in other states of polyuria including lithium-induced diabetes insipidus (4).
Fig. 2.
Aquaporin 2 (AQP2) is reduced in the inner medulla (IM) tip of chloroquine-treated animals. Western blot shows 1 representative experiment out of the 5 performed. Densitometry represents protein abundance normalized to the loading control for all experiments. Data are means ± SE. *P ≤ 0.05 and n = 5.
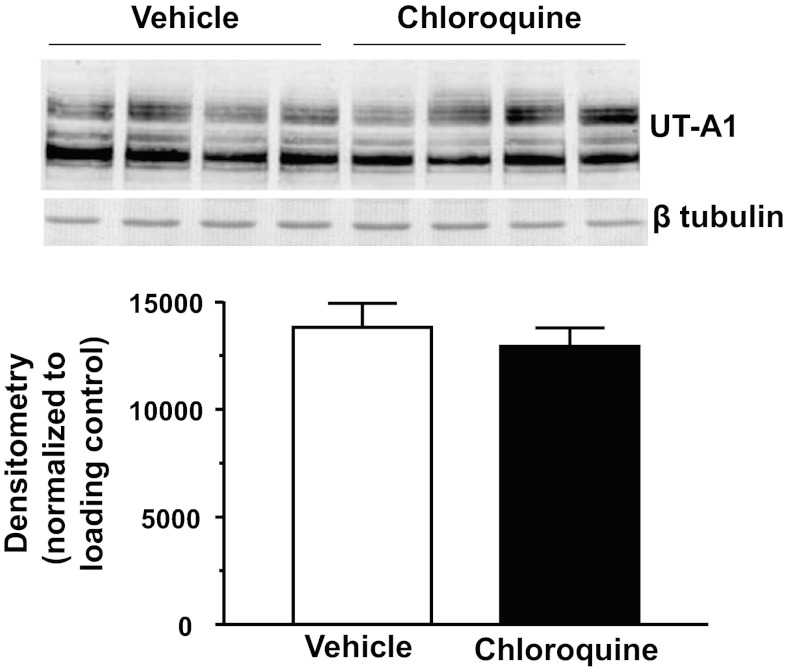
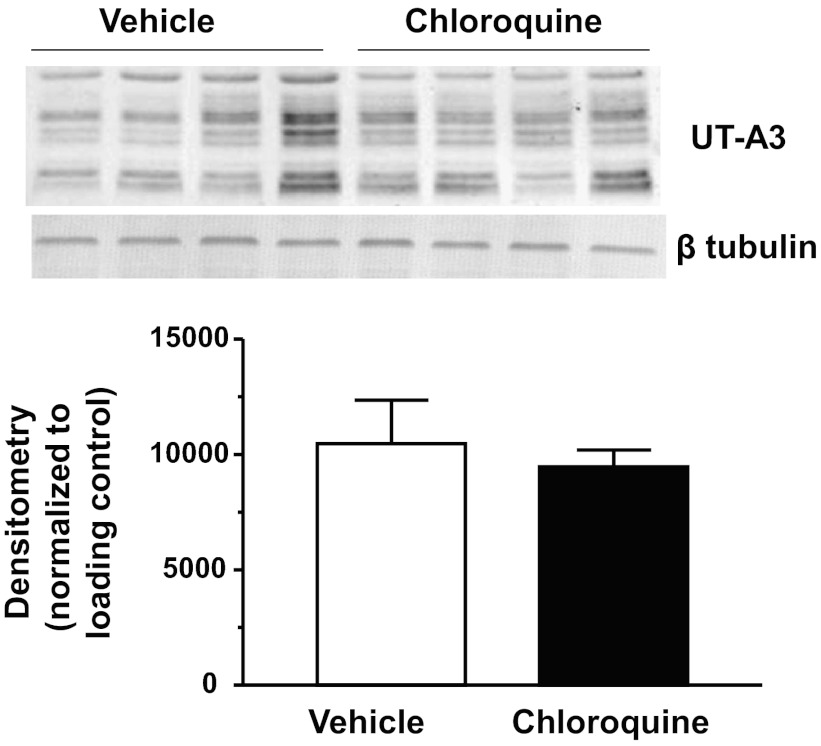
There are two urea transporters in the IM: UT-A1 and UT-A3. We first examined if chloroquine treatment affected UT-A1 protein abundance in the IM tip. Western blot analysis revealed that both glycosylated forms of UT-A1 (117 and 97 kDa) were unaltered in the chloroquine-treated group in IM tip tissues (Fig. 3). UT-A1 was not changed in IM base tissues (data not shown). UT-A3 is also a glycosylated protein that is expressed in the IM tip. We found that, like UT-A1, 4 days of chloroquine treatment did not change the expression of UT-A3 in IM tip (Fig. 4).
Fig. 3.
Urea transporter UT-A1 is unaltered in the IM tip of chloroquine-treated animals. Western blot shows 1 representative experiment out of the 5 performed. Densitometry represents protein abundance normalized to the loading control for all experiments. Data are means ± SE. *P ≤ 0.05 and n = 5.
Fig. 4.
UT-A3 is unaltered in the IM tip of chloroquine-treated animals. Western blot shows one representative experiment out of the five performed. Densitometry represents protein abundance normalized to the loading control for all experiments. Data are means ± SE. *P ≤ 0.05 and n = 5.
We also looked at vasopressin receptor 2 (V2R) expression in the inner medulla and found that chloroquine treatment of rats had no effect on the protein abundance of this receptor (data not shown).
Chloroquine treatment inhibits cAMP-mediated trafficking of AQP2 and UT-A1.
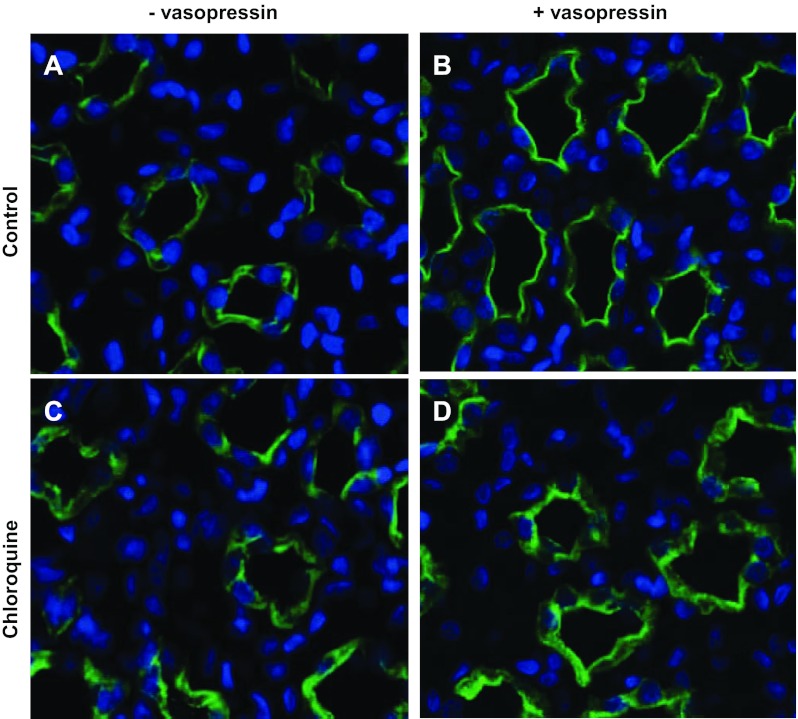
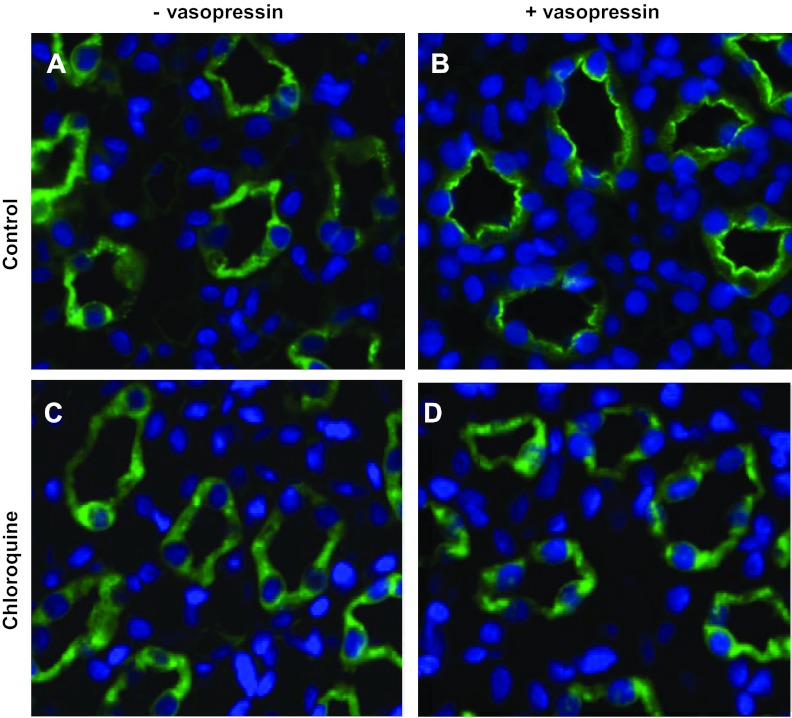
Chloroquine not only disrupts cAMP synthesis but also halts lysosomal trafficking. Both of these processes are known to affect transporter trafficking. Using immunofluorescence, we examined the cellular localization of AQP2 in vehicle- and chloroquine-treated rats in the absence and presence of acute vasopressin treatment. Figure 5B shows AQP2 localized predominantly at the apical membrane in response to vasopressin. In Fig. 5D, AQP2 does not respond to vasopressin in the chloroquine-treated animals. Similarly, UT-A1 moves to the apical membrane in response to vasopressin in control animals (Fig. 6B); however, UT-A1 remains in the cytosol of chloroquine-treated animal inner medullary collecting ducts (IMCDs).
Fig. 5.
Kidneys from rats that were injected subcutaneously with either vehicle or vasopressin 45 min before death were perfusion fixed with 4% paraformaldehyde and then embedded in paraffin sectioned into 4-μm slices. Tissue slices were stained for AQP2 (green). Slices also treated with the nuclear stain DAPI (blue). Images were collected from the papilla for the kidney with a ×40 objective. Light microscopy was performed with a Nikon Microphot-FX fluorescence microscope.
Fig. 6.
Kidneys from rats that were injected subcutaneously with either vehicle or vasopressin 45 min before death were perfusion fixed with 4% paraformaldehyde and then embedded in paraffin sectioned into 4-μm slices. Tissue slices were stained for UT-A1 (green). Slices also treated with the nuclear stain DAPI (blue). Images were collected from the papilla for the kidney with a ×40 objective. Light microscopy was performed with a Nikon Microphot-FX fluorescence microscope.
DISCUSSION
Chloroquine is widely used to treat several maladies. Although relatively well tolerated, chloroquine has a narrow therapeutic index that predisposes patients to nephrotoxicity (17). Anywhere from 40 to 70% of chloroquine is eliminated from the kidney (17). During chronic use, ensuing tissue accumulation of chloroquine in the kidney may cause adverse reactions including polyuria. In those with impaired renal function, the elimination half-life of chloroquine is increased (30). It is therefore recommended that doses should be lowered in patients with renal impairment (36). Thus it is no surprise that it is not recommended for patients with a GFR of 10–20 ml/min to take chloroquine >50 mg per day (36).
In our study, we observe that rats receiving 80 mg/day of chloroquine develop polyuria. While the amount of chloroquine used in our study is higher than what is prescribed for anti-malarial use, it is on target with treatment regimens for lupus and antiretroviral therapy (22). We also observed proteinuria in our treated rats. Urine calcium levels were not affected. Given that chloroquine has been shown to reduce calcitriol levels and thus alleviate hypercalemia (32), this result is not surprising; however, we can conclude that the observed polyuria is not a result of hypercalcemia. Metabolic data also revealed that urine cAMP was dramatically induced in chloroquine-treated animals. Previous reports have shown that chloroquine inhibits vasopressin-mediated cAMP synthesis (24) despite significantly increasing plasma vasopressin secretion (1). This may explain the previously reported lack of the normal antidiuretic responses of vasopressin in rats following chloroquine administration (24). Additionally, chloroquine has no effect on urine flow in vasopressin-deficient Brattleboro rats (25).
AQP2 and NKCC2 expression were both reduced as we had anticipated; however, neither of the urea transporters showed an alteration in protein abundance. One explanation may be the differences in the transcriptional regulation of AQP2 and NKCC2 and that of the urea transporters. Transcription of AQP2 is increased after cAMP stimulates the phosphorylation of cAMP response element binding (CREB; Ref. 21). NKCC2 has two overlapping CREB sites near the promoter region (14). UT-A1 and UT-A3 do not have a CREB site (29). Chronic chloroquine treatment reduces cAMP production, so it is possible that the transcriptional machinery that regulates production of AQP2 and NKCC2 is halted whereas chloroquine does not affect transcription of the urea transporters.
PKA phosphorylation of AQP2 is important for vasopressin-stimulated trafficking of AQP2 to the apical plasma membrane of the IMCD (12, 16, 27), leading to increased levels of water reabsorption. Reports that dominant nephrogenic diabetes insipidus is due to a R254L mutation that results in the loss of cAMP-mediated phosphorylation of AQP2 at S256 demonstrates the physiological importance of cAMP phosphorylation of this transporter (13). We (6) have recently determined that movement of UT-A1 to the membrane is also a result of PKA phosphorylation of the transporter. We have demonstrated that UT-A1 is phosphorylated by PKA at S486 and S499 (6). Like AQP2, PKA-phosphorylation at these sites is important for vasopressin-stimulated trafficking of UT-A1 to the apical plasma membrane (6) resulting in increased urea permeability across the IMCD. In this study, we observe that movement of both AQP2 and UT-A1 is impaired with chloroquine treatment. This inability to move to the apical membrane is likely due to the reduction in cAMP synthesis. Another explanation may be chloroquine-mediated disruption of the lysosomal pathway. AQP2 undergoes short-chain ubiquitination in the IMCD, ultimately leading to endocytosis of the transporter, where it is then targeted to multivesicular bodies. The water channel is subsequently degraded by the lysosome or is excreted in the urine via exosomes. Chen et al. (11) found that UT-A1 is polyubiquitinated by the MDM2 E3 ligase and is subsequently degraded by the proteasome. Stewart et al. (35) observed that inhibition of the ubiquitin-proteasome pathway increased UT-A1 at the membrane. We believe that the inhibition of AQP2 and UT-A1 trafficking is likely due to the lack of cAMP production rather than disruption of the lysosomal pathway since both the water channel and the urea transporter are affected.
In conclusion, chloroquine treatment induces polyuria and proteinuria. The inability to concentrate urine is likely due to the lack of cAMP to promote AQP2 and NKCC2 transcription and appropriate vasopressin-mediated trafficking responses in the IMCD.
GRANTS
Funding for this work was provided by National Institute of Diabetes and Digestive and Kidney Diseases Grants K01-DK-082733, K01-DK-082733-S1, and P30-DK-079312.
DISCLOSURES
No conflicts of interest, financial or otherwise, are declared by the author(s).
AUTHOR CONTRIBUTIONS
Author contributions: T.N.v.B. and M.A.B. performed experiments; T.N.v.B. and M.A.B. analyzed data; T.N.v.B. and M.A.B. prepared figures; T.N.v.B. and M.A.B. edited and revised manuscript; T.N.v.B. and M.A.B. approved final version of manuscript; M.A.B. conception and design of research; M.A.B. interpreted results of experiments; M.A.B. drafted manuscript.
ACKNOWLEDGMENTS
We thank Matt Hong and Sara Redd for technical support.
REFERENCES
- 1. Ahmed MH, Ashton N, Balment RJ. The effect of chloroquine on renal function and vasopressin secretion: a nitric oxide-dependent effect. J Pharmacol Exp Ther 304: 156– 161, 2003 [DOI] [PubMed] [Google Scholar]
- 2. Ahmed MH, Ashton N, Balment RJ. Renal function in a rat model of analgesic nephropathy: effect of chloroquine. J Pharmacol Exp Ther 305: 123– 130, 2003 [DOI] [PubMed] [Google Scholar]
- 3. Ahmed MH, Balment RJ, Ashton N. Renal action of acute chloroquine and paracetamol administration in the anesthetized, fluid-balanced rat. J Pharmacol Exp Ther 306: 478– 483, 2003 [DOI] [PubMed] [Google Scholar]
- 4. Bedford JJ, Leader JP, Jing R, Walker LJ, Klein JD, Sands JM, Walker RJ. Amiloride restores renal medullary osmolytes in lithium-induced nephrogenic diabetes insipidus. Am J Physiol Renal Physiol 294: F812– F820, 2008 [DOI] [PubMed] [Google Scholar]
- 5. Bichet DG. Lithium, cyclic AMP signaling, A-kinase anchoring proteins, and aquaporin-2. J Am Soc Nephrol 17: 920– 922, 2006 [DOI] [PubMed] [Google Scholar]
- 6. Blount MA, Mistry AC, Frohlich O, Price SR, Chen G, Sands JM, Klein JD. Phosphorylation of UT-A1 urea transporter at serines 486 and 499 is important for vasopressin-regulated activity and membrane accumulation. Am J Physiol Renal Physiol 295: F295– F299, 2008 [DOI] [PMC free article] [PubMed] [Google Scholar]
- 7. Blount MA, Sands JM, Kent KJ, Smith TD, Price SR, Klein JD. Candesartan augments compensatory changes in medullary transport proteins in the diabetic rat kidney. Am J Physiol Renal Physiol 294: F1448– F1452, 2008 [DOI] [PMC free article] [PubMed] [Google Scholar]
- 8. Boelaert JR, Piette J, Sperber K. The potential place of chloroquine in the treatment of HIV-1-infected patients. J Clin Virol 20: 137– 140, 2001 [DOI] [PubMed] [Google Scholar]
- 9. Boone M, Deen PM. Physiology and pathophysiology of the vasopressin-regulated renal water reabsorption. Pflügers Arch 456: 1005– 1024, 2008 [DOI] [PMC free article] [PubMed] [Google Scholar]
- 10. Bruce-Chwatt LJ. Malaria and its control: present situation and future prospects. Annu Rev Public Health 8: 75– 110, 1987 [DOI] [PubMed] [Google Scholar]
- 11. Chen G, Huang H, Frohlich O, Yang Y, Klein JD, Price SR, Sands JM. MDM2 E3 ubiquitin ligase mediates UT-A1 urea transporter ubiquitination and degradation. Am J Physiol Renal Physiol 295: F1528– F1534, 2008 [DOI] [PMC free article] [PubMed] [Google Scholar]
- 12. Christensen BM, Zelenina M, Aperia A, Nielsen S. Localization and regulation of PKA-phosphorylated AQP2 in response to V(2)-receptor agonist/antagonist treatment. Am J Physiol Renal Physiol 278: F29– F42, 2000 [DOI] [PubMed] [Google Scholar]
- 13. de Mattia F, Savelkoul PJ, Kamsteeg EJ, Konings IB, van der Sluijs P, Mallmann R, Oksche A, Deen PM. Lack of arginine vasopressin-induced phosphorylation of aquaporin-2 mutant AQP2–R254L explains dominant nephrogenic diabetes insipidus. J Am Soc Nephrol 16: 2872– 2880, 2005 [DOI] [PubMed] [Google Scholar]
- 14. Di Fulvio M, Alvarez-Leefmans F. The NKCC and NCC Genes: An In Silico View. London, UK: Academic, 2009 [Google Scholar]
- 15. Ducharme J, Farinotti R. Clinical pharmacokinetics and metabolism of chloroquine. Focus on recent advancements. Clin Pharmacokinet 31: 257– 274, 1996 [DOI] [PubMed] [Google Scholar]
- 16. Eto K, Noda Y, Horikawa S, Uchida S, Sasaki S. Phosphorylation of aquaporin-2 regulates its water permeability. J Biol Chem 285: 40777– 40784, 2010 [DOI] [PMC free article] [PubMed] [Google Scholar]
- 17. Ette EI, Brown-Awala EA, Essien EE. Chloroquine elimination in humans: effect of low-dose cimetidine. J Clin Pharmacol 27: 813– 816, 1987 [DOI] [PubMed] [Google Scholar]
- 18. Fox R. Anti-malarial drugs: possible mechanisms of action in autoimmune disease and prospects for drug development. Lupus 5, Suppl 1: S4– 10, 1996 [PubMed] [Google Scholar]
- 19. Frisk-Holmberg M, Bergqvist Y, Termond E, Domeij-Nyberg B. The single dose kinetics of chloroquine and its major metabolite desethylchloroquine in healthy subjects. Eur J Clin Pharmacol 26: 521– 530, 1984 [DOI] [PubMed] [Google Scholar]
- 20. Ghigo D, Aldieri E, Todde R, Costamagna C, Garbarino G, Pescarmona G, Bosia A. Chloroquine stimulates nitric oxide synthesis in murine, porcine, and human endothelial cells. J Clin Invest 102: 595– 605, 1998 [DOI] [PMC free article] [PubMed] [Google Scholar]
- 21. Hozawa S, Holtzman EJ, Ausiello DA. cAMP motifs regulating transcription in the aquaporin 2 gene. Am J Physiol Cell Physiol 270: C1695– C1702, 1996 [DOI] [PubMed] [Google Scholar]
- 22. Kuhn A, Lehmann P, Ruzicka T. Cutaneous Lupus Erythematosus. New York: Springer, 2005, p. xvii [Google Scholar]
- 23. Kyburz D, Brentano F, Gay S. Mode of action of hydroxychloroquine in RA-evidence of an inhibitory effect on toll-like receptor signaling. Nat Clin Pract Rheumatol 2: 458– 459, 2006 [DOI] [PubMed] [Google Scholar]
- 24.Musabayane CT, Wargent ET, Balment RJ. Chloroquine inhibits arginine vasopressin production in isolated rat inner medullary segments induced cAMP collecting duct. Ren Fail 22: 27–37, 2000 [DOI] [PubMed] [Google Scholar]
- 25. Musabayane CT, Windle RJ, Forsling ML, Balment RJ. Arginine vasopressin mediates the chloroquine induced increase in renal sodium excretion. Trop Med Int Health 1: 542– 550, 1996 [DOI] [PubMed] [Google Scholar]
- 26. Naarding MA, Baan E, Pollakis G, Paxton WA. Effect of chloroquine on reducing HIV-1 replication in vitro and the DC-SIGN mediated transfer of virus to CD4+ T-lymphocytes. Retrovirology 4: 6, 2007 [DOI] [PMC free article] [PubMed] [Google Scholar]
- 27. Nielsen S, Frokiaer J, Marples D, Kwon TH, Agre P, Knepper MA. Aquaporins in the kidney: from molecules to medicine. Physiol Rev 82: 205– 244, 2002 [DOI] [PubMed] [Google Scholar]
- 28. Ryan MJ. The pathophysiology of hypertension in systemic lupus erythematosus. Am J Physiol Regul Integr Comp Physiol 296: R1258– R1267, 2009 [DOI] [PMC free article] [PubMed] [Google Scholar]
- 29. Sands JM. Renal urea transporters. Curr Opin Nephrol Hypertens 13: 525– 532, 2004 [DOI] [PubMed] [Google Scholar]
- 30. Sato T, Masuda S, Yonezawa A, Tanihara Y, Katsura T, Inui K. Transcellular transport of organic cations in double-transfected MDCK cells expressing human organic cation transporters hOCT1/hMATE1 and hOCT2/hMATE1. Biochem Pharmacol 76: 894– 903, 2008 [DOI] [PubMed] [Google Scholar]
- 31. Savarino A, Gennero L, Sperber K, Boelaert JR. The anti-HIV-1 activity of chloroquine. J Clin Virol 20: 131– 135, 2001 [DOI] [PubMed] [Google Scholar]
- 32. Seymour JF, Gagel RF. Calcitriol: the major humoral mediator of hypercalcemia in Hodgkin's disease and non-Hodgkin's lymphomas. Blood 82: 1383– 1394, 1993 [PubMed] [Google Scholar]
- 33. Sperber K, Chiang G, Chen H, Ross W, Chusid E, Gonchar M, Chow R, Liriano O. Comparison of hydroxychloroquine with zidovudine in asymptomatic patients infected with human immunodeficiency virus type 1. Clin Ther 19: 913– 923, 1997 [DOI] [PubMed] [Google Scholar]
- 34. Sperber K, Kalb TH, Stecher VJ, Banerjee R, Mayer L. Inhibition of human immunodeficiency virus type 1 replication by hydroxychloroquine in T cells and monocytes. AIDS Res Hum Retroviruses 9: 91– 98, 1993 [DOI] [PubMed] [Google Scholar]
- 35. Stewart GS, O'Brien JH, Smith CP. Ubiquitination regulates the plasma membrane expression of renal UT-A urea transporters. Am J Physiol Cell Physiol 295: C121– C129, 2008 [DOI] [PubMed] [Google Scholar]
- 36. Thorogood N, Atwal S, Mills W, Jenner M, Lewis DA, Cavenagh JD, Agrawal SG. The risk of antimalarials in patients with renal failure. Postgrad Med J 83: e8, 2007 [DOI] [PMC free article] [PubMed] [Google Scholar]
- 37. Wellems Malaria TE. How chloroquine works. Nature 355: 108– 109, 1992 [DOI] [PubMed] [Google Scholar]
- 38. Wyatt CM, Winston JA, Malvestutto CD, Fishbein DA, Barash I, Cohen AJ, Klotman ME, Klotman PE. Chronic kidney disease in HIV infection: an urban epidemic. AIDS 21: 2101– 2103, 2007 [DOI] [PubMed] [Google Scholar]


