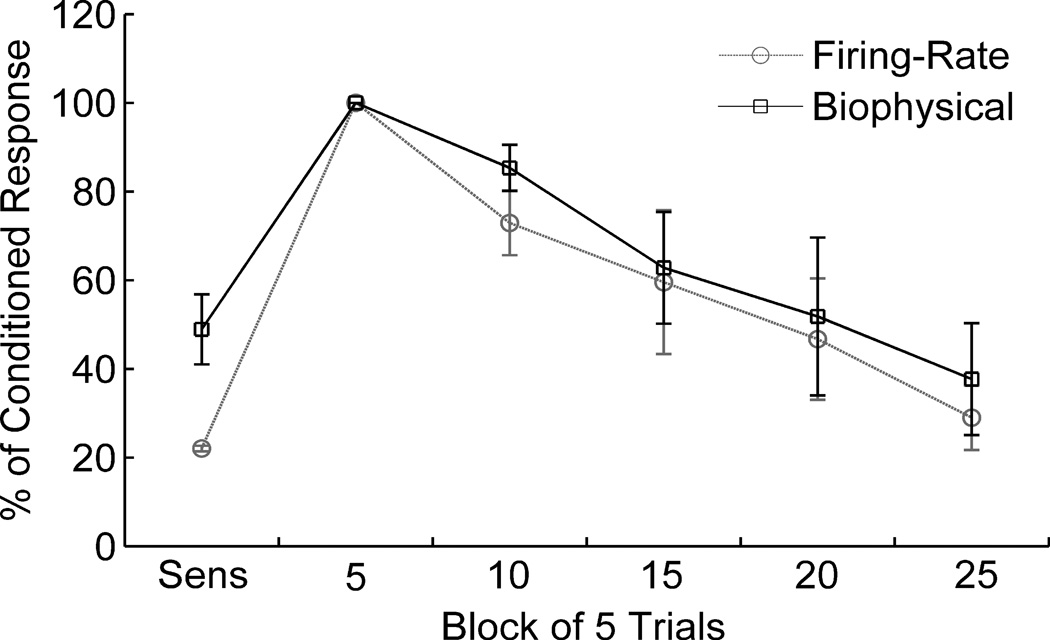
Figure 3.
Tone responses of conditioned pyramidal cells in the network model during the phases of fear conditioning. Responses are shown as % of conditioned responses. Sensitization response was measured for final five trials of the sensitization phase, and remaining responses were measured for successive blocks of five trials during extinction. Results reported as mean +/− SE for the four cells that displayed significantly conditioned tone responses. Variations are seen in biological experiments, and so the aim is to match the trends. Very good match was obtained with the results of the detailed biophysical LA model (Li et al., 2009) which itself was previously validated with biological data (Quirk et al., 1997).

