

Abstract
Objective:
To evaluate the relationship of striatal involvement in Huntington disease (HD) to involvement in other brain regions, CAG repeat size, onset age, and other factors.
Methods:
We examined patterns of neuropathologic involvement in 664 HD brains submitted to the Harvard Brain Tissue Resource Center. Brains with concomitant Alzheimer or Parkinson changes (n = 82), more than 20% missing data (n = 46), incomplete sample submission (n = 12), or CAG repeat less than 36 (n = 1) were excluded, leaving 523 cases. Standardized ratings from 0 (absent) to 4 (severe) of gross and microscopic involvement were performed for 50 regions. Cluster analysis reduced the data to 2 main measures of involvement: striatal and cortical.
Results:
The clusters were correlated with each other (r = 0.42) and with disease duration (striatal: r = 0.35; cortical: r = 0.31). The striatal cluster was correlated with HD repeat size (r = 0.50). The cortical cluster showed a stronger correlation with decreased brain weight (r = −0.52) than the striatal cluster (r = −0.33). The striatal cluster was correlated with younger death age (r = −0.31) and onset age (r = −0.46) while the cortical cluster was not (r = 0.09, r = −0.04, respectively).
Conclusions:
The 2 brain clusters had different relationships to the HD CAG repeat size, onset age, and brain weight, suggesting that neuropathologic involvement does not proceed in a strictly coupled fashion. The pattern and extent of involvement varies substantially from one brain to the next. These results suggest that regional involvement in HD brain is modified by factors which, if identified, may lend insight into novel routes to therapeutics.
Huntington disease (HD) is an autosomal dominantly transmitted neurodegenerative disorder characterized by involuntary movements, dementia, and changes in personality. Expansion of a CAG trinucleotide repeat on chromosome 4p16.3 within the coding region of the HD gene is the disease-causing mutation.1,2 Neuropathologically, the striatum is most severely affected,3 although involvement of HD cortical regions is appreciated in both imaging4–6 and autopsy studies.7–9 White matter involvement is well documented10,11 and an approximate 20% reduction in brain weight3,12,13 indicates that HD has global neuropathologic effects. However, it is not known if different brain regions experience atrophy in parallel, or if there are differences in the pattern and extent of regional involvement in HD.
In 1985, we sought to create a semiquantitative assessment of the pathologic involvement in HD brains.3 That study generated a 0 to 4 rating scale, based primarily upon the gross and microscopic involvement in the striatum. The scale provided an effective measure to consider the relationship of neuropathologic features of HD to clinical,14 neurochemical,15,16 and molecular17,18 changes.
However, cases falling between 2 grades and those where different brain areas showed varying levels of involvement were difficult to categorize. We seek here to refine the quantification of the neuropathologic involvement in HD and to evaluate the relationship of involvement to the size of the HD CAG repeat, age at onset, age at death, disease duration, and brain weight.
METHODS
Brain samples.
This study is based upon a series of 664 HD brains collected by the Harvard Brain Tissue Resource Center (HBTRC) between December 1984 and June 2000. Neuropathologic evaluation data were studied for all HD samples made available to the New England HD Research Center by the HBTRC. Samples were provided in 2 phases: phase 1, all available HD brains, graded 1 through 4 (n = 237), and phase 2, all available HD brains graded 2 through 4 (n = 427), as access to grade 1 HD brains was restricted. For each case, we recorded the Vonsattel grade of neuropathologic involvement, weight of the half-fixed brain, sex, age at onset, age at death, and expanded HD CAG repeat size (table 1).
Table 1.
Characteristics of HD brains
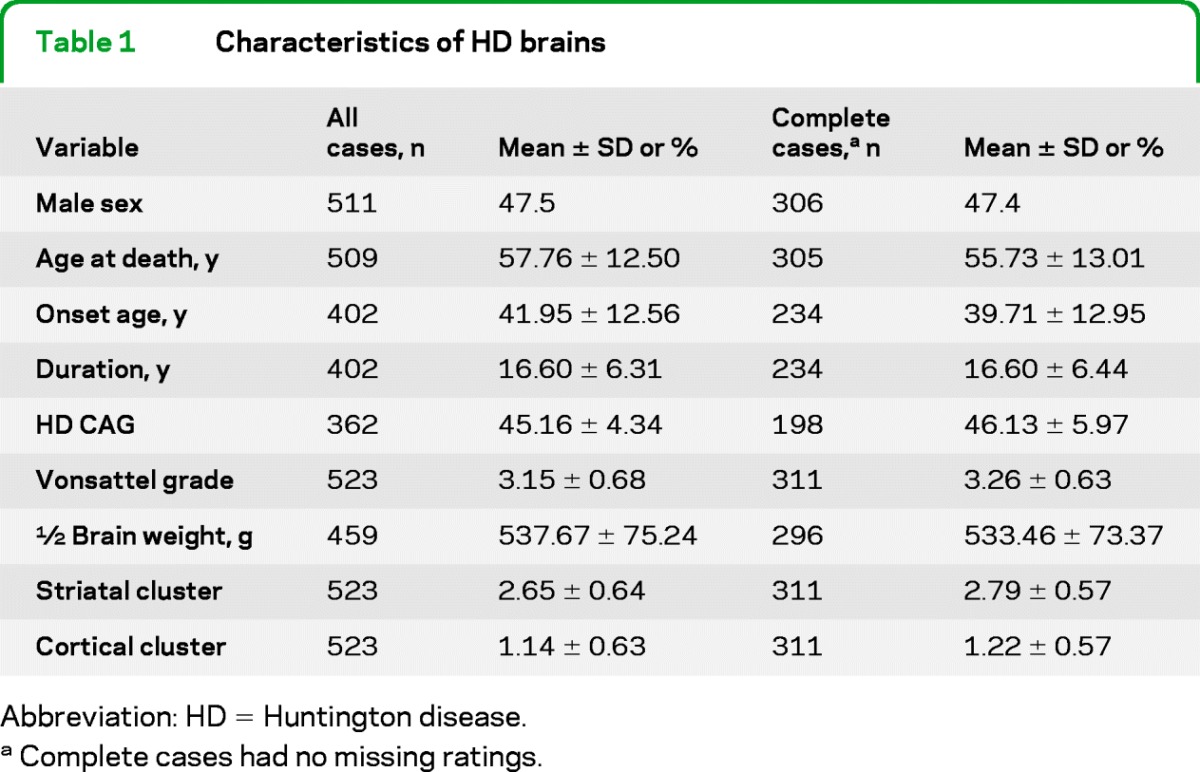
Abbreviation: HD = Huntington disease.
Complete cases had no missing ratings.
Exclusion criteria.
Brains with concomitant Alzheimer disease (AD) or Parkinson disease (PD) (n = 82, 12.6%) were excluded. Cases where more than 10 (20%) of the neuropathologic evaluation ratings were missing were removed (n = 46, 7.1%). Twelve additional cases were removed because less than the entire half fixed brain sample was provided. One case was removed because the HD CAG was normal. A total of 523 remained after 141 samples (21.2%) were excluded.
CAG repeat analysis.
Among the 523 studied, 362 had DNA which was genotyped for CAG repeat size. Sixty-five brains were submitted as a whole fixed specimen, precluding accurate sizing of the expanded HD CAG repeat, and the remainder had no remaining frozen tissue for genotyping. No cases were homozygous for the expanded HD allele.
Neuropathologic ratings.
A standardized neuropathologic evaluation devised by Dr. Vonsattel was used for all brain samples. Each brain sample was evaluated for 17 ratings of gross pathology and 33 ratings of microscopic pathology (table 2).
Table 2.
Neuropathologic rating and cluster standardized scoring coefficientsa
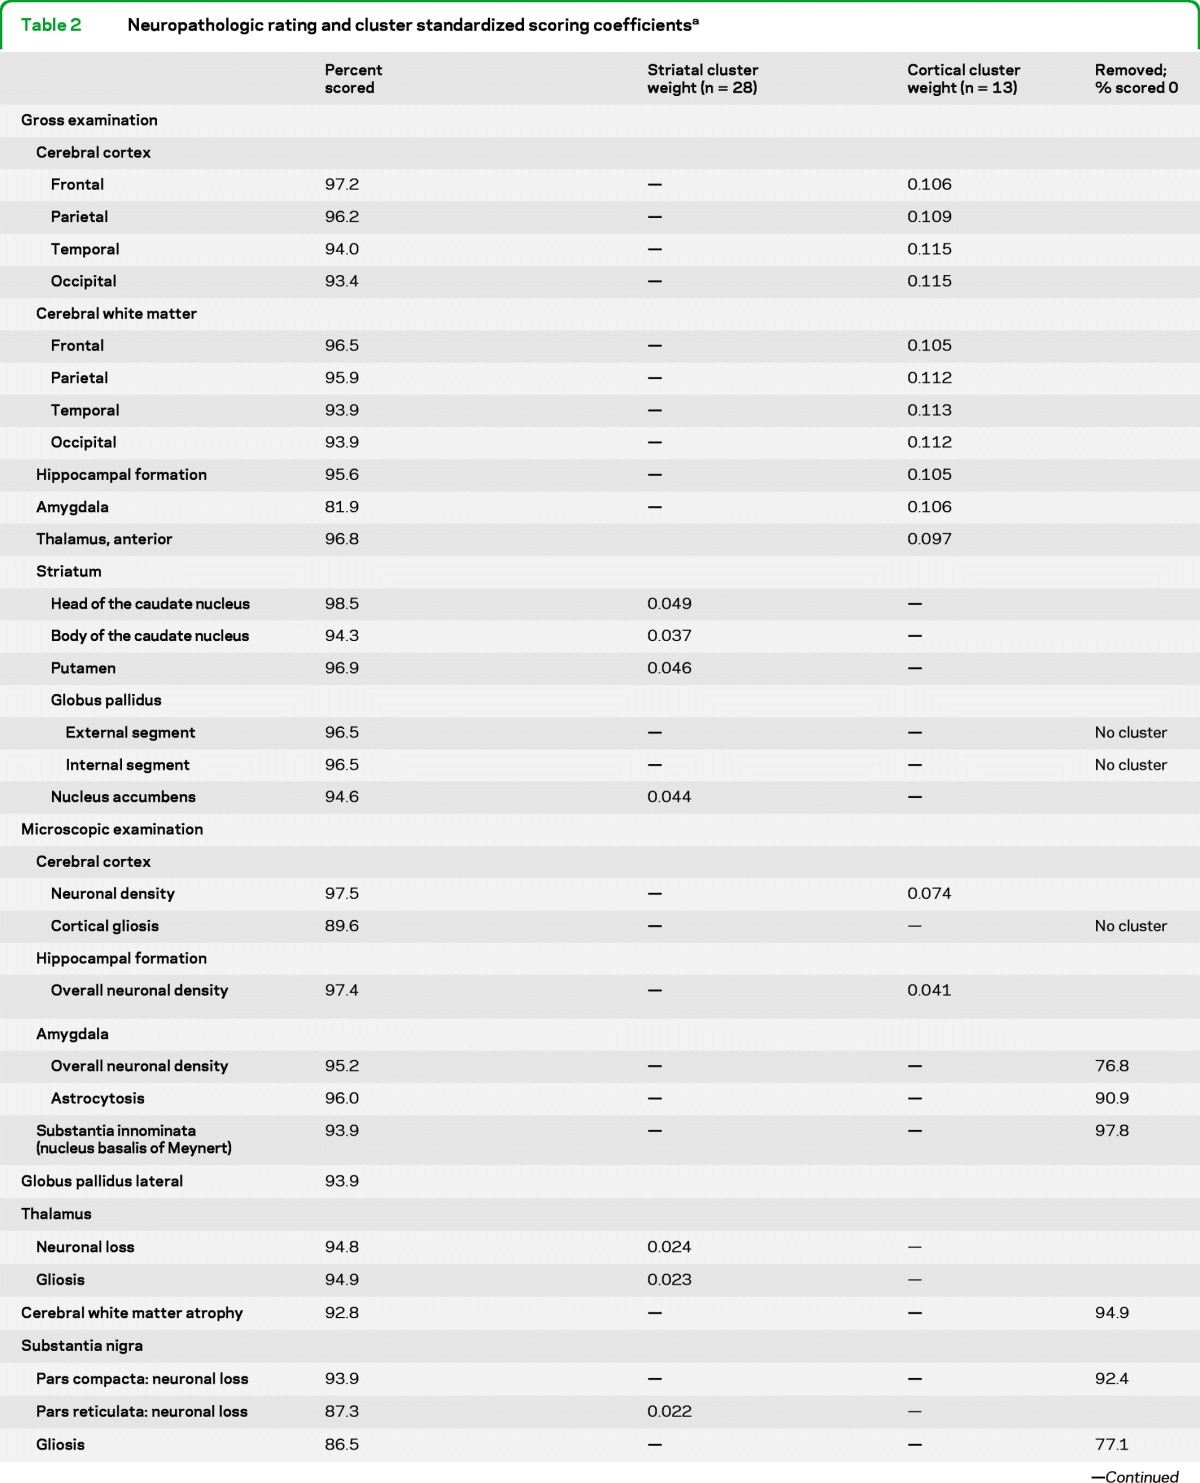
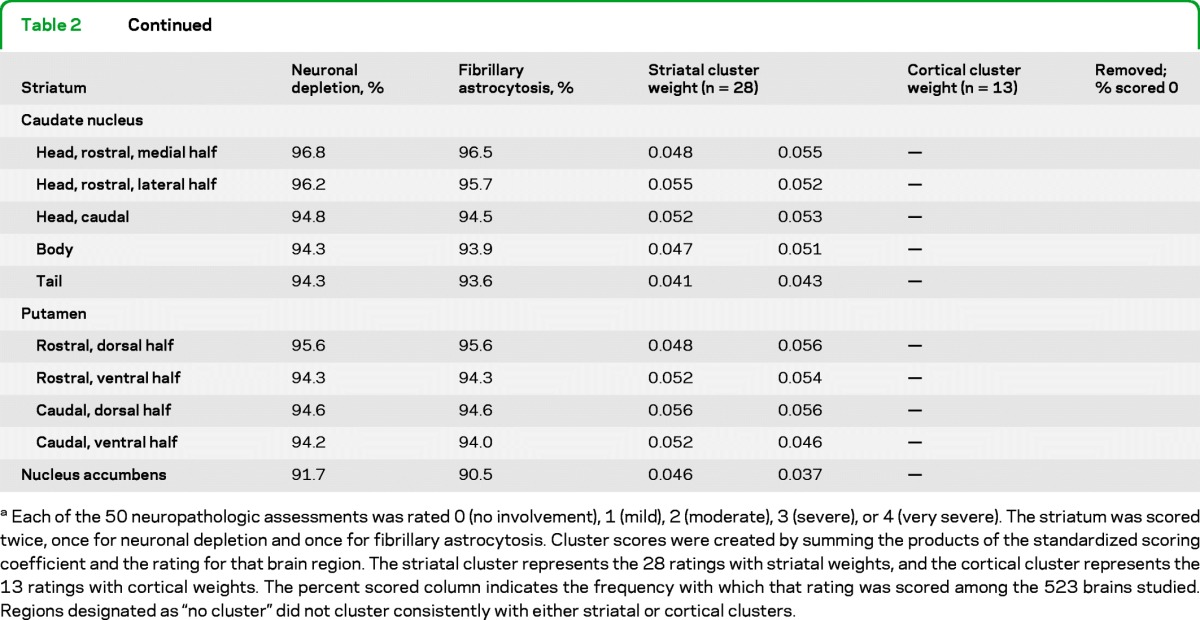
Each of the 50 neuropathologic assessments was rated 0 (no involvement), 1 (mild), 2 (moderate), 3 (severe), or 4 (very severe). The striatum was scored twice, once for neuronal depletion and once for fibrillary astrocytosis. Cluster scores were created by summing the products of the standardized scoring coefficient and the rating for that brain region. The striatal cluster represents the 28 ratings with striatal weights, and the cortical cluster represents the 13 ratings with cortical weights. The percent scored column indicates the frequency with which that rating was scored among the 523 brains studied. Regions designated as “no cluster” did not cluster consistently with either striatal or cortical clusters.
The fresh brain was divided in the midsagittal plane at the time of autopsy. One-half of the brain was frozen and the other immersion fixed in 10% buffered formalin and weighted after fixation. The fixed cerebral hemisphere was sectioned coronally and the brainstem and cerebellum were sectioned transversely at 0.5-cm intervals. For microscopic examination, 16 tissue blocks were taken systematically as described previously3 and in the e-Materials on the Neurology® Web site at www.neurology.org.
Neuropathologic ratings.
Among the 523 cases, 97.3% of the 50 neuropathologic ratings were scored; 311 cases (59.5%) had complete data and were used for the clustering of neuropathologic ratings analysis. The remaining 212 cases (40.5%) had at least 81% of the neuropathologic ratings scored (65 missing a single neuropathologic rating, 36 missing 2, 19 missing 3, 48 missing 4, 14 missing 5, 9 missing 6, 11 missing 7, 6 missing 8, and 4 missing 9). The neuropathologic ratings with the most missing values were “gross assessment of the amygdala” (81.9% scored), “gliosis in the pars reticulata of the substantia nigra” (86.5% scored), and “neuronal loss in the pars reticulata of the substantia nigra” (87.3% scored). All the other brain regions were scored at more than 90% (97.3% average).
Assessment of neuronal cell loss and gliosis.
The evaluation of relative neuronal loss and gliosis were performed by visual examination, based upon by cell counting in a subset of HD (n = 25) and control (n = 5) cases, and then by comparing each case with normal control material. Both the neuronal density and astrocytic gliosis were rated semiquantitatively at 312× magnification using LHE-stained sections for the number of cells per field. See e-Materials for a description of the assessment of neuronal cell loss and gliosis.
Analytic methods.
Cluster analysis.
Cluster analysis is implemented when data contain highly correlated measures, and is effective in combining several correlated variables to create a single measure. This approach reduces the number of variables studied while retaining information from multiple scores. Cluster analyses were performed using the 311 brain specimens without missing data for the 50 neuropathologic ratings using the VARCLUS procedure (SAS v9.1, SAS Institute Inc., Cary, NC) with default settings. VARCLUS uses principal components to guide clustering, which ensures that ratings are split so as to maximize the amount of variance explained by the clustering.
To ensure that there was no drift in the scoring of neuropathologic ratings over the 16-year interval of brain collection, we compared how the neuropathologic ratings were clustered for the first 155 brains (1984–1994) and for the second 156 brains (1994–2000). As the number of clusters increased beyond 2, there were modest shifts in clusters to which neuropathologic rating were assigned. The first 2 clusters were consistent for the first half and the second half of this series, and therefore we report this cluster definition.
Imputation of missing values.
For the 212 cases with at least 1 missing rating, we implemented a single imputation method to fill in the missing values as follows: within each cluster, and for each case with missing data, we calculated a cluster score by summing the nonmissing neuropathologic ratings. We then calculated a per individual cluster score for all other cases who had complete data for the same subset of neuropathologic ratings. Finally, to fill in the missing value, we randomly chose a value from cases with the same cluster score as the case with the missing values. Thus, using only the scored neuropathologic ratings within the cluster, we matched each subject with missing values to subjects with an identical cluster score and randomly selected a value to impute the missing neuropathologic rating. There were 2 cases for which there were no other cases with an identical score for 1 cluster. For these 2 cases, we randomly chose a value for each variable from among cases with a cluster score within 1 unit of the cluster score for the case with missing data.
Statistical analysis.
Bivariate correlations were computed using Spearman nonparametric correlation, and multivariate analyses were performed using general linear model regression (SAS v9.1, SAS Institute Inc.). Because the general linear model regression assumes normality, we evaluated the deviation from normality of each cluster and evaluated the relationship of a Blom transformed normalized score for each cluster.
Analysis removing extreme values.
For the primary analysis described above, all cases meeting inclusion criteria, including juvenile onset cases, were included. To reduce the possibility of bias attributable to extreme values for CAG repeat size, onset age, duration, or cluster, we repeated the bivariate and multivariate analyses in a subset of samples. In this more conservative analysis, we removed 77 cases as follows: 47 cases with disease duration of less than 10 years were removed. Eleven cases with disease duration greater than 30 years were removed. Sixteen cases with extreme CAG repeat sizes were removed (1 CAG <39; 15 CAG >50) and 3 cases with a striatal cluster score of less than 1.0 were removed as outliers with scores more than 2 standard deviations below the mean. A total of 446 cases were available for this analysis, 304 of which had known CAG repeat sizes.
Standard protocol approvals, registrations, and patient consents.
We received approval from the Boston University School of Medicine Institutional Review Board for the study of human autopsy brain material. All brain samples were collected with written informed consent from the next of kin of the donor at the time of death.
RESULTS
Cluster analysis.
Six assessments that were rated as 0 in at least 75% of the cases were removed from analysis. Three neuropathologic ratings, globus pallidus internal segment, globus pallidus external segment, and the microscopic assessment of cortical gliosis did not consistently cluster with the others and were removed. These may represent additional separate “clusters.”
The remaining 41 neuropathologic ratings were analyzed by cluster analysis. Two major clusters of variables were identified representing 1) a cluster that we have termed “striatal,” and 2) a cluster that we have termed “cortical,” based upon their primary components. A standardized scoring coefficient is generated for each neuropathologic rating variable. These coefficients are the weights for the first principal component of each cluster and provide a measure of how much each variable contributes to the variance of the cluster. A larger standardized scoring coefficient indicates a larger contribution to the first principal component, which itself explains the largest portion of variance of the cluster. Each cluster value was calculated by summing the score for each neuropathologic rating, weighted by the standardized cluster coefficient (presented in table 2). A total of 57.2% of the variation in the neuropathologic ratings is explained by their clustering into these 2 groups. The 28 regions with striatal cluster weightings (table 2) were summed to create the striatal cluster score, and the 13 regions with cortical cluster weightings were summed to create the cortical cluster.
Among the 523 brains, 7 were grade 1 (1.3%), 65 were grade 2 (12.4), 293 were grade 3 (56.0%), and 158 were grade 4 (30.2%). Grade 1 cases are under-represented in this series, and we estimate that approximately 12 grade 1 cases were not available to us.
Spearman correlation analysis.
Differences between the striatal cluster and cortical cluster variables are revealed by Spearman correlation analysis. The 2 clusters are modestly correlated with one another (r = 0.42, n = 523, p < 0.0001) and both clusters are similarly correlated with duration from onset to death (r = 0.35 for striatal cluster, r = 0.31 for cortical cluster, n = 509, p < 0.0001 for both). However, the striatal cluster is strongly correlated with the Vonsattel grade (r = 0.87, n = 523, p < 0.0001), as expected, while the cortical cluster is only modestly correlated (r = 0.39, n = 523, p < 0.0001). Conversely, the cortical cluster shows a strong correlation with brain weight (r = −0.52, n = 459, p < 0.0001), while the striatal cluster displays only a more modest correlation (r = −0.33, n = 459, p < 0.0001). Finally, the striatal cluster is correlated with a younger age at death (r = −0.31, n = 509, p < 0.0001), but the cortical cluster shows a slight correlation with older age at death (r = 0.09, n = 509, p = 0.049).
In these bivariate analyses, the striatal cluster is significantly correlated with increasing HD CAG repeat size (r = 0.50, n = 362, p < 0.0001) and correlated with a younger onset age (r = −0.46, n = 402, p < 0.0001), while the cortical cluster does not have a significant marginal correlation with HD CAG repeat (r = 0.09, n = 362, p = 0.076) or onset age (r = −0.04, n = 402, p = 0.44).
Multivariable analysis.
As expected, the HD CAG repeat size is strongly correlated with the age at onset and age at death (table e-1). Because duration is a direct function of onset age and death, it is impossible to evaluate the multivariate relationship of all 3 variables simultaneously. Therefore, we present the analyses to 1) HD CAG repeat and duration and 2) HD CAG duration and onset age. Results including death age instead of onset age (not shown) are similar. Multivariable analyses reveal that CAG repeat and duration are significant predictors of involvement in the striatal cluster, while CAG repeat, duration, and onset age are significant predictors of involvement in the cortical cluster (table 3).
Table 3.
General linear model regression analysis in 523 Huntington brains
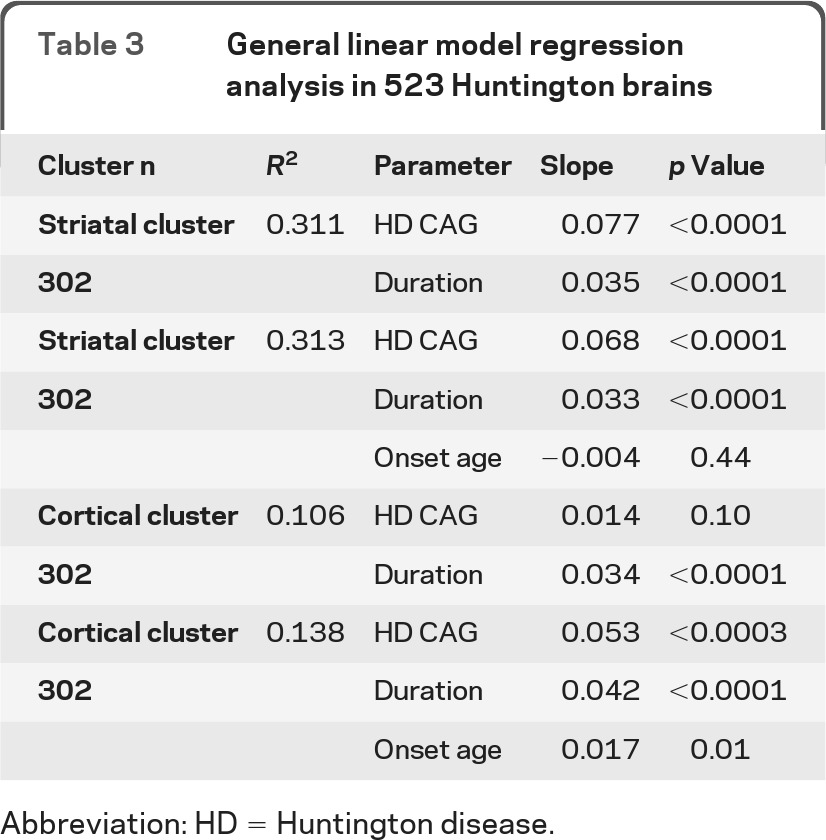
Abbreviation: HD = Huntington disease.
Analysis removing extreme values.
To evaluate whether our findings were influenced by a few cases with extreme values in CAG repeat size, onset age, duration, or cluster score, we repeated analyses removing 77 cases with extreme values with similar results (tables e-2 and e-3). We also performed general linear model regression analysis on Blom transformed normalized scores in the entire sample of 523 brains, and these findings were unchanged from those shown in table 3.
DISCUSSION
This study expands upon prior methods to evaluate the extent of neuropathologic involvement in HD brains,3,14 by clustering the evaluations of multiple regions to create scores representing the combined involvement of these ratings. A total of 523 HD brains without other concomitant neuropathologic diagnoses were evaluated by a single neuropathologist for the severity of involvement in 41 informative brain regions. Cluster analysis identified 2 main groupings: 1) a striatal cluster, representing 28 rated regions, and 2) a cortical cluster, representing 13 rated regions. Notably, the clusters show different interrelationships between HD CAG repeat size, age at onset, age at death, and the duration of the disease from onset to death, suggesting that the relative contributions of factors involved in the neurodegenerative processes may be different in these 2 clusters of brain regions. While the size of the expanded repeat is the primary driver in the striatum, there is evidence for more complex influences in the cortex.
Figure 1 presents a scatterplot of the 523 cases for these 2 clusters, which illustrates that cases with similar striatal involvement may have very different levels of cortical involvement, and vice versa. Similarly, figure 2 depicts 2 HD brains with similar Vonsattel grade 4 striatal involvement but dramatically different cortical involvement. The 2 clusters, which explain 57.2% of the variation in the neuropathologic ratings, represent continuous quantitative measures allowing for the assessment of the relationship of multiple factors with the neuropathologic involvement in HD.
Figure 1. The scatterplot for the striatal and cortical cluster scores with the trend line superimposed shows that these 2 scores are correlated.

Cases below the trend line have less cortical involvement than expected based upon their striatal involvement and cases above the trend line have more cortical involvement than expected based upon their striatal involvement. There are many cases with dramatic striatal involvement that have no or minimal cortical involvement. Across the spectrum of striatal involvement scores, there is a wide range of cortical involvement.
Figure 2. These 2 Huntington disease brains have similar low grade 4 striatal involvement but present dramatically different cortical involvement.

The medial outline of the head of the caudate nucleus (indicated by arrow A) and that of the internal capsule (indicated by arrow B) is medially concave for both brains although modestly less so in the left panel. These cases demonstrate the importance of evaluating multiple brain regions in defining the neuropathologic involvement in Huntington disease brains.
While the striatal cluster shows a strong bivariate correlation with the size of the expanded HD CAG repeat, the age at onset, and the age at death, multivariate analysis reveals that these correlations are completely dependent upon the effect of the expanded HD CAG repeat. Neither onset age nor age at death is predictive of the striatal cluster when the repeat size is in the model. Thus, for a given repeat size and duration, younger onset age individuals do not have greater striatal involvement than do those with older onset. This observation is consistent with the length of the HD CAG repeat expansion being the primary determinant of both striatal involvement and onset age. The corollary of this observation is that onset age does not influence the extent of striatal involvement independent of the relationship to repeat size. While there is substantial evidence for genetic modifiers of age at onset which are independent of the CAG repeat size,2,19 their relationship to the extent of striatal involvement will be an important area of investigation.
In bivariate analyses, the cortical cluster shows neither a correlation with the size of the expanded HD CAG repeat nor correlation to the age at onset. There is, however, a significant (p = 0.049) but modest correlation with older age at death. Notably, multivariate analysis reveals that the cortical cluster is related to the repeat size after adjustment for the disease duration, suggesting that cortical involvement is a part of the disease process that is neither determining nor determined by age at motor onset. The relationship of the cortical cluster to HD repeat size is strengthened when age at onset is also in the model, suggesting a more complex relationship among these variables in the context of cortical involvement that we discuss below.
Both the striatal cluster and the cortical cluster are associated with the HD CAG repeat size and duration, with more severe involvement associated with larger repeats and longer disease duration. Much more of the variation in the striatal cluster is explained by the HD CAG repeat, duration, and onset age (R2 = 0.313) than is explained for the cortical cluster (R2 = 0.138), suggesting that the contribution of the HD repeat size to cortical involvement may be less than for striatal involvement. The striatal cluster is strongly correlated with the Vonsattel grade,3 which is heavily weighted to the involvement in the caudate nucleus and the putamen. Conversely, the cortical cluster is more strongly correlated with the brain weight. While this cluster correlation to brain weight is not surprising given that the cortex makes up a large component of the brain, it further emphasizes the difference between these 2 cluster scores, and suggests that brain weight may be a surrogate for the cortical cluster when this type of extensive neuropathologic evaluation is not available.
While the striatal cluster is not associated with either onset age or death age after adjusting for the HD repeat size and duration, the cortical cluster is associated with either an older age at onset or age at death. Although one might expect more severe changes with younger onset, the relationship of age to cortical pathology might be due to superimposed aging effects. A number of brain imaging studies have shown that the regional atrophy in HD is correlated with clinical features, including cognitive performance and disease progression.4–6 Similarly, a significant association has been reported between motor dysfunction and postmortem cell loss in the primary motor cortex and an association of mood with cell loss in the anterior cingulate cortex.20
The relationship of regional atrophy to clinical expression emphasizes the importance for identifying genetic and nongenetic factors that influence the extent of neuropathologic involvement. These neuropathologic rating cluster scores offer an opportunity to evaluate the relationship of the extent of involvement to a variety of unbiased genome-wide measures, microarray or RNA sequencing, and chromatin immunoprecipitation sequencing for epigenetic effects which have potential to implicate specific pathways in the pathogenesis of HD.
Supplementary Material
ACKNOWLEDGMENT
The authors thank their long-time colleague Edward D. Bird, MD, who administered the McLean HBTRC from 1978 to 1998, and George Tejeda, MS, of the HBTRC, for his assistance in providing the neuropathologic data.
Glossary
GLOSSARY
- AD
Alzheimer disease
- HBTRC
Harvard Brain Tissue Resource Center
- HD
Huntington disease
- PD
Parkinson disease
Footnotes
Supplemental data at www.neurology.org
AUTHOR CONTRIBUTIONS
Ms. Hadzi participated in the conceptualization and design of the study, the interpretation of the data, and the drafting and revision of the manuscript. Dr. Hendricks participated in the conceptualization and design of the study, the interpretation of the data, and the drafting and revision of the manuscript. Dr. Latourelle participated in the conceptualization and design of the study, the interpretation of the data, and the drafting and revision of the manuscript. Dr. Lunetta participated in the interpretation of the data and the drafting and revision of the manuscript. Dr. Cupples participated in the interpretation of the data and revision of the manuscript. Ms. Gillis participated in the conceptualization of the study and the interpretation of the data. Ms. Mysore participated in the conceptualization of the study and the interpretation of the data. Dr. Gusella participated in the conceptualization and design of the study, the interpretation of the data, and the drafting and revision of the manuscript. Dr. MacDonald participated in the conceptualization and design of the study, the interpretation of the data, and the drafting and revision of the manuscript. Dr. Myers participated in the conceptualization and design of the study, the interpretation of the data, and the drafting and revision of the manuscript. Dr. Vonsattel participated in the conceptualization and design of the study, the interpretation of the data, and the drafting and revision of the manuscript.
DISCLOSURE
T. Hadzi is supported by the NIH, The Jerry McDonald Huntington's Disease Research Fund, and a Howard Hughes Collaborative Innovative Award. A. Hendricks was supported by the NIH. J. Latourelle is supported by the NIH, the RJG Foundation, and a Howard Hughes Collaborative Innovative Award. K. Lunetta is supported by the NIH. L.A. Cupples is supported by the NIH and the Susan G. Komen for the Cure. T. Gillis is supported by the NIH. J. Mysore is supported by the NIH. J. Gusella is supported by the NIH, the CHDI Foundation Inc., and the Huntington's Disease Society of America's Coalition for the Cure. M. MacDonald is supported by the NIH and the CHDI Foundation, Inc. R. Myers is supported by the NIH, The Jerry McDonald Huntington's Disease Research Fund, and a Howard Hughes Collaborative Innovative Award. J. Vonsattel is supported by the NIH, the Hereditary Disease Foundation, and the Parkinson's disease Foundation. Go to Neurology.org for full disclosures.
REFERENCES
- 1. Group THsDCR A novel gene containing a trinucleotide repeat that is expanded and unstable on Huntington's disease chromosomes: The Huntington's Disease Collaborative Research Group. Cell 1993; 72: 971– 983 [DOI] [PubMed] [Google Scholar]
- 2. Wexler NS, Lorimer J, Porter J, et al. Venezuelan kindreds reveal that genetic and environmental factors modulate Huntington's disease age of onset. Proc Natl Acad Sci USA 2004; 101: 3498– 3503 [DOI] [PMC free article] [PubMed] [Google Scholar]
- 3. Vonsattel JP, Myers RH, Stevens TJ, Ferrante RJ, Bird ED, Richardson EP., Jr Neuropathological classification of Huntington's disease. J Neuropathol Exp Neurol 1985; 44: 559– 577 [DOI] [PubMed] [Google Scholar]
- 4. Kassubek J, Juengling FD, Kioschies T, et al. Topography of cerebral atrophy in early Huntington's disease: a voxel based morphometric MRI study. J Neurol Neurosurg Psychiatry 2004; 75: 213– 220 [PMC free article] [PubMed] [Google Scholar]
- 5. Rosas HD, Salat DH, Lee SY, et al. Cerebral cortex and the clinical expression of Huntington's disease: complexity and heterogeneity. Brain 2008; 131: 1057– 1068 [DOI] [PMC free article] [PubMed] [Google Scholar]
- 6. Aylward EH, Nopoulos PC, Ross CA, et al. Longitudinal change in regional brain volumes in prodromal Huntington disease. J Neurol Neurosurg Psychiatry 2011; 82: 405– 410 [DOI] [PMC free article] [PubMed] [Google Scholar]
- 7. Cudkowicz M, Kowall NW. Degeneration of pyramidal projection neurons in Huntington's disease cortex. Ann Neurol 1990; 27: 200– 204 [DOI] [PubMed] [Google Scholar]
- 8. Sotrel A, Williams RS, Kaufmann WE, Myers RH. Evidence for neuronal degeneration and dendritic plasticity in cortical pyramidal neurons of Huntington's disease: a quantitative Golgi study. Neurology 1993; 43: 2088– 2096 [DOI] [PubMed] [Google Scholar]
- 9. Sotrel A, Paskevich PA, Kiely DK, Bird ED, Williams RS, Myers RH. Morphometric analysis of the prefrontal cortex in Huntington's disease. Neurology 1991; 41: 1117– 1123 [DOI] [PubMed] [Google Scholar]
- 10. de la Monte SM, Vonsattel JP, Richardson EP., Jr Morphometric demonstration of atrophic changes in the cerebral cortex, white matter, and neostriatum in Huntington's disease. J Neuropathol Exp Neurol 1988; 47: 516– 525 [DOI] [PubMed] [Google Scholar]
- 11. Rosas HD, Tuch DS, Hevelone ND, et al. Diffusion tensor imaging in presymptomatic and early Huntington's disease: Selective white matter pathology and its relationship to clinical measures. Mov Disord 2006; 21: 1317– 1325 [DOI] [PubMed] [Google Scholar]
- 12. Bird ED. The brain in Huntington's chorea. Psychol Med 1978; 8: 357– 360 [DOI] [PubMed] [Google Scholar]
- 13. Mann DM, Oliver R, Snowden JS. The topographic distribution of brain atrophy in Huntington's disease and progressive supranuclear palsy. Acta Neuropathol 1993; 85: 553– 559 [DOI] [PubMed] [Google Scholar]
- 14. Myers RH, Vonsattel JP, Stevens TJ, et al. Clinical and neuropathologic assessment of severity in Huntington's disease. Neurology 1988; 38: 341– 347 [DOI] [PubMed] [Google Scholar]
- 15. Guidetti P, Luthi-Carter RE, Augood SJ, Schwarcz R. Neostriatal and cortical quinolinate levels are increased in early grade Huntington's disease. Neurobiol Dis 2004; 17: 455– 461 [DOI] [PubMed] [Google Scholar]
- 16. Richards G, Messer J, Waldvogel HJ, et al. Up-regulation of the isoenzymes MAO-A and MAO-B in the human basal ganglia and pons in Huntington's disease revealed by quantitative enzyme radioautography. Brain Res 2011; 1370: 204– 214 [DOI] [PubMed] [Google Scholar]
- 17. Hodges A, Strand AD, Aragaki AK, et al. Regional and cellular gene expression changes in human Huntington's disease brain. Hum Mol Genet 2006; 15: 965– 977 [DOI] [PubMed] [Google Scholar]
- 18. Ryu H, Lee J, Hagerty SW, et al. ESET/SETDB1 gene expression and histone H3 (K9) trimethylation in Huntington's disease. Proc Natl Acad Sci USA 2006; 103: 19176– 19181 [DOI] [PMC free article] [PubMed] [Google Scholar]
- 19. Li JL, Hayden MR, Almqvist EW, et al. A genome scan for modifiers of age at onset in Huntington disease: The HD MAPS study. Am J Hum Genet 2003; 73: 682– 687 [DOI] [PMC free article] [PubMed] [Google Scholar]
- 20. Thu DC, Oorschot DE, Tippett LJ, et al. Cell loss in the motor and cingulate cortex correlates with symptomatology in Huntington's disease. Brain 2011; 133: 1094– 1110 [DOI] [PubMed] [Google Scholar]
Associated Data
This section collects any data citations, data availability statements, or supplementary materials included in this article.