Abstract
We demonstrate that rapamycin can induce regression of adenomatous polyposis coli (Apc) mutation-dependent colonic adenomas in genetically engineered mice (CPC;Apc). An endoscope was used to visualize adenomas in CPC;Apc mice weekly for 10 weeks. The lesion surface areas were measured using a distance gauge and digitally generated grid. Coronal scans were performed on magnetic resonance imaging (MRI) to localize adenomas, and tumor volumes were measured from regions of interest drawn on consecutive axial scans. Rapamycin (5 mg/kg) was administered intraperitoneally daily for 5 weeks. Endoscopy and MRI were performed weekly to monitor adenoma regression. Caliper measurements and immunohistochemistry (IHC) were performed on adenomas postmortem. Dimensions from n = 30 adenomas in n = 7 animals were measured. Adenoma surface areas on endoscopy correlated with volumes on MRI and with postmortem caliper measurements, R2 = 0.84 and R2 = 0.81, respectively. The mean adenoma doubling times on endoscopy and MRI were 0.95 ± 0.14 and 1.21 ± 0.16 weeks, respectively. The minimum detectable adenoma surface area and volume on endoscopy and MRI was 0.69 mm2 and 1.76 mm3, respectively. On histology, the rapamycin-treated adenomas showed limited regions of dysplasia. Rapamycin therapy resulted in much lower mammalian target of rapamycin signaling and cell proliferation. Lower expression of phospho-S6 and reduced numbers of Ki67-positive cells were seen on IHC compared to vehicle-treated lesions. Endoscopy can be validated by MRI as a robust methodology for quantitative monitoring of therapy, representing a promising approach for future preclinical efforts to assess utility of novel colorectal cancer prevention strategies.
Introduction
Quantitative multimodal imaging uses the physical characteristics of one imaging system to validate the performance of another [1]. Minimally invasive optical methods, such as endoscopy, are being combined with established whole-body techniques, such as MRI [2], as multimodal strategies to evaluate novel cancer therapeutics [3]. Colorectal cancer is a major cause of cancer-related death [4], and the removal of adenomas on screening with white light endoscopy can significantly reduce mortality [5]. Mutations in the adenomatous polyposis coli (Apc) gene are widely believed to play a critical role in the initiation of adenoma formation in humans [6]. The ApcMin mouse model develops adenomas primarily in the small intestine [7] but often dies from intussusception or anemia by 120 days of age. Previous preclinical studies have shown the use of MRI colonography to identify and track adenoma growth using chemical induction of colonic adenomas [8,9] or a unique strain of ApcMin mouse [2,10]. Another study required labor-intensive surgery to generate colonic adenomas for monitoring tumor regression with serial colonoscopy [11]. These studies do not report generalized approaches and methods for quantitative temporal analyses of adenoma regression in response to therapy.
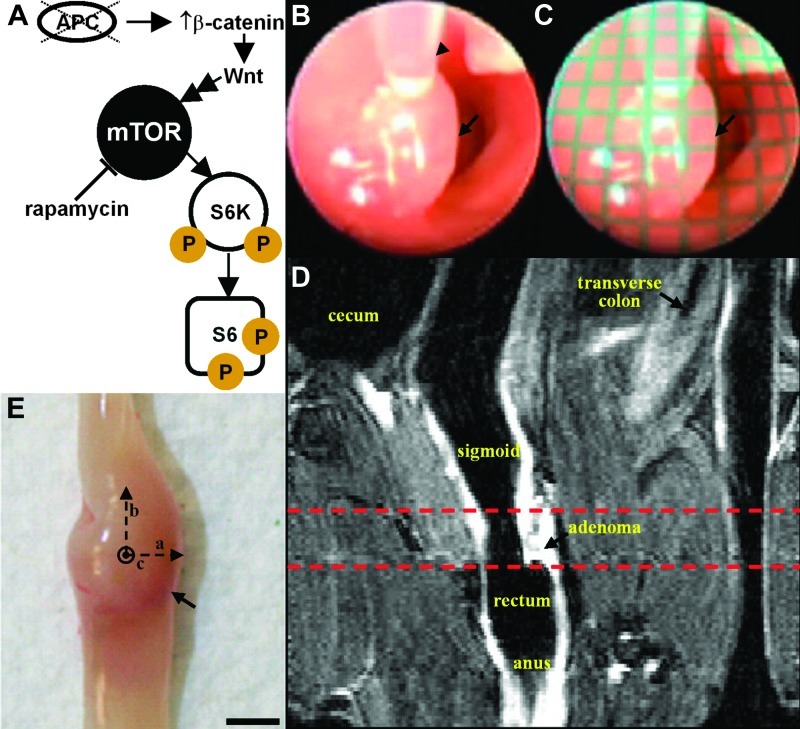
Several mouse models with germline or somatic mutations in the Apc gene, e.g., germline ApcMin and conditional CDX2P-NLSCre Apcflox/+ (CPC;Apc), allow for in-depth studies of colonic tumor development [12,13]. The molecular pathway for adenoma development in the CPC;Apc mouse is initiated by somatic inactivation of a second Apc allele, resulting in increased levels of β-catenin and activation of the canonical Wnt signaling pathway (Figure 1A). CPC;Apc mice develop between 4 and 10 adenomas in the distal colon and rectum [14], a location compatible with endoscopy [15]. Because the CPC;Apc and other mouse models can manifest a multiplicity of adenomas in relatively small portions of the colon [14], the previously reported technique of lumen distension as a surrogate measure of tumor size may not be accurate [11]. The mammalian target of rapamycin (mTOR) is a serine/threonine kinase that regulates cell growth and is activated in colorectal cancer, producing increased downstream expression of phospho-S6K and phospho-S6 (Figure 1A) [16–18]. Two signaling complexes containing mTOR (mTORC1 and mTORC2) individually act to regulate cell growth, in part as evidenced through the phosphorylation of S6 kinase or being involved in Akt phosphorylation and regulation of the actin cytoskeleton, respectively [19,20].
Figure 1.
Multimodal imaging strategy. (A) Schematic shows the relationship between molecular markers expressed in activated mTOR signaling pathway. (B) Distance from endoscope to adenoma (arrow) is measured in vivo with gauge (arrowhead) passed through the instrument channel. (C) Grid (1 x 1 mm2 squares) is digitally overlaid onto the endoscopic image for measuring long and short axes of adenoma (arrow). (D) T1-weighted coronal MRI scan (low resolution) identifies anatomic landmarks to localize adenoma, defining a window (dashed lines) for axial scans (high resolution). (E) Adenoma (arrow) dimensions (a, b, and c) are validated ex vivo with calipers.
Previous studies have reported that the mTOR inhibitors, including rapamycin and everolimus, can antagonize the growth of small intestinal adenomas [21,22]. However, either no effects of rapamycin [21] or no clear results [22] were found for colonic adenomas. Moreover, a previous study evaluated endoscopically the response of colonic adenomas to 5-fluorouracil therapy and found regression in a fraction of tumors [23]. Here, we aim to characterize the temporal growth of individual adenomas over time in CPC;Apc mice using multimodal imaging with endoscopy and MRI. We also aim to demonstrate that rapamycin can induce regression of established colonic adenomas as a chemoprevention strategy and use tumor dimensions measured on MRI to validate performance on endoscopy over the duration of therapy. The effectiveness of rapamycin therapy is assessed on histology for regions of dysplastic epithelial glands and on immunohistochemistry (IHC) for evidence of reduced mTOR pathway signaling and cell proliferation. The ability to assess adenoma growth and drug-induced regression quantitatively and temporally in a genetic mouse model of colon tumorigenesis has major implications for future preclinical efforts to assess utility of novel colorectal cancer prevention and treatment approaches.
Materials and Methods
Mouse Model of Colorectal Cancer
Mice were provided internally (E.R.F.) and cared for under the approval of the institutional University Committee on the Use and Care of Animals. The CPC;Apc mice carry a Cre recombinase transgene regulated by human CDX2 promoter elements (CDX2P-9.5NLS-Cre) and a floxed allele of the Apc gene and were developed on a C57BL6/J genetic background [14]. CDX2-regulated, Cre-mediated targeting of the Apc allele leads to the production of a truncated Apc protein [24] and the development of adenomas and early carcinomas in the distal colon and rectum over a 10- to 40-week period [14]. All mice were housed in specific pathogen-free conditions and supplied water ad libitum throughout the study. Mice were 3 months old at the beginning of the study.
Endoscopy Procedure
The colon was prepped by delivering tap water rectally using a transfer pipette. A small animal endoscope (Karl Storz Veterinary Endoscopy, Goleta, CA) with 0° viewing angle and a 3 Fr instrument channel was used to identify and measure all visible adenomas [25]. Mice were anesthetized, and sedation was maintained with 1.5% isoflurane using a nose cone during endoscopy. When an adenoma (arrow)was identified in vivo (Figure 1B), a gauge (arrowhead), calibrated in 1-mm increments, was passed through the instrument channel to measure the distance to the lesion surface. An image of a grid with 1 x 1 mm2 squares was collected with the endoscope at various distances away. Given this distance, the appropriate grid was then digitally overlaid onto the image to measure the long and short axes of the adenoma to within 0.25-mm accuracy, using Matlab software (Mathworks, Natick, MA; Figure 1C). The short- and long-axis measurements for each adenoma were used to calculate the adenoma surface area as πab (a = radius of long axis, b = radius of short axis). The distal end of the endoscope was calibrated at 1-cm increments. Mice underwent endoscopy each week for 10 weeks to assess adenoma growth and for 5 weeks to evaluate response of adenomas to rapamycin therapy.
MRI Procedure
Immediately after completing endoscopy, the mice were scanned in a Varian 7 Tesla horizontal bore MRI. A Varian 108 mm x 63 mm quad coil was used. Mice were anesthetized and maintained at 1.5% isoflurane using a nose cone inside the coil for the duration of the MRI scan. Before entering the coil, mice were placed on a custom-fabricated plastic bed and given a subcutaneous injection with 0.025 ml of 0.5 M gadopentetate dimeglumine (Magnevist, Bayer HealthCare Pharmaceuticals Inc., Wayne, NJ; NDC 50419-188-46). The lumen of the colon was distended using a programmable infusion pump (PHD2000, Harvard Apparatus, Holliston, MA). A flexible catheter was placed into the rectum approximately 1 cm from the anus and taped to the tail for stability. Fluorinert was infused (0.05 ml/min) before scanning and during the scan. Coronal and axial T1-weighted scans were collected from each mouse. For coronal acquisition, the following parameters were used: repetition time/echo time (TR/TE), 750/20; 1 average; 20 slices; 0.5 mm thick; display matrix, 128 x 128; field of view, 50 mm x 25 mm. This view was used to determine the approximate location of the adenoma to perform the axial scan (Figure 1D, dashed lines). For axial acquisition, the following parameters were used: TR/TE, 1450/20; 1 average; 40 slices; 1.0 mm thick; matrix size, 128 x 128; field of view, 25 mm x 25 mm. Tumor volumes were calculated by drawing a region of interest (ROI) around each adenoma on consecutive axial slices, summing the areas of the ROI, and multiplying by the slice thickness. Mice underwent MRI every other week for 10 weeks to assess adenoma growth and every week for 5 weeks to evaluate response to therapy.
Ex Vivo Validation
Mice being monitored for adenoma (arrow) growth were euthanized after completion of imaging, and the colon of each mouse was excised, exposing the mucosal surface, as shown in Figure 1E. Vernier calipers were used to measure the width (a), length (b), and height (c) of the adenoma to calculate the approximate postmortem surface area (πab) and volume (4πabc/3) for comparison with the results on endoscopy and MRI, respectively. The data were linearized by dividing the size of the adenoma at each time point by its initial size in week 0 and then taking the natural log. The doubling time for each adenoma was calculated by taking the slope of the linearized data.
Rapamycin Administration
Rapamycin was first dissolved in 200 proof ethanol to create a 20 mg/ml stock solution, which was then diluted with 5% Tween 80/PEG 400 solution (Tween 80 #P1754 and PEG 400 #P3265; Sigma-Aldrich, St Louis, MO). Mice at ages 5 to 6 months were given 5 mg/kg rapamycin (#R0395, Sigma-Aldrich) through intraperitoneal (i.p.) injection daily (7x/week) for 35 days.
Histology
All tissues were fixed in phosphate-buffered formalin for 24 hours, paraffin-embedded, sectioned into 10-µm thin slices, and stained with hematoxylin and eosin (H&E).
IHC and Western Blot Analysis
Sections of formalin-fixed and paraffin-embedded mouse colon tissues were subjected to immunohistochemical analysis [26] using the following primary antibodies: mouse anti-total β-catenin (1:800; BD Transduction Laboratories, San Jose, CA), rat anti-Ki67 (1:500; Dako, Carpinteria, CA), and rabbit anti-phospho-S6 (Ser235/236; 1:200; clone 91B2, Cell Signaling Technology, Danvers, MA). All Western blot analyses were done as described previously [26] using the following antibodies: mouse anti-total β-catenin (1:800; BD Transduction Laboratories), rabbit anti-phospho-S6 (Ser235/236; 1:1000; clone 91B2, Cell Signaling Technology), mouse anti-total S6 (1:1000; clone 54D2, Cell Signaling Technology), rabbit anti-phospho-p70 S6 kinase (1:1000; clone 91B2, Cell Signaling Technology), rabbit anti-total S6 kinase (1:1000, Santa Cruz Biotechnology, Santa Cruz, CA), and mouse anti-β-actin (1:10000; Sigma).
Statistics
A two-tailed Pearson's correlation was used to compare adenoma dimensions on endoscopy and MRI (PASW Statistics 18, Chicago, IL). All results are reported as SEM unless otherwise noted.
Results
Imaging of Adenoma Growth and Regression
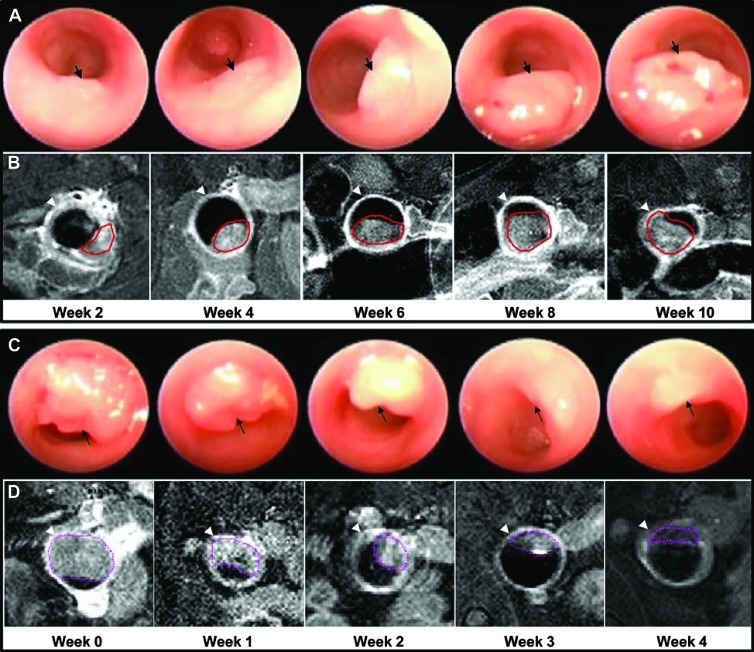
Dimensions from n = 30 adenomas in n = 7 animals at distances of 0.5 to 4 cm from the anus were measured on endoscopy. Growth of a representative adenoma on endoscopy is shown every other week over a period of 10 weeks (Figure 2A). The adenoma (arrow) expands rapidly in size over this period of time. The same adenoma (red line) is shown on T1-weighted axial MRI at the same time points (Figure 2B). The arrowhead identifies the periphery of the colonic wall. The mean adenoma doubling times on endoscopy and MRI were found to be 0.95 ± 0.14 and 1.21 ± 0.16 weeks, respectively.
Figure 2.
Monitoring of adenoma growth and regression. (A) In vivo adenoma growth (arrow) on endoscopy is shown over 10 weeks. (B) The same adenoma is shown on T1-weighted axial MRI performed at the same time points. The ROI (red) drawn around the adenoma is used to measure tumor volume. Arrowhead identifies colonic wall. (C) Adenoma regression in response to rapamycin therapy is shown on endoscopy over 4 weeks. (D) The same adenoma is shown on T1-weighted axial MRI with ROI (purple) drawn to measure tumor volume.
Animals (n = 10) were treated with 5 mg/kg rapamycin administered i.p. daily (7 days/week) for 5 weeks. The response of a representative adenoma to rapamycin therapy over a 4-week period on endoscopy is shown (Figure 2C). The adenoma (arrow) is seen to regress in size considerably over this period of time. The same adenoma (purple line) is shown on T1-weighted axial MRI at identical time points (Figure 2D). In total, n = 24 adenomas were studied. Mice that received rapamycin showed no adverse physical signs.
Analysis of Adenoma Growth and Regression
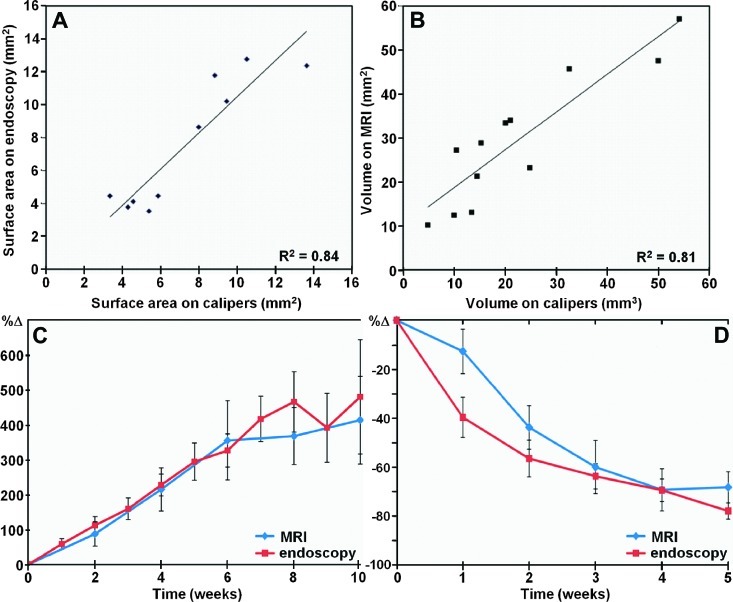
The surface areas of adenomas measured in vivo on endoscopy are compared with that evaluated postmortem with calipers (R2 = 0.84, Figure 3A), and the volume of adenomas measured in vivo on MRI are compared with that evaluated postmortem with calipers (R2 = 0.81, Figure 3B). The minimum adenoma surface area measured on endoscopy was 0.88 mm2 compared to 0.47 mm2 on calipers. The minimum adenoma volume detectable on MRI was 1.76 mm3 compared to 0.31 mm3 on calipers. These values were determined by the smallest adenoma dimensions first seen for each modality. A comparison of adenoma growth rates in percent change (%Δ) on endoscopy and MRI is shown (R2 = 0.73, Figure 3C). A Pearson's correlation of ρ = 0.836 (P < .001) indicates significance.
Figure 3.
Validation of adenoma dimensions, growth, and regression. (A) Surface areas of adenomas measured on endoscopy in vivo are compared with that evaluated postmortem with calipers (R2 = 0.84). (B) Volumes of adenomas measured on MRI in vivo are compared with that evaluated postmortem with calipers (R2 = 0.81). (C) Comparison of adenoma growth rate in percent change (%Δ). (D) Comparison of adenoma regression rate in percent change (%Δ) in response to rapamycin therapy.
After 5 weeks of rapamycin therapy, all adenomas monitored were found to regress in size, and 5 of 24 adenomas were too small to be detected with either imaging technique. No carcinomas were found in this cohort of mice. A comparison of adenoma regression rate in percent change (%Δ) on endoscopy and MRI in response to rapamycin therapy is shown (R2 = 0.40, Figure 3D).
Rapamycin Inhibits mTOR Signaling and Reduces Tumor Proliferation in Adenomas
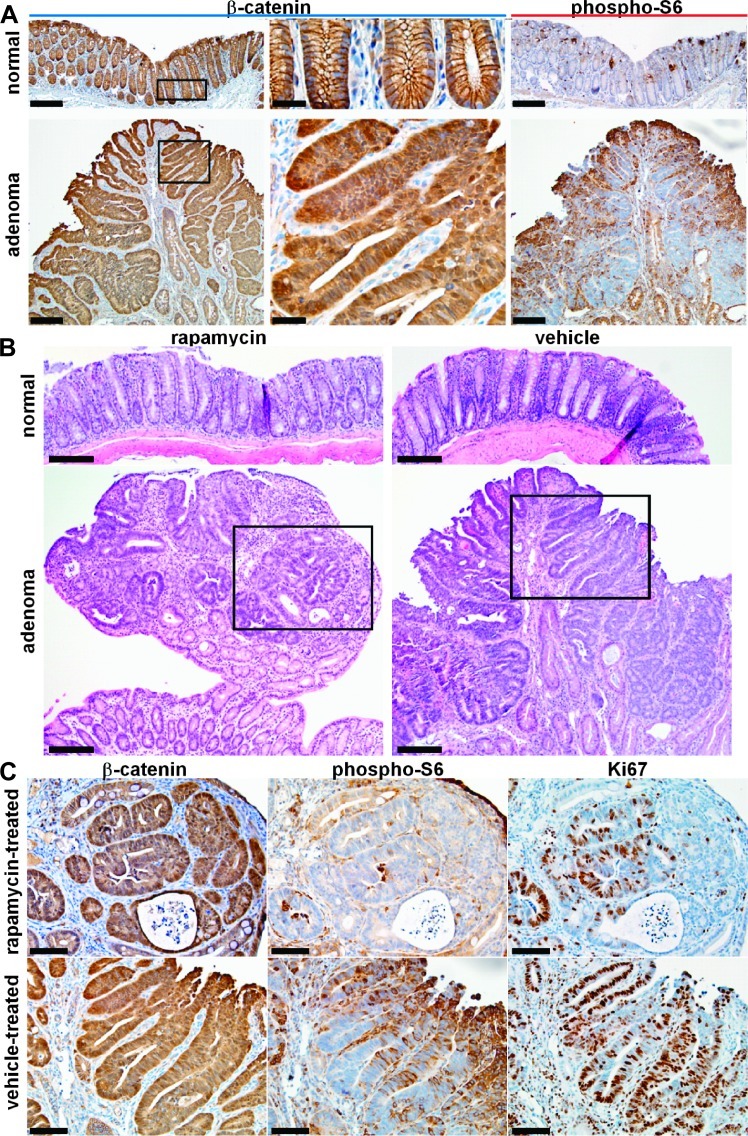
IHC analysis from representative low magnification images of normal (control) distal colonic mucosa and adenoma with β-catenin (left, middle panels) and phospho-S6 (right panels) are shown (Figure 4A). The boxed areas from the left panels (scale bars, 50 µm) are shown in high magnification in the middle panels (scale bar, 25 µm). Increased expression of β-catenin and phospho-S6 can be appreciated in the adenoma.
Figure 4.
Rapamycin treatment inhibits mTOR signaling and attenuates cell growth in adenomas with Apc defect. (A) Representative low magnification images show increased total β-catenin expression from adenoma derived from CPC;Apc mice in comparison to normal (left panels; scale bar, 100 µm). Boxed regions are shown in high magnification (middle panels; scale bar, 20 µm). Increased expression of phospho-S6 can be appreciated in adenoma in comparison to normal (right panels; scale bar, 100 µm). (B) Histology (H&E) of normal distal colonic epithelium and adenoma treated with rapamycin (left panels) and vehicle (right panels; scale bars, 100 µm). The boxed areas indicate regions of dysplasia that were further studied on IHC below. (C) Significant levels of total β-catenin expression were observed from the adenomas in both rapamycin and vehicle-treated adenomas (left panels). Level of phospho-S6 ribosomal protein expression is lower in residual adenoma from rapamycin-treated mouse compared to that for the vehicle-treated mouse (middle panels). A significant reduction in the number of Ki67-labeled cells was observed in rapamycin-treated adenomas compared to vehicle-treated adenomas (right panels; scale bars, 25 µm).
Histology (H&E) of normal (control) distal colonic epithelium and adenoma treated with rapamycin (left panels) and vehicle (right panels) is shown (Figure 4B; scale bars, 100 µm). The boxes in the bottom panels show regions of dysplasia that were further studied on IHC. Significant levels of β-catenin expression were observed in the adenomas in both the rapamycin-treated and vehicle-treated adenomas (Figure 4C, left panels). The level of expression of phospho-S6 ribosomal protein was found to be lower in a residual adenoma from the rapamyc-intreated mouse compared to that for the vehicle-treated mouse (Figure 4C, middle panels). This result reflects reduced mTOR pathway signaling and is supported by the observation of a significant reduction in Ki67-labeled cells in rapamycin-treated adenomas compared to vehicle-treated adenomas (Figure 4C, right panels; scale bars, 50 µm).
These results are validated on Western blot analysis of β-catenin, phospho-p70 S6 kinase (phospho-S6K), total S6K, phospho-S6, total S6, and β-actin (control) of normal colonic mucosa and adenomas from two normal (control) wild-type mice (normal1 and normal2) and two CPC;Apc mice (adenoma1 and adenoma2; Figure 5).
Figure 5.
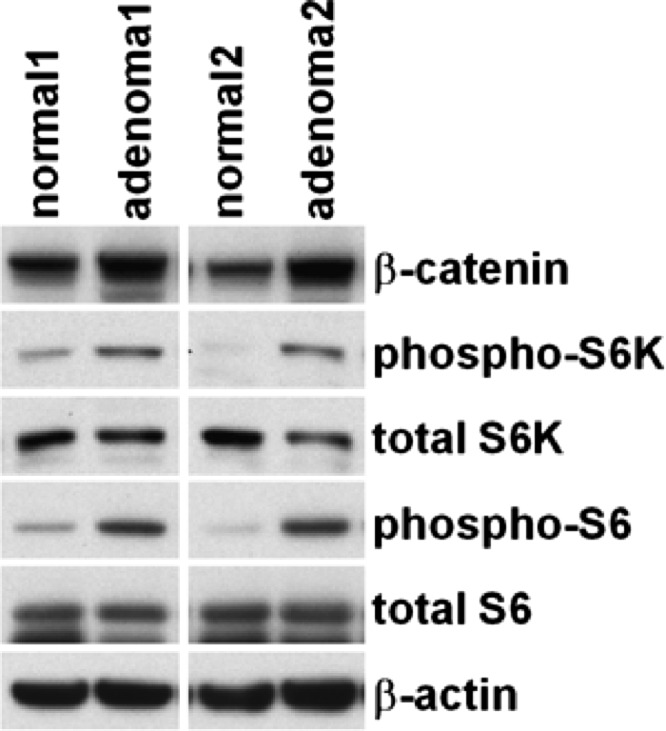
Western blot analysis. Representative results are shown for Western blot analysis of total β-catenin, phospho-S6K, total S6K, phospho-S6, total S6, and β-actin from normal colon epithelium from two wild-type (control) mice (normal1 and normal2) and adenomas from two CPC NLS Cre Apcflox/+ mice (adenoma1 and adenoma2).
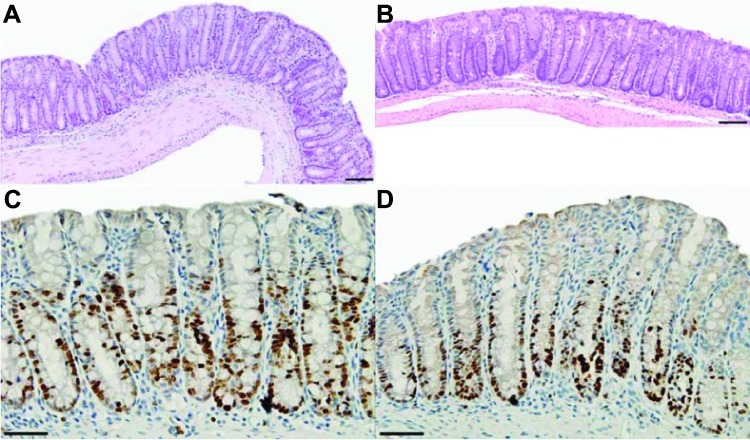
We found that residual colonic adenomas from CPC;Apc mice treated with rapamycin revealed similar histology (H&E) to that of normal distal colonic epithelium from untreated wild-type mice (scale bars, 100 µm; Figure 6, A and B). In addition, the normal distal colonic epithelium (control) in rapamycin-treated CPC;Apc mice showed no difference in Ki67 staining in comparison to vehicle-treated normal epithelium from wild-type mouse (scale bars, 50 µm; Figure 6, C and D).
Figure 6.
Colonic epithelial histology and cell proliferation in CPC;Apc mouse treated with rapamycin. (A) Residual colonic adenoma from CPC;Apc mouse treated with rapamycin reveals similar histology (H&E) to that of (B) normal distal colonic epithelium from wildtype mouse not treated with rapamycin (scale bars, 100 µm). (C) Rapamycin-treated normal distal colonic epithelium (control) from CPC;Apc mouse shows no difference in Ki67 staining in comparison to (D) vehicle-treated normal colonic epithelium from wild-type mouse (scale bars, 50 µm).
Discussion
Here, we demonstrate an optical MRI multimodal imaging strategy for quantifying the growth and regression of colonic adenomas over time. Optical imaging has superior spatial resolution in comparison to other modalities, thus tumor dimensions can be measured with very high accuracy and much smaller lesions can be detected. We have demonstrated that our correlation of adenoma size with postmortem measurements ex vivo is consistent with previously reported data on lumen distention versus caliper measurements [11]. Because endoscopic images are collected as a two-dimensional (planar) projection of a three-dimensional (volumetric) mass, validation of overall lesion dimensions in vivo by an independent, previously established, imaging modality, such as MRI, is needed. Whereas a previous study compared estimates of lesion size on endoscopy with that obtained on MRI and on necropsy [2], we show here how this multimodal imaging strategy can be used effectively to monitor therapy. The ability to accurately measure the lesion size on endoscopy is a powerful tool for evaluating the efficacy of new drug therapies by enhancing the statistical power of longitudinal investigations and minimizing the number of tumor-bearing animals.
Furthermore, we showed that rapamycin therapy can greatly regress or even completely eradicate established colonic adenomas, suggesting that rapamycin or other mTOR inhibitors may be of clinical value in management of colorectal adenomas in high-risk patients, such as those with familial polyposis. Our results are consistent with previous studies that show that mTOR inhibitors can suppress small intestinal polyps derived from ApcMin mice [21,22]. However, our study is the first to show that rapamycin can also effectively treat colon-specific adenomas in a spontaneous model, which is different from results shown previously where no inhibitory effects of rapamycin were found for large intestinal adenomas [21]. The results between our study and the study of Koehl et al. may reflect a difference in route (diet vs i.p. injection) and in dosage achieved with rapamycin administration. Interestingly, whereas the study of Koehl et al. showed no accumulation of β-catenin in rapamycin-treated adenomas compared to normal intestinal epithelium [21], the residual neoplastic cells in rapamycin-treated mice from our study still retained nuclear and cytoplasmic staining of β-catenin and increased β-catenin levels in comparison to normal colonic mucosa. Thus, our results suggest that rapamycin exerts its inhibitory effects downstream of β-catenin accumulation. Consistent with the study of Fujishita et al. [22], we showed that rapamycin suppresses tumor growth through inhibition of cell proliferation. Our study implies that the higher mTOR signaling found in colonic adenomas with Apc mutation compared with normal colonic epithelium may enhance susceptibility of adenomas to rapamycin treatment.
Consistent with the significant reduction of adenoma size in the rapamycin-treated mice, about 50% of the adenomas remaining after treatment revealed an epithelial histology largely resembling that of normal-appearing colonic epithelium. Compared with vehicle-treated adenomas with epithelial dysplasia throughout the lesions, the remaining 50% of the rapamycin-treated adenomas that did not completely regress showed a mixture of normal and dysplastic epithelium with extensive lymphocyte infiltration. Interestingly, the residual dysplastic regions in the rapamycin-treated adenomas still show positive nuclear and cytoplasmic staining for β-catenin, suggesting that rapamycin treatment does not interfere with β-catenin activation. Consistent with rapamycin being an mTOR inhibitor, a significant reduction in phosphorylation of S6 ribosomal protein at Ser235/236 was observed in the residual adenomatous epithelium in rapamycin-treated adenomas, suggesting that the mTOR signaling was effectively inhibited by rapamycin in these adenomas. In contrast to the intensive staining of Ki67 in vehicle-treated adenomas, the number of Ki67-positive cells was greatly reduced in rapamycin-treated adenomas, suggesting that rapamycin inhibits tumor growth by reducing the cell proliferation.
Although normal colonic epithelium (control) also showed complete loss of phospho-S6 protein expression after rapamycin treatment, no difference was found in Ki67 staining in comparison to vehicle-treated normal epithelium (Figure 6). mTOR pathway signaling in normal distal colonic epithelium and adenomas was further compared to explore the mechanism underlying the difference in susceptibility to rapamycin therapy. Compared to normal colonic epithelium, protein expression levels of both phospho-S6K and phospho-S6 were significantly increased in adenomas with Apc defect. In addition, a much broader and more intensive staining of phospho-S6 was observed in adenomas compared to that found in normal colonic mucosa. These results imply that higher mTOR pathway signaling observed in adenomas with Apc defect may subject adenomas to “addiction” to mTOR signaling, thus more sensitivity to the mTOR inhibitor rapamycin.
Acknowledgments
We thank Zhongyao Liu for technical support.
Footnotes
This research was supported in part by National Institutes of Health (NIH) grants U54 CA136429, P50 CA93990, and R01 CA142750 to T.D.W. The authors have nothing to disclose.
References
- 1.Joshi BP, Wang TD. Exogenous molecular probes for targeted imaging in cancer: focus on multi-modal imaging. Cancers. 2010;2:1251–1287. doi: 10.3390/cancers2021251. [DOI] [PMC free article] [PubMed] [Google Scholar]
- 2.Hensley HH, Merkel CE, Chang WC, Devarajan K, Cooper HS, Clapper ML. Endoscopic imaging and size estimation of colorectal adenomas in the multiple intestinal neoplasia mouse. Gastrointest Endosc. 2009;69:742–749. doi: 10.1016/j.gie.2008.09.054. [DOI] [PMC free article] [PubMed] [Google Scholar]
- 3.Olive KP, Tuveson DA. The use of targeted mouse models for preclinical testing of novel cancer therapeutics. Clin Cancer Res. 2006;12:5277–5287. doi: 10.1158/1078-0432.CCR-06-0436. [DOI] [PubMed] [Google Scholar]
- 4.American Cancer Society, author. Colorectal Cancer Facts & Figures 2011–2013. Atlanta, USA: American Cancer Society; 2011. [Google Scholar]
- 5.Zauber AG, Winawer SJ, O'Brien MJ, Lansdorp-Vogelaar I, van Ballegooijen M, Hankey BF, Shi W, Bond JH, Schapiro M, Panish JF, et al. Colonoscopic polypectomy and long-term prevention of colorectal-cancer deaths. N Engl J Med. 2012;366:687–696. doi: 10.1056/NEJMoa1100370. [DOI] [PMC free article] [PubMed] [Google Scholar]
- 6.Arnold CN, Goel A, Blum HE, Boland CR. Molecular pathogenesis of colorectal cancer: implications for molecular diagnosis. Cancer. 2005;104:2035–2047. doi: 10.1002/cncr.21462. [DOI] [PubMed] [Google Scholar]
- 7.Moser AR, Pitot HC, Dove WF. A dominant mutation that predisposes to multiple intestinal neoplasia in the mouse. Science. 1990;247:322–324. doi: 10.1126/science.2296722. [DOI] [PubMed] [Google Scholar]
- 8.Young MR, Ileva LV, Bernardo M, Riffle LA, Jones YL, Kim YS, Colburn NH, Choyke PL. Monitoring of tumor promotion and progression in a mouse model of inflammation-induced colon cancer with magnetic resonance colonography. Neoplasia. 2009;11:237–246. doi: 10.1593/neo.81326. [DOI] [PMC free article] [PubMed] [Google Scholar]
- 9.Quarles CC, Lepage M, Gorden DL, Fingleton B, Yankeelov TE, Price RR, Matrisian LM, Gore JC, McIntyre JO. Functional colonography of Min mice using dark lumen dynamic contrast-enhanced MRI. Magn Reson Med. 2008;60:718–726. doi: 10.1002/mrm.21724. [DOI] [PMC free article] [PubMed] [Google Scholar]
- 10.Hensley HH, Chang WC, Clapper ML. Detection and volume determination of colonic tumors in Min mice by magnetic resonance microimaging. Magn Reson Med. 2004;52:524–529. doi: 10.1002/mrm.20175. [DOI] [PubMed] [Google Scholar]
- 11.Hung KE, Maricevich MA, Richard LG, Chen WY, Richardson MP, Kunin A, Bronson RT, Mahmood U, Kucherlapati R. Development of a mouse model for sporadic and metastatic colon tumors and its use in assessing drug treatment. Proc Natl Acad Sci USA. 2010;107:1565–1570. doi: 10.1073/pnas.0908682107. [DOI] [PMC free article] [PubMed] [Google Scholar]
- 12.McCart AE, Vickaryous NK, Silver A. Apc mice: models, modifiers and mutants. Pathol Res Pract. 2008;204:479–490. doi: 10.1016/j.prp.2008.03.004. [DOI] [PubMed] [Google Scholar]
- 13.Boivin GP, Washington K, Yang K, Ward JM, Pretlow TP, Russell R, Besselsen DG, Godfrey VL, Doetschman T, Dove WF, et al. Pathology of mouse models of intestinal cancer: consensus report and recommendations. Gastroenterology. 2003;124:762–777. doi: 10.1053/gast.2003.50094. [DOI] [PubMed] [Google Scholar]
- 14.Hinoi T, Akyol A, Theisen BK, Ferguson DO, Greenson JK, Williams BO, Cho KR, Fearon ER. Mouse model of colonic adenoma-carcinoma progression based on somatic Apc inactivation. Cancer Res. 2007;67:9721–9730. doi: 10.1158/0008-5472.CAN-07-2735. [DOI] [PubMed] [Google Scholar]
- 15.Miller SJ, Joshi BP, Feng Y, Gaustad A, Fearon ER, Wang TD. In vivo fluorescence-based endoscopic detection of colon dysplasia in the mouse using a novel peptide probe. PLoS One. 2011;6:e17384. doi: 10.1371/journal.pone.0017384. [DOI] [PMC free article] [PubMed] [Google Scholar]
- 16.Wullschleger S, Loewith R, Hall MN. TOR signaling in growth and metabolism. Cell. 2006;124:471–484. doi: 10.1016/j.cell.2006.01.016. [DOI] [PubMed] [Google Scholar]
- 17.Strimpakos AS, Karapanagiotou EM, Saif MW, Syrigos KN. The role of mTOR in the management of solid tumors: an overview. Cancer Treat Rev. 2009;35:148–159. doi: 10.1016/j.ctrv.2008.09.006. [DOI] [PubMed] [Google Scholar]
- 18.Aoki K, Tamai Y, Horiike S, Oshima M, Taketo MM. Colonic polyposis caused by mTOR-mediated chromosomal instability in Apc+/Δ716Cdx2+/- compound mutant mice. Nat Genet. 2003;35:323–330. doi: 10.1038/ng1265. [DOI] [PubMed] [Google Scholar]
- 19.Sarbassov DD, Guertin DA, Ali SM, Sabatini DM. Phosphorylation and regulation of Akt/PKB by the rictor-mTOR complex. Science. 2005;307:1098–1101. doi: 10.1126/science.1106148. [DOI] [PubMed] [Google Scholar]
- 20.Jacinto E, Facchinetti V, Liu D, Soto N, Wei S, Jung SY, Huang Q, Qin J, Su B. SIN1/MIP1 maintains rictor-mTOR complex integrity and regulates Akt phosphorylation and substrate specificity. Cell. 2006;127:125–137. doi: 10.1016/j.cell.2006.08.033. [DOI] [PubMed] [Google Scholar]
- 21.Koehl GE, Spitzner M, Ousingsawat J, Schreiber R, Geissler EK, Kunzelmann K. Rapamycin inhibits oncogenic intestinal ion channels and neoplasia in ApcMin/+ mice. Oncogene. 2010;29:1553–1560. doi: 10.1038/onc.2009.435. [DOI] [PubMed] [Google Scholar]
- 22.Fujishita T, Aoki K, Lane HA, Aoki M, Taketo MM. Inhibition of the mTORC1 pathway suppresses intestinal polyp formation and reduces mortality in ApcΔ716 mice. Proc Natl Acad Sci USA. 2008;105:13544–13549. doi: 10.1073/pnas.0800041105. [DOI] [PMC free article] [PubMed] [Google Scholar]
- 23.Durkee BY, Shinki K, Newton MA, Iverson CE, Weichert JP, Dove WF, Halberg RB. Longitudinal assessment of colonic tumor fate in mice by computed tomography and optical colonoscopy. Acad Radiol. 2009;16:1475–1482. doi: 10.1016/j.acra.2009.07.023. [DOI] [PMC free article] [PubMed] [Google Scholar]
- 24.Shibata H, Toyama K, Shioya H, Ito M, Hirota M, Hasegawa S, Matsumoto H, Takano H, Akiyama T, Toyoshima K, et al. Rapid colorectal adenoma formation initiated by conditional targeting of the Apc gene. Science. 1997;278:120–123. doi: 10.1126/science.278.5335.120. [DOI] [PubMed] [Google Scholar]
- 25.Becker C, Fantini MC, Neurath MF. High resolution colonoscopy in live mice. Nat Protoc. 2006;1:2900–2904. doi: 10.1038/nprot.2006.446. [DOI] [PubMed] [Google Scholar]
- 26.Feng Y, Bommer GT, Zhai Y, Akyol A, Hinoi T, Winer I, Lin HV, Cadigan KM, Cho KR, Fearon ER. Drosophila split ends homologue SHARP functions as a positive regulator of Wnt/β-catenin/T-cell factor signaling in neoplastic transformation. Cancer Res. 2007;67:482–491. doi: 10.1158/0008-5472.CAN-06-2314. [DOI] [PubMed] [Google Scholar]


