

Abstract
High-throughput biological experiments commonly result in a list of genes or proteins of interest. In order to understand the observed changes of the genes and to generate new hypotheses, one needs to understand the functions and roles of the genes and how those functions relate to the experimental conditions. Typically, statistical tests are performed in order to detect enriched Gene Ontology categories or Pathways, i.e. the categories are observed in the genes of interest more often than is expected by chance. Depending on the number of genes and the complexity and quantity of functions in which they are involved, such an analysis can easily result in hundreds of enriched terms. To this end we developed DEFOG, a web-based application that facilitates the functional analysis of gene sets by hierarchically organizing the genes into functionally related modules. Our computational pipeline utilizes three powerful tools to achieve this goal: (1) GeneMANIA creates a functional consensus network of the genes of interest based on gene-list-specific data fusion of hundreds of genomic networks from publicly available sources; (2) Transitivity Clustering organizes those genes into a clear hierarchy of functionally related groups, and (3) Ontologizer performs a Gene Ontology enrichment analysis on the resulting gene clusters. DEFOG integrates this computational pipeline within an easy-to-use web interface, thus allowing for a novel visual analysis of gene sets that aids in the discovery of potentially important biological mechanisms and facilitates the creation of new hypotheses. DEFOG is available at http://www.mooneygroup.org/defog.
Introduction
Modern methods in molecular biology yield lists of genes or proteins with common functional profiles, for example, differentially expressed genes under varying conditions. In order to identify common traits between these genes, statistical tests are typically applied utilizing functional or pathway annotations. The Gene Ontology (GO)1 is among the most widely used sources for such an analysis, and a variety of methods have been developed that utilize GO in this manner. BiNGO2, GOEAST3, GOLEM4 and DAVID5 are examples of popular analysis tools based on GO.
Term enrichment analysis on gene sets is often complicated by a high degree of overlapping GO terms annotated to the test genes, leading to high numbers of statistically enriched terms. Even after correction for multiple hypothesis testing, a list of 100+ genes can easily result in hundreds of enriched terms, leading to unfocused conclusions and misguided hypotheses. Different strategies have been developed to overcome this problem. The Gene Ontology Consortium, for instance, provides a slim version of GO that is less specific, leading to a reduced number of overrepresented terms. However, the resulting enriched concepts are often too general to be useful. Ontologizer6, an enrichment analysis tool, approaches the problem by incorporating the hierarchical structure of GO into their statistics, thus reducing the number of annotated terms due to parent-child inheritance. Additionally, DAVID approaches the problem by clustering concepts together based on Cohen’s kappa statistic as a measure of gene-term annotation similarity. This latter approach organizes the enriched terms into similar groups, however the number of terms remains the same.
Another method that can be used to understand the functional content of a given list of genes is to organize the list of genes prior to analysis. DAVID, for instance, allows users to cluster genes based on common annotations, again using Cohen’s kappa statistic7. Kurki et. al.8 follow a similar approach by hierarchically clustering genes based on common GO annotations or co-regulation. In various other methods, genes have been grouped together using biological networks, such as protein-protein-interaction9,10 networks (PPI), co-expression networks11-14, or sequence similarity networks15-17. However, to our knowledge there are no tools that utilize multiple high-throughput gene similarity networks in order to identify clusters of functionally related genes.
Data fusion of multiple biological data sources such as PPI networks, gene expression data or sequence similarity information has been successfully applied in gene prioritization and gene function prediction method that are mostly based on guild-by-association principles18,19. A logical step is, to use this information in an unsupervised or semi-supervised approach, i.e. clustering, for detecting groups of functionally similar genes. With DEFOG we present a novel method that performs such an analysis for a given gene list. DEFOG aids in the understanding of the functional content of a given gene list by organizing the genes into functionally related groups based on data fusion of experimentally derived gene similarity networks. For this task, DEFOG utilizes a computational pipeline that combines three powerful analysis tools. Similarities between genes are calculated using GeneMANIA19,20, followed by hierarchical clustering with Transitivity Clustering21,22, and finally followed by an enrichment analysis for each cluster with Ontologizer. Results are presented as a hierarchical graph of gene clusters. Each hierarchical level represents increasing specificity, resulting in smaller clusters with higher functional similarity between the genes.
In the remainder of this paper we will describe the methodology and motivation behind the development and utilization of each component of DEFOG. Furthermore we apply DEFOG on two publicly available gene sets as test cases. For the first use-case, we utilize the primary interactors of the Huntingtin protein in the human PPI network to serve as an example of a disease-related gene set. For the second use-case, we selected a highly diverse set of genes, the GenAge23,24 database, the contents of which are known to be involved in human aging. In both cases DEFOG successfully creates a hierarchy that allows researchers to better understand the functional sub-modules hidden within the input set of genes.
Methods and motivation
The DEFOG web application consists of a three component computational pipeline that serves as the backend of our software (Fig. 1), while the frontend employs a user-friendly web-based visualization utility.
Fig 1.
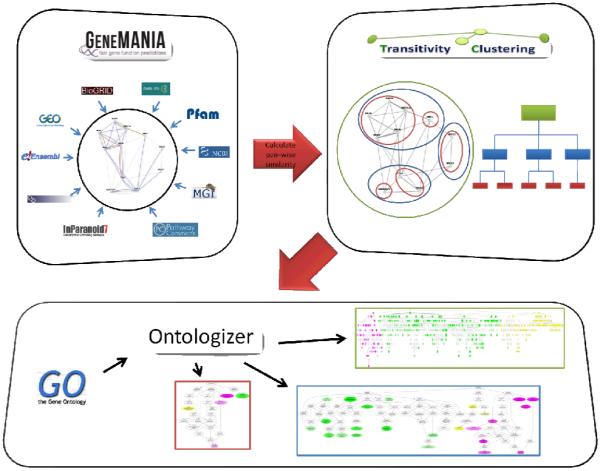
The DEFOG workflow. First, GeneMANIA assembles biological networks from multiple sources and combines them into a consensus gene similarity network. Second, hierarchical clustering is performed using Transitivity Clustering. Finally, Ontologizer is applied to detect statistically overrepresented gene ontology terms in each cluster. Colors represent different levels of specificity.
Collection of network data and creation of the consensus network using GeneMANIA
The first (and one of the most important) steps in our computational pipeline is the creation of the consensus network, which is subsequently used to identify functionally closely related groups of genes.
Biological networks can differ greatly from each other. PPI networks, for instance, are typically binary networks, while co-expression relationships can be represented with weights on the edges. Even if all of the networks in existence were the same type of network, it would be difficult to combine them, since different weights might mean completely different things in different networks. For instance, in the case of all binary networks, the underlying rule that defines whether an edge exists might be much more strict in one network than in another. To overcome this problem we chose to utilize the GeneMANIA19 software, which integrates a network fusion algorithm that accounts for these differences in networks and assigns weights to networks based on the contribution of each network in connecting the genes of interest.
GeneMANIA is a gene function prediction method that employs various biological networks to predict related genes within the genome that are functionally most similar to an input set of genes. The utilized networks are publicly available PPI networks, co-expression networks, co-localization networks, shared pathway networks, and shared protein domain networks. GeneMANIA obtained over 1380 networks for six model organisms and human (353 networks for human) from Gene Expression Omnibus25, BioGRID26, I2D27, and Pathway Commons (which includes data from BioGRID, Memorial Sloan-Kettering Cancer Center, Human Protein Reference Database28, HumanCyc29, Systems Biology Center New York, IntAct30, MINT31, NCI-Nature Pathway Interaction Database, and Reactome32). The similarity between two genes is calculated by combining these networks with different weights for each network. In GeneMANIA, and thus also in DEFOG, a user can decide between three different weighting options: (1) equal weighting for all data sources, (2) equal weighting for categories, such as PPI networks or co-expression networks, or (3) a more advanced algorithm that determines the weight based on the contribution of each network to the inter-connectivity of the input set of genes.
More specifically, the GeneMANIA advanced network fusion method combines a variety of networks using ridge regression to minimize the difference between the consensus network and a target network. The aim is to find a weighting for each network such that, in the consensus network (the weighted sum of the included networks), genes from the input list of genes have a high similarity to each other and little similarity to other genes in the background. The underlying idea is that the input genes have a functional relationship to each other due to their selection or experiment. One can now utilize this relationship, together with established interactions to create new hypotheses. Networks that play a key role in connecting the input list of genes might be important for the experimental design or selection criteria of interest and thus have more impact in the follow up analyses than networks which have many connections between the input genes and the background.
DEFOG applies the GeneMANIA network fusion method to retrieve a consensus similarity network for a given gene. The similarity used in the next step of DEFOG’s pipeline, is defined for two genes as the weighted sum of all chosen gene networks/similarities where the weights are obtained via GeneMANIA as described above. A user may choose construct a similarity using either all available networks, or the default set of networks (see http://www.genemania.org/ for the current default set), or limit the analysis to a single network type.
Furthermore, GeneMANIA performs gene ID translation between multiple identifier types. DEFOG utilizes this function to allow for the analysis of lists of genes using a variety of different identifiers (i.e. - gene symbols and ids from Entrez Gene33, Ensemble34, Refseq35, and UniProt36).
Hierarchically organize genes with Transitivity Clustering
In the next step of our analysis pipeline, we use the gene-list-specific consensus network from GeneMANIA to organize the genes into functional modules.
There are three basic methods for clustering data: (1) partition the data into non-overlapping groups, (2) organize the elements into clusters, where one element can be assigned to multiple groups, or (3) create a hierarchical clustering topology where each level in the hierarchy represents a data partitioning and all groups in one level are either equal to, or are subgroups of the clusters in the level above.
The first option strongly depends on the parameters of the chosen clustering algorithm, e.g. using a clustering method like k-means37 requires one to specify the expected number of clusters. Having a choice of parameters is necessary for all partitional clustering algorithms that are of interest to us, since parameter-free methods have no flexibility and would likely not detect important functional gene clusters. It is difficult, however, to estimate these clustering parameters in advance, as we don’t know how many functional modules are expected from a novel dataset. The number of interesting functional groups may also vary depending on the input set of genes, which eliminates the option of detecting one fixed set of parameters via manual evaluations. An overlapping clustering method would add some flexibility and some interesting information. Since genes might be involved in multiple different functions one could argue that this would be the best choice. Unfortunately we face the same difficulties as in the partitional clustering, i.e. we don’t know and can’t estimate the appropriate size or number of functional groups. In order to give an organized representation of the modular structure of the gene set with respect to the consensus similarity network, we apply a hierarchical clustering method. By choosing this method, it is no longer possible for genes to belong to multiple groups. However, this is compensated by an intrinsic gain of flexibility and, thus, a less likely loss of information. Another advantage of a hierarchical structure is that the relationships between the clusters are implicit in the method, allowing for an overall gain of information.
Traditional, agglomerative hierarchical clustering methods38,39 start with a list of singletons and iteratively combine the two most similar clusters in each step. For a gene set of considerably large size, clusters of related groups are hard to detect due to the fine granularity between potential cluster boundaries (i.e. the hierarchy has as many levels as genes). A more structured and easier to read hierarchy can be obtained with Transitivity Clustering (TC)21.
TC is a novel, fast, and versatile clustering approach that clusters based on a pairwise similarity function and a similarity threshold. First, a graph is constructed, where nodes represent the genes and an edge exists if the similarity is above the threshold. Subsequently, clustering is accomplished by performing a minimal number of edge modifications (adding and deleting) in order to obtain a transitive graph (i.e., a graph whose connected components are fully connected). The resulting cliques are reported as clusters. The TC similarity threshold can be varied to change the number and size of the resulting clusters. TC is basically a partitional clustering method that has one density parameter, a similarity threshold, to control the granularity of the clustering. In previous experiments we observed, that TC produces a wider spectrum of clusterings (many small clusters and few big clusters) when varying the density parameter in comparison to alternative methods such as Markov Clustering (MCL), which sometimes have difficulties detecting very small, highly connected clusters. Furthermore TC has been successfully applied to sequence similarity, protein interaction, and gene expression networks, showing its flexibility and applicability for a variety of clustering tasks.
Although TC produces a partitional clustering given one similarity threshold, it can also be used to obtain a hierarchical clustering given a sorted set of thresholds. Starting with the most stringent (highest) threshold, TC is iteratively applied on the set of cutoffs. Once two elements are grouped together in a previous iteration, they cannot be split at any later step. This enforces a hierarchical clustering as defined above and preserves clustering features of TC (For more details about TC refer to 40,41)
DEFOG utilizes TC with a set of similarity thresholds within the range of the consensus similarity function, to obtain a well structured, informative hierarchical clustering. The set of similarities above zero are sorted and divided into n equal sized parts (quantiles) where the smallest similarity in each set is used as a threshold in TC. A user can specify n, which is the maximal number of levels in the hierarchy, and thus control the granularity of the hierarchy. The default value of 10 gives a moderate hierarchical clustering that is in most cases still clearly organized, and contains a considerable amount of information about the division of functional sub-modules.
Detect overrepresented GO categories with Ontologizer
The last step in our computational pipeline is to categorize and describe each cluster. Here we follow the traditional approach of using GO to describe the functional content of each cluster. It is common to identify statistically overrepresented GO terms in a list of candidate genes by applying Fisher’s exact test42. This test compares the number of genes that are annotated to a term against the expected occurrence of annotation, based on the background annotation. In GO, a gene that is annotated to a child node is automatically annotated to all its parents (up to the root node). A typical term-for-term test (i.e. Fisher’s exact test) treats each term individually without considering its position in the ontology.
Ontologizer includes statistics that account for this additional information by restricting the background set for each term to the genes contained in its parents. Thus, they distinguish between two cases: “Parent-Child-Union” where genes that are in the union of all the parent terms are used as background, and “Parent-Child-Intersection”, a more stringent method that only considers genes in the background if they are present in all parent terms of the term of interest. In addition to this modified statistic, Ontologizer provides the traditional “Term-For-Term” analysis and all commonly used methods for multiple hypothesis correction (Bonferroni, Bonferroni-Holm43, Benjamini-Hochberg44, Benjamini-Yekutieli45, Westfall-Young46). Ontologizer’s flexibility makes it a perfect tool to be integrated into the DEFOG computational pipeline.
We utilize Ontologizer to calculate the overrepresentation of GO terms for each cluster derived from the previous TC step, using a default setting of “Term-For-Term” for the enrichment analysis. After the analysis is complete, a user can navigate through the resulting cluster hierarchy and gain insight into the biological underpinnings of each functionally related sub-cluster by means of the enriched GO categories. In DEFOG we consider a GO term to be enriched if it’s adjusted p-value (after multiple hypothesis correction) is smaller than 0.05 and at least 3 genes of the input set are annotated to that term.
Visualization of hierarchically organized gene cluster
For the graphical representation of the results, we utilized Cytoscape Web47. Fig. 2 shows a typical outcome of an analysis with DEFOG. Each node represents a group of genes, where the number in each node is the size of the respective gene cluster. Nodes are connected to another node if they are a subset of the parent node. The hierarchy is intuitively drawn from top to bottom (i.e. - all input genes are in the largest cluster at the top of the graph, and the lower the position in the graph the more specific and smaller the clusters get). Additionally, the node color and the node size reflect the cluster size. To further improve and clarify the cluster visualization, all clusters with fewer genes than a user-defined threshold are excluded from the results.
Fig. 2.
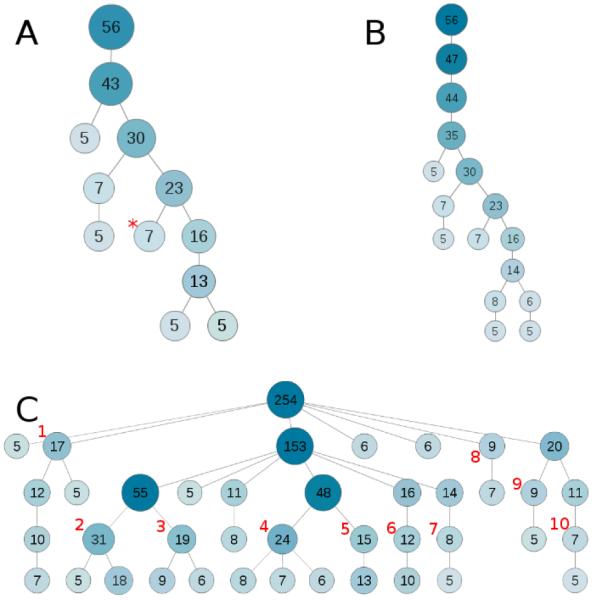
Use-case clustering graphs from the output of DEFOG. A) represents the cluster graph from use-case #1 (HTT primaries) run with the default DEFOG settings. B) represents the same data as A, but with the clustering levels changed from 10 to 20. C) shows the resulting graph from running use-case #2 (GenAge) through DEFOG, with the clustering levels set to 5. Darker shaded, larger nodes represent larger clusters, with numbers representing the size of a cluster, i.e. the number of genes in that cluster. Gene groups with less than 5 genes are excluded from this graphical representation (default setting for DEFOG). Asterisks indicate nodes focused on for analysis and red numbers are specific markers for extended discussion.
A user can navigate the output of DEFOG on the results page by either clicking or double-clicking on nodes. A single click opens a table below the graph, containing all enriched GO categories for the selected cluster. A double-click reveals more information about the cluster itself, including the list of genes that comprise the selected cluster and the ability to export the GO enrichment table as a tab-delimited text file. Additionally, the user can download the complete hierarchical clustering together with all enriched terms for each cluster. Finally, registered users on the system retain the ability to store, manage, and revisit previous experiments, thus maintaining a flexible and intuitive user experience.
Implementation
The implementation of DEFOG utilizes Drupal, jQuery and Cytoscape Web48,47 as an interface, an Apache web server and MySQL database system to handle the query system and JAVA for the backend calculations. The end-user requires only a modern web browser with JavaScript enabled and Adobe Flash installed to access DEFOG. All components (GeneMANIA, Transitivity Clustering, Ontologizer, and the actual DEFOG pipeline) are locally installed and are executed on our servers. Results are written to our local MySQL database. Every job is assigned a unique id that allows revisiting the results even as a guest or sharing the result-url with colleagues.
DEFOG allows users to specify several parameters to fine-tune the analyses. Although the default parameters are sufficient for most applications, it might make sense to change, for instance, the backgrounds set of genes, or restrict the analysis to PPI networks, or use a different statistic for the enrichment analysis. A complete list of options that are available can be found in Table 1.
Table 1.
List of all input parameters of DEFOG
| Option | Description | Values | Explanation |
|---|---|---|---|
| Organism | Required: The organism where the genes of interest originate |
H.sapiens | human |
| M. musculus | mouse | ||
| D. melanogaster | fly | ||
| C. elegans | worm | ||
| S. cerevisiae | yeast | ||
| A. thaliana | arabidopsis | ||
| Input genes | Required: List of genes of interest |
Accepted seperators: tab, comma, newline, semicolon, whitespace. Accepted ids: Entrez Gene, UniProt, Ensemble, RefSeq |
Text field where genes can be inserted. |
| Background genes |
List of background genes for the statistic |
see above | Optional |
| Networks | Networks that are used to create consensus network |
coexp | co-expression |
| coloc | co-localization | ||
| gi | genetic interaction | ||
| pi | protein interaction | ||
| predict | predicted interaction | ||
| spd | shared protein domains | ||
| other | all other interactions | ||
| all | include all available networks |
||
| preferred | gi, pi, coexp | ||
| default | see www.genemania.org | ||
| Combining method |
Weighting scheme to merge networks |
automatic | advanced GeneMANIA weighting scheme |
| average | all networks have the same weight |
||
| average_category | all network types (pi, gi, etc.) have the same weight |
||
| Maximal hierarchy depth |
Maximum number of levels in the hierarchy |
1-30 | |
| Minimal cluster size |
Minium size of clusters to be included in the display |
1-30 | |
| Statistic | Statistic that is applied to determine enriched categories |
Term-For-Term | Standard Fishers’s exact test |
| Parent-Child-Union | All genes that are annotated to parent are in the background |
||
| Parent-Child- Intersection |
Only genes that are annotated to every parent are in the background |
||
| Multiple hypothesis correction |
Method to adjust the p-value of the statistic to correct for false discovery due to multiple hypotheses testing |
Bonferroni | Standard multiple hypothesis corrections. |
| Bonferroni-Holm | |||
| Benjamini-Hochberg | |||
| Benjamini-Yekutieli | |||
| Wesfall-Young |
Results
Use-cases: examples of biological applications of DEFOG
In order to assess the usefulness of DEFOG as an annotation tool, two sets of genes/proteins related to human conditions were chosen as use-cases for extended analysis. For use-case #1, proteins related to Huntington’s disease were selected for analysis. Huntington’s disease (HD) is a heritable progressive neurodegenerative disease that affects hundreds of thousands of people worldwide49. The disease is caused by an autosomal dominant mutation in the Huntingtin gene (HTT), which is characterized by a polyglutamine (CAG) expansion in exon 1. The protein-protein binding partners of HTT have been a topic of intense study, not only due to their potential as targets for the treatment of HD, but also as a means to understanding the biology of the disease. Many of the proven PPI partners with HTT are curated in the Human Protein Reference Database (HPRD28). Here, we have chosen the primary interactors with HTT as use-case #1 for DEFOG, which consists of 59 proteins that have been shown to interact directly with HTT (Table 2, Fig 3).
Table 2.
Protein list for use-case #1, which consists of the primary HTT interactors as defined by the HPRD knowledgebase
| HPRD ID |
Gene Symbol |
Gene ID | UniProt Accession | Gene Name |
|---|---|---|---|---|
| 09690 | SIN3A | 25942 | Q96ST3 | SIN3A |
| 10995 | PRPF40A | 55660 | O75400,Q05C41 | PRP40 pre-mRNA processing factor 40 homolog A |
| 05936 | PACSIN1 | 29993 | Q9BY11,Q5TZC3 | Protein kinase C and casein kinase substrate in neurons 1 |
| 03461 | HIP1 | 3092 | O00291,Q8TDA4 | Huntingtin interacting protein 1 |
| 09090 | SYMPK | 8189 | Q92797 | Symplekin |
| 06712 | UTP14A | 10813 | Q9BVJ6,B4DQ08 | UTP14, U3 small nucleolar ribonucleoprotein, homolog A |
| 00579 | EGFR | 1956 | P00533 | EGF receptor |
| 01859 | TP53 | 7157 | Q53GA5,P04637,Q3LRW5 | p53 |
| 02374 | F8A1 | 8263 | P23610 | Factor VIII associated gene 1 |
| 18665 | F8A2 | 474383 | P23610 | Coagulation factor VIII-associated (intronic transcript) 2 |
| 18666 | F8A3 | 474384 | P23610 | Coagulation factor VIII-associated (intronic transcript) 3 |
| 01261 | AKT1 | 207 | P31749,B3KVH4,B0LPE5 | AKT1 |
| 01852 | TUBB | 203068 | P07437,Q5SU16 | Tubulin, beta |
| 02534 | CREBBP | 1387 | Q92793,Q4LE28 | CREBBP |
| 14382 | MED31 | 51003 | Q9Y3C7 | Mediator of RNA polymerase II transcription, subunit 31 homolog |
| 10412 | HIP1R | 9026 | B3KN98,O75146,B3KQW8 | Huntingtin interacting protein 12 |
| 00713 | GAPDH | 2597 | P04406 | Glyceraldehyde 3 phosphate dehydrogenase |
| 17212 | KIAA1377 | 57562 | Q9P2H0 | KIAA1377 protein |
| 03891 | OPTN | 10133 | Q96CV9 | Optineurin |
| 03913 | CRMP1 | 1400 | Q14194,Q4W5F1,Q96I11 | Collapsin response mediator protein 1 |
| 01796 | SP1 | 6667 | P08047 | Transcription factor Sp1 |
| 03321 | CASP6 | 839 | P55212 | Caspase 6 |
| 06577 | GIT1 | 28964 | B4DGU9,Q9Y2X7,Q59FC3 | GIT1 |
| 15333 | SH3GLB1 | 51100 | Q9Y371 | SH3 domain GRB2 like endophilin B1 |
| 02799 | CASP3 | 836 | P42574 | Caspase 3, apoptosis-related cysteine peptidase |
| 04763 | IKBKAP | 8518 | O95163,Q8N516 | IKAP |
| 01451 | PFN2 | 5217 | P35080 | Profilin 2 |
| 19386 | CXorf27 | 25763 | O75409 | Huntingtin interacting protein M |
| 06612 | GPRASP2 | 114928 | Q96D09,B3KW05 | GASP2 |
| 04015 | CTBP1 | 1487 | Q13363,Q4W5N3,Q7Z2Q5 | C-terminal binding protein 1 |
| 01994 | CBS | 875 | P35520,Q9NTF0 | Cystathionine beta synthase |
| 02511 | TBP | 6908 | P20226 | TATA box binding protein |
| 10393 | TCERG1 | 10915 | O14776 | Transcription elongation regulator 1 |
| 05142 | TRIP10 | 9322 | Q15642 | Thyroid hormone receptor interactor 10 |
| 06910 | PIAS4 | 51588 | Q8N2W9 | PIASY |
| 13724 | C15orf63 | 25764 | Q9NX55 | Huntingtin interacting protein K |
| 11797 | TAF4 | 6874 | O00268 | TBP associated factor 4 |
| 04540 | SAP30 | 8819 | O75446 | Sin3 associated polypeptide 30KD |
| 02911 | NCOR1 | 9611 | O75376 | Nuclear receptor corepressor 1 |
| 00745 | RASA1 | 5921 | P20936 | RasGAP |
| 01825 | TGM2 | 7052 | P21980 | Transglutaminase 2 |
| 01071 | XRCC6 | 2547 | P12956,B1AHC8 | Ku antigen, 70kDa |
| 08990 | REST | 5978 | Q13127 | RE1 silencing transcription factor |
| 09071 | CHD3 | 1107 | Q2TAZ1,B3KWV4,Q12873 | Chromodomain helicase DNA binding protein 3 |
| 03955 | PDK2 | 5164 | Q15119 | Pyruvate dehydrogenase kinase, isoenzyme 2 |
| 11043 | SETD2 | 29072 | Q9BYW2 | Huntingtin interacting protein 1 |
| 09212 | FEZ1 | 9638 | Q99689 | Fasciculation and elongation protein zeta 1 (zygin I) |
| 00150 | GRB2 | 2885 | P62993,B0LPF3 | Grb2 |
| 00977 | CASP1 | 834 | P29466 | Caspase 1 |
| 06256 | AP2A2 | 161 | O94973 | Adaptor related protein complex 2, alpha2 subunit |
| 04528 | SH3GL3 | 6457 | Q99963 | SH3 containing GRB2 like protein 3 |
| 11044 | PRPF40B | 25766 | Q6NWY9 | Huntingtin interacting protein C |
| 04199 | DLG4 | 1742 | P78352 | Discs, large homolog 4 |
| 12243 | MTSS1 | 9788 | O43312 | Metastasis suppressor 1 |
| 13723 | FICD | 11153 | Q9BVA6 | Huntingtin interacting protein E |
| 04165 | UBE2K | 3093 | P61086,C9JGP1 | Ubiquitin conjugating enzyme E2-25K |
| 02533 | MAP3K10 | 4294 | Q02779 | MAP3K10 |
| 08927 | TPR | 7175 | P12270,Q99968 | Translocated promoter region |
| 09697 | ZDHHC17 | 23390 | Q8IUH5 | HIP14 |
| 03554 | SUMO1 | 7341 | A8MUS8,P63165 | SMT3 suppressor of mif two 3 homolog 1 |
| 02972 | HAP1 | 9001 | P54257 | Huntingtin associated protein 1 |
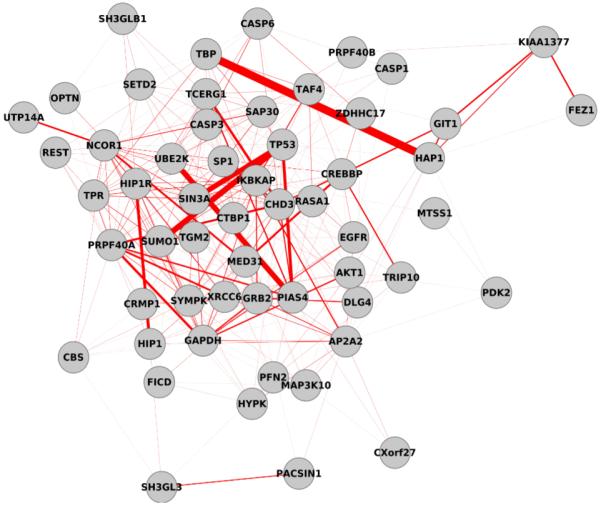
Fig 3.
GeneMANIA analysis of the genes from a cluster with 7 genes (Fig 2a:*) in use-case #1, HPRD HTT PPI. The seven genes (nodes) were represented were connected by functional similarity information (edges) from the GeneMANIA networks. Edge colors represent the following: blue – physical interactions, violet – co-expression data, magenta – co-localization, orange – predicted interactions, and green – pathways. Increasing edge thickness represents increasing similarity as defined by GeneMANIA’s normalized maximum weight.
For use-case #2, the genes contained within the GenAge24 database were chosen for extended analysis. The Human Ageing Genomics Resources (HAGR) maintains a manually curated database of genes related to aging, both from humans and model organisms. These genes have many diverse functions and are difficult to classify as a set. The aging-related human gene database contains 261 genes (Supplemental Table 1) and it was these genes that were chosen for analysis in use-case #2.
The results for each of the use cases can be interactively explored on the DEFOG website. For use-case #1, go to http://www.mooneygroup.org/defog-results?jobid=uc1, and for use-case # 2 go to http://www.mooneygroup.org/defog-results?jobid=uc2.
Huntington’s Disease Primary Interactors: Use-case #1
The proteins for use-case #1 were submitted to DEFOG as a list of UniProt IDs using the default settings for the tool. Of the 59 proteins submitted, 56 were recognized and used for analysis. The lower number of recognized genes can be explained by differences in Ids for different UniProt releases or differences in the background. DEFOG utilizes the GeneMANIA gene concept including their mapping between different identifiers. There, the background genes are obtained from Ensemble. As the mapping is a snapshot of a specific time and an input gene list might be obtained at a different time point, some genes have changes in their identifiers and can consequently not be found in our background. DEFOG clustered the proteins into 12 groups of genes in nine hierarchical levels (Fig 2a), each partitioning the genes into more specific functional groups. The first level of clustering reduced the genes into a slightly more concise single cluster followed by an even more concise cluster of similar terms, and a cluster with no enriched terms. The third level of clustering revealed a seven-protein cluster annotated with terms related to nuclear transcription factor regulation. Level four showed a small seven-protein cytoplasmic endocytosis cluster, while the two terminal clusters contained clusters made up of negative regulation of transcription and nuclear localization of gene expression clusters. In an effort to further define the functional clusters represented in use-case #1, the protein list was resubmitted to DEFOG using 20 levels of clustering, instead of the default 10. The graph of the resulting clusters (Fig 2b) shows that, while there is greater granularity in the clusters, the basic information is similar to the results as demonstrated using the DEFOG’s default settings. Thus, in this case, the increased sensitivity did not provide added information.
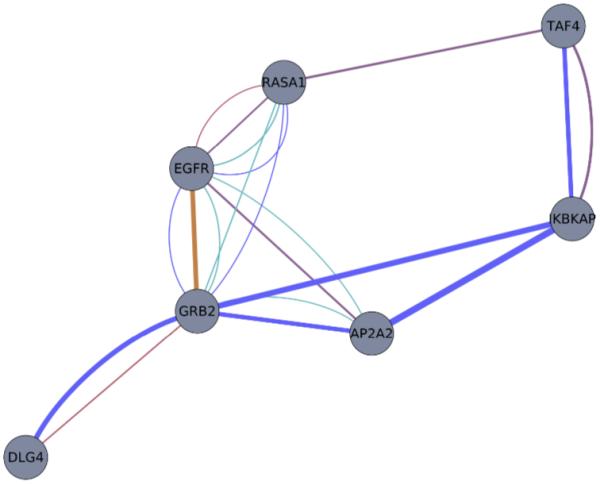
In order to understand the experimental relationships that lead to the creation of the clustering, we look at one example of a cluster with 7 genes (Fig 2a:*). The seven clustered genes of this specific submodule were more closely analyzed using GeneMANIA (specifically, we obtained the contribution of each network to the consensus network as described in the methods section) and the graph was visualized (Fig 4). All of the genes were linked by physical interactions by GeneMANIA, with the majority of the similarities coming from analyses performed on Pathway Commons50,51. In addition, there were similarities in metabolic pathways as defined by Pathway Commons – NCI Nature, which showed that RASA1, EGFR, GRB2, and AP2A2 to be physical interactors within a pathway. The proteins with the highest similarity in the network were AP2A2 and IKBKAP, and the edge type was a physical interaction.
Fig 4.
Visualization of the HTT primary interacting proteins from HPRD that were used as use-case #1 for DEFOG. Nodes are proteins, and edges are similarity as defined in the consensus network within GeneMANIA. Edge thickness represents the degree of similarity between linked nodes, such that thickness increases as similarity increases.
The DEFOG GO enrichment results for this cluster showed a number of interesting categories (Supplemental Table 2). Namely, the terms endocytic vesicle, membrane-bounded vesicle, cell-cell signalling, and signalling pathway are all terms that describe a very specific function for genes in this cluster. These data suggest that this cluster of genes is involved in intra-cellular signalling, secretion and absorption via clathrin-coated pits and the related cellular processed that are involved with that process.
Human Aging-related Genes: Use-case #2
The DEFOG results for use-case #2, the aging-related human gene set, revealed a much different set of results than in use-case #1. First, the number of clusters that DEFOG generated were far greater than those seen in use-case #1, requiring that the number of clustering levels be reduced from 10 to 5 in order to reduce the number of effective clusters for analysis. The resulting cluster graph, while much more complex than in use-case #1, was much simpler than the graph generated using DEFOG’s default settings (Fig 2c). Since the analysis of these results would be quite complex, a simple approach is taken here. The major sub-clusters occurring one level above the terminal clusters in the graph were looked at more closely in order to identify the major functional subdivisions within this dataset. The DEFOG analysis indicates that the aging genes are broken up into the following functional units: hormone-related signalling (Fig 2c:1), apoptosis (Fig 2c:2), regulation of phosphorylation (Fig 2c:3), DNA damage response (Fig 2c:4), transcription factor regulation (Fig 2c:5), nucleotide-excision repair (Fig 2c:6), transcription factor DNA-binding activity (Fig 2c:7), cholesterol regulation (Fig 2c:8), regulation of signal transduction via MAPKKK cascades (Fig 2c:9), and regulation of signal transduction via the JAK-STAT cascade (Fig 2c:10). These major functional categories correlate well with what is known about aging systems in the body and the pathways that are affected during aging52-54. Despite the disparate nature of the gene functions within the GenAge gene list, DEFOG was able to group the genes into functional categories that are both useful and informative on many levels.
Discussion
GO enrichment analyses are commonplace in today’s high-throughput genomics era. Researchers in all disciplines utilize such tools in an effort to apply broad biological meaning to complex lists of genes. Unfortunately, most of the popular enrichment tools return long lists of annotations from one or more sources of functional annotation information (ontologies, etc) leaving the researcher with a far more complicated list of terms to synthesize than the original gene list. There have been many approaches and tools implemented to try to solve this problem, but the efforts have proven to be met with limited success. GO, though useful, is still manually curated by the GO consortium and is subject both to annotation lag (too much data to keep up with) and annotation bias due to the volume of research available on any one subject55. Thus, more actively studied areas will have more annotations than lesser areas of research. Additionally, mathematical approaches alone are not enough to ascribe the proper biological meaning to a set of genes using functional annotations. Since GO (and other functional annotation databases) are based on experimental data, it follows that an initial classification of the input gene list using functional information would help classify the genes of interest. With the release of GeneMANIA, which provides this experimental functional association data in the form of networks, it becomes possible to pre-define functional groups of genes within gene lists prior to performing GO enrichment analyses. DEFOG accomplishes this by creating a consensus network from GeneMANIA’s functional association networks, followed by network-based hierarchical clustering of the resulting network. These functionally associated clusters of genes are then run through GO enrichment analyses. The result is a more concise listing of GO terms as they pertain to increasingly specific functional groups of genes.
DEFOG’s user interface is designed to allow flexible navigation of the various levels of specificity of output from the clustering/enrichment analysis. The user can browse GO categories enriched in clusters in the higher, less specific levels of the results graph, or explore the distal branches of the graph where there are fewer genes and higher specificity in the enriched GO terms. Thus, DEFOG allows the user to thoroughly explore their dataset without getting lost in large numbers of unrelated GO terms.
To illustrate the usefulness of DEFOG in biological applications, two use-case experiments were performed using existing datasets of differing nature. The first use-case consisted of a cohesive, highly-related set of proteins that are known to directly interact with the human Huntingtin (HTT) protein, as maintained by the HPRD knowledgebase. DEFOG’s analysis of this list of proteins resulted in a concise set of protein clusters that were highly functionally related and divided into increasingly specific functional groups. Despite the high degree of relatedness of the genes, the clustering technique employed in DEFOG allowed for the definition of several key biological groups associated with Huntington’s disease. The presence of mutant HTT is known to dysregulate transcription factors56-59, and thus is known to subsequently alter normal gene expression levels leading to progression of neurodegeneration60,61. Additionally, various vesicle-mediated functions are known to be altered in Huntington’s disease62-64. The DEFOG analysis clearly separated these functional associations into discernable groups in a manner that would improve the functional classification of a novel gene set of this type.
The second use-case illustrates a different perspective on the usefulness of DEFOG. In this experiment, we utilized a set of manually curated aging-related genes from the GenAge database. Aging is among the most complex and widely functionally distributed biological processes currently being researched52. As such, the GenAge gene list is equally disparate in gene function. Since many high-throughput genomic research paradigms result in large lists of functionally unrelated genes, it was posited that the GenAge database would provide a simplified real-world example of this type of data and how DEFOG can decipher the overarching functional relationships among the submitted genes.
As described in the results section (and illustrated in Fig 3c), DEFOG produced a large graph with many branches from the source gene list, thus representing the wide array of gene functions represented by GenAge. As expected, creating a functional association network from these genes using GeneMANIA followed by hierarchical clustering of the network produced clusters, which clearly defined the various functional groupings of genes listed in GenAge. As outlined in the results, 10 major functional groups could be gleaned from this gene list and these groups are all known to play major roles in the processes of aging53. The resulting graph and GO enrichment analyses could be used as a starting point for an extensive bioinformatics analysis of the GenAge gene list, leading to novel functional gene associations with regards to aging, or detection of novel laboratory targets through function prediction. A promising scenario for the utilization of DEFOG in an integrative manner could be to apply existing gene prioritization methods on each of the functional modules individually. Using the gene modules in this way would result in a more specific grouping of genes that would likely improve the performance of such prediction algorithms. In contrast, using the whole, very diverse set of genes would likely result in less accurate predictions.
With DEFOG we presented a method that organizes genes into functional modules based on data fusion of multiple biological networks. We emphasized usability and functionality in the development as reflected by the easy-to-use web-interface of DEFOG that still allows a variety of manual intervention. As with any other gene set enrichment analysis tool it is crucial to select the right input data, i.e. the choice of the input genes, the background genes and which networks should be used for clustering. Also, it is important to carefully interpret the resulting enriched GO terms for each cluster. While DEFOG presents an organization into functional related sub-modules it has its limitations and might still miscategorise genes. For example, the strict (non overlapping) clustering does not allow a gene to be present in more than one cluster per level of the hierarchy. Genes that are involved in multiple different functions thus have to be assigned to one set of other similar genes and consequently be missing connections to genes from other functions they are involved in. However, the hierarchical structure of DEFOG reduces this effect since the genes might be in the same cluster, just one level higher in the hierarchy. We further like to point out, that the clustering with subsequent GO enrichment of each cluster might result in false positive detection of enriched terms that are an artefact of the clustering. We believe, however, that the additional information a researcher gets outweighs this drawback and that DEFOG is designed as a hypothesis generation aid, which naturally requires follow up analyses.
In future releases of DEFOG we will integrate additional annotation sources aside from GO. This will extend the realm of testable hypothesis and thus improve the usability of DEFOG. We further will implement additional visualizations that allow a user to understand the biological networks that lead to the observed clustering.
Conclusions
DEFOG provides an innovative approach to the analysis of gene sets. The resulting hierarchical classification serves two important purposes. First, it identifies groups of functionally related genes within a submitted gene set and second, the hierarchical organization of tables of enriched terms allows for a visual analysis of the functional content, potentially revealing important mechanisms that would have remained undetected within a single, long list of enriched terms.
Supplementary Material
Insight, innovation, integration.
The software described in this manuscript helps to solve a common problem in high-throughput genomics and proteomics. Researchers in Integrative Biology strive to reduce the complexity of their datasets to a smaller set of biological descriptions in order to properly frame the scope of their discoveries and gain insight into the biological underpinnings of their research. Current tools for term enrichment analyses fall short of this goal. With DEFOG, we innovate upon these prior methods by organizing gene lists into functionally relevant groups prior to Gene Ontology enrichment analysis, thus reducing the dimensionality of complex datasets. The result is the integration of functional association data and biological annotations in a manner conducive to discovery and hypothesis generation.
Acknowledgements
We thank Corey Powell for helpful discussions and testing of the software. This work is supported by NIH R01 LM009722 (PI:Mooney), NIH U54-HG004028 (PI: Musen), NIH T32-AG000266 (PIs: Campisi,Ellerby), NIH UL1DE019608 supporting the Interdisciplinary Research Consortium on Geroscience (PI: Lithgow), and NIH RL9AG032114 (U54 Geroscience).
Footnotes
Published as part of an iBiology themed issue entitled “Computational Integrative Biology” Guest Editor: Prof Jan Baumbach
references
- 1.Ashburner M, Ball CA, Blake JA, Botstein D, Butler H, Cherry JM, Davis AP, Dolinski K, Dwight SS, Eppig JT, Harris MA, Hill DP, Issel-Tarver L, Kasarskis A, Lewis S, Matese JC, Richardson JE, Ringwald M, Rubin GM, Sherlock G. Nat. Genet. 2000;25:25–29. doi: 10.1038/75556. [DOI] [PMC free article] [PubMed] [Google Scholar]
- 2.Maere S, Heymans K, Kuiper M. Bioinformatics. 2005;21:3448–3449. doi: 10.1093/bioinformatics/bti551. [DOI] [PubMed] [Google Scholar]
- 3.Zheng Q, Wang XJ. Nucleic Acids Res. 2008;36:W358–63. doi: 10.1093/nar/gkn276. [DOI] [PMC free article] [PubMed] [Google Scholar]
- 4.Sealfon RSG, Hibbs MA, Huttenhower C, Myers CL, Troyanskaya OG. BMC Bioinformatics. 2006;7:443. doi: 10.1186/1471-2105-7-443. [DOI] [PMC free article] [PubMed] [Google Scholar]
- 5.Huang DW, Sherman BT, Lempicki RA. Nat Protoc. 2009;4:44–57. doi: 10.1038/nprot.2008.211. [DOI] [PubMed] [Google Scholar]
- 6.Bauer S, Grossmann S, Vingron M, Robinson PN. Bioinformatics. 2008;24:1650–1651. doi: 10.1093/bioinformatics/btn250. [DOI] [PubMed] [Google Scholar]
- 7.Cohen J. Educational and psychological measurement. 1960 [Google Scholar]
- 8.Kurki MI, Paananen J, Storvik M, Ylä-Herttuala S, Jääskeläinen JE, von Und Zu Fraunberg M, Wong G, Pehkonen P. BMC Bioinformatics. 2011;12:171. doi: 10.1186/1471-2105-12-171. [DOI] [PMC free article] [PubMed] [Google Scholar]
- 9.Bader GD, Hogue CWV. BMC Bioinformatics. 2003;4:2. doi: 10.1186/1471-2105-4-2. [DOI] [PMC free article] [PubMed] [Google Scholar]
- 10.Sharan R, Ulitsky I. Mol. Syst. Biol. 2007 doi: 10.1038/msb4100129. [DOI] [PMC free article] [PubMed] [Google Scholar]
- 11.Ben-Dor A, Shamir R, Yakhini Z. J. Comput. Biol. 1999;6:281–297. doi: 10.1089/106652799318274. [DOI] [PubMed] [Google Scholar]
- 12.Sharan R, Maron-Katz A, Shamir R. Bioinformatics. 2003;19:1787–1799. doi: 10.1093/bioinformatics/btg232. [DOI] [PubMed] [Google Scholar]
- 13.Magalhães TR, Palmer J, Tomancak P, Pollard KS. BMC Neurosci. 2007;8:59. doi: 10.1186/1471-2202-8-59. [DOI] [PMC free article] [PubMed] [Google Scholar]
- 14.van der Laan MJ. Journal of Statistical Planning and …. 2003 [Google Scholar]
- 15.Enright AJ, Van Dongen S, Ouzounis CA. Nucleic Acids Res. 2002;30:1575–1584. doi: 10.1093/nar/30.7.1575. [DOI] [PMC free article] [PubMed] [Google Scholar]
- 16.Paccanaro A, Casbon JA, Saqi MAS. Nucleic Acids Res. 2006;34:1571–1580. doi: 10.1093/nar/gkj515. [DOI] [PMC free article] [PubMed] [Google Scholar]
- 17.Wittkop T, Baumbach J, Lobo FP, Rahmann S. BMC Bioinformatics. 2007;8:396. doi: 10.1186/1471-2105-8-396. [DOI] [PMC free article] [PubMed] [Google Scholar]
- 18.Aerts S, Lambrechts D, Maity S, Van Loo P, Coessens B, De Smet F, Tranchevent LC, De Moor B, Marynen P, Hassan B, Carmeliet P, Moreau Y. Nat Biotechnol. 2006;24:537–544. doi: 10.1038/nbt1203. [DOI] [PubMed] [Google Scholar]
- 19.Mostafavi S, Ray D, Warde-Farley D, Grouios C, Morris Q. Genome Biol. 2008;9(Suppl 1):S4. doi: 10.1186/gb-2008-9-s1-s4. [DOI] [PMC free article] [PubMed] [Google Scholar]
- 20.Warde-Farley D, Donaldson SL, Comes O, Zuberi K, Badrawi R, Chao P, Franz M, Grouios C, Kazi F, Lopes CT, Maitland A, Mostafavi S, Montojo J, Shao Q, Wright G, Bader GD, Morris Q. Nucleic Acids Res. 2010;38:W214–20. doi: 10.1093/nar/gkq537. [DOI] [PMC free article] [PubMed] [Google Scholar]
- 21.Wittkop T, Emig D, Truss A, Albrecht M, Böcker S, Baumbach J. Nat Protoc. 2011;6:285–295. doi: 10.1038/nprot.2010.197. [DOI] [PubMed] [Google Scholar]
- 22.Wittkop T, Emig D, Lange S, Rahmann S, Albrecht M, Morris JH, Böcker S, Stoye J, Baumbach J. Nat. Methods. 2010;7:419–420. doi: 10.1038/nmeth0610-419. [DOI] [PubMed] [Google Scholar]
- 23.For the Louisiana Healthy Aging Study. Byerley LO, Leamy L, Tam SW, Chou C-W, Ravussin E. AGE. 2010;32:497–507. doi: 10.1007/s11357-010-9146-8. [DOI] [PMC free article] [PubMed] [Google Scholar]
- 24.de Magalhães JP, Budovsky A, Lehmann G, Costa J, Li Y, Fraifeld V, Church GM. Aging Cell. 2009;8:65–72. doi: 10.1111/j.1474-9726.2008.00442.x. [DOI] [PMC free article] [PubMed] [Google Scholar]
- 25.Barrett T, Troup DB, Wilhite SE, Ledoux P, Evangelista C, Kim IF, Tomashevsky M, Marshall KA, Phillippy KH, Sherman PM, Muertter RN, Holko M, Ayanbule O, Yefanov A, Soboleva A. Nucleic Acids Res. 2011;39:D1005–10. doi: 10.1093/nar/gkq1184. [DOI] [PMC free article] [PubMed] [Google Scholar]
- 26.Stark C, Breitkreutz B-J, Chatr-Aryamontri A, Boucher L, Oughtred R, Livstone MS, Nixon J, Van Auken K, Wang X, Shi X, Reguly T, Rust JM, Winter A, Dolinski K, Tyers M. Nucleic Acids Res. 2011;39:D698–704. doi: 10.1093/nar/gkq1116. [DOI] [PMC free article] [PubMed] [Google Scholar]
- 27.Brown KR, Jurisica I. Bioinformatics. 2005;21:2076–2082. doi: 10.1093/bioinformatics/bti273. [DOI] [PubMed] [Google Scholar]
- 28.Keshava Prasad TS, Goel R, Kandasamy K, Keerthikumar S, Kumar S, Mathivanan S, Telikicherla D, Raju R, Shafreen B, Venugopal A, Balakrishnan L, Marimuthu A, Banerjee S, Somanathan DS, Sebastian A, Rani S, Ray S, Harrys Kishore CJ, Kanth S, Ahmed M, Kashyap MK, Mohmood R, Ramachandra YL, Krishna V, Rahiman BA, Mohan S, Ranganathan P, Ramabadran S, Chaerkady R, Pandey A. Nucleic Acids Res. 2009;37:D767–72. doi: 10.1093/nar/gkn892. [DOI] [PMC free article] [PubMed] [Google Scholar]
- 29.Romero P, Wagg J, Green ML, Kaiser D, Krummenacker M, Karp PD. Genome Biol. 2005;6:R2. doi: 10.1186/gb-2004-6-1-r2. [DOI] [PMC free article] [PubMed] [Google Scholar]
- 30.Aranda B, Achuthan P, Alam-Faruque Y, Armean I, Bridge A, Derow C, Feuermann M, Ghanbarian AT, Kerrien S, Khadake J, Kerssemakers J, Leroy C, Menden M, Michaut M, Montecchi-Palazzi L, Neuhauser SN, Orchard S, Perreau V, Roechert B, van Eijk K, Hermjakob H. Nucleic Acids Res. 2010;38:D525–31. doi: 10.1093/nar/gkp878. [DOI] [PMC free article] [PubMed] [Google Scholar]
- 31.Ceol A, Chatr-Aryamontri A, Licata L, Peluso D, Briganti L, Perfetto L, Castagnoli L, Cesareni G. Nucleic Acids Res. 2010;38:D532–9. doi: 10.1093/nar/gkp983. [DOI] [PMC free article] [PubMed] [Google Scholar]
- 32.Croft D, O’Kelly G, Wu G, Haw R, Gillespie M, Matthews L, Caudy M, Garapati P, Gopinath G, Jassal B, Jupe S, Kalatskaya I, Mahajan S, May B, Ndegwa N, Schmidt E, Shamovsky V, Yung C, Birney E, Hermjakob H, D’Eustachio P, Stein L. Nucleic Acids Res. 2011;39:D691–7. doi: 10.1093/nar/gkq1018. [DOI] [PMC free article] [PubMed] [Google Scholar]
- 33.Maglott D, Ostell J, Pruitt KD, Tatusova T. Nucleic Acids Res. 2011;39:D52–7. doi: 10.1093/nar/gkq1237. [DOI] [PMC free article] [PubMed] [Google Scholar]
- 34.Flicek P, Amode MR, Barrell D, Beal K, Brent S, Chen Y, Clapham P, Coates G, Fairley S, Fitzgerald S, Gordon L, Hendrix M, Hourlier T, Johnson N, Kahari A, Keefe D, Keenan S, Kinsella R, Kokocinski F, Kulesha E, Larsson P, Longden I, McLaren W, Overduin B, Pritchard B, Riat HS, Rios D, Ritchie GRS, Ruffier M, Schuster M, Sobral D, Spudich G, Tang YA, Trevanion S, Vandrovcova J, Vilella AJ, White S, Wilder SP, Zadissa A, Zamora J, Aken BL, Birney E, Cunningham F, Dunham I, Durbin R, Fernandez-Suarez XM, Herrero J, Hubbard TJP, Parker A, Proctor G, Vogel J, Searle SMJ. Nucleic Acids Res. 2010;39:D800–D806. doi: 10.1093/nar/gkq1064. [DOI] [PMC free article] [PubMed] [Google Scholar]
- 35.Pruitt KD, Tatusova T, Klimke W, Maglott DR. Nucleic Acids Res. 2009;37:D32–6. doi: 10.1093/nar/gkn721. [DOI] [PMC free article] [PubMed] [Google Scholar]
- 36.Magrane M, Consortium U. Database (Oxford) 2011;2011:bar009. doi: 10.1093/database/bar009. [DOI] [PMC free article] [PubMed] [Google Scholar]
- 37.Loyd S. Least squares quantization. PCM, IEEE Transactions on Information Theory; 1982. [Google Scholar]
- 38.Cormack R. Journal of the Royal Statistical Society Series A (…. 1971 [Google Scholar]
- 39.Gower J. Applied statistics. 1969 [Google Scholar]
- 40.Wittkop T. Transitivity Clustering: Clustering biological data by unraveling hidden transitive substructures. Suedwestdeutscher Verlag fuer Hochschulschriften; 2010. [Google Scholar]
- 41.Wittkop T, Rahmann S, Röttger R, Böcker S, Baumbach J. Internet Mathematics. 2011 [Google Scholar]
- 42.Fisher RA. Statistical Methods for Research Workers. Oliver & Boyd; 1925. [Google Scholar]
- 43.Holm S. Scandinavian Journal of Statistics. 1979;6:6. [Google Scholar]
- 44.Benjamini Y, Hochberg Y. Journal of the Royal Statistical Society. 1995;57:12. [Google Scholar]
- 45.Benjamini Y, Yekutieli D. Genetics. 2005;171:783–790. doi: 10.1534/genetics.104.036699. [DOI] [PMC free article] [PubMed] [Google Scholar]
- 46.Westfall PH, Young SS. 1989 [Google Scholar]
- 47.Lopes CT, Franz M, Kazi F, Donaldson SL, Morris Q, Bader GD. Bioinformatics. 2010;26:2347–2348. doi: 10.1093/bioinformatics/btq430. [DOI] [PMC free article] [PubMed] [Google Scholar]
- 48.Smoot ME, Ono K, Ruscheinski J, Wang P-L, Ideker T. Bioinformatics. 2011;27:431–432. doi: 10.1093/bioinformatics/btq675. [DOI] [PMC free article] [PubMed] [Google Scholar]
- 49.Roos RAC. Orphanet J Rare Dis. 2010;5:40. doi: 10.1186/1750-1172-5-40. [DOI] [PMC free article] [PubMed] [Google Scholar]
- 50.Brehme M, Hantschel O, Colinge J, Kaupe I, Planyavsky M, Köcher T, Mechtler K, Bennett KL, Superti-Furga G. Proc Natl Acad Sci U S A. 2009;106:7414–7419. doi: 10.1073/pnas.0900653106. [DOI] [PMC free article] [PubMed] [Google Scholar]
- 51.Lambert J-P, Fillingham J, Siahbazi M, Greenblatt J, Baetz K, Figeys D. Mol. Syst. Biol. 2010;6:448. doi: 10.1038/msb.2010.104. [DOI] [PMC free article] [PubMed] [Google Scholar]
- 52.Park S-K. BMB Rep. 2011;44:291–297. doi: 10.5483/BMBRep.2011.44.5.291. [DOI] [PubMed] [Google Scholar]
- 53.Kourtis N, Tavernarakis N. EMBO J. 2011;30:2520–2531. doi: 10.1038/emboj.2011.162. [DOI] [PMC free article] [PubMed] [Google Scholar]
- 54.Shang F, Taylor A. Free Radic. Biol. Med. 2011;51:5–16. doi: 10.1016/j.freeradbiomed.2011.03.031. [DOI] [PMC free article] [PubMed] [Google Scholar]
- 55.Baumgartner WA, Cohen KB, Fox LM, Acquaah-Mensah G, Hunter L. Bioinformatics. 2007;23:i41–i48. doi: 10.1093/bioinformatics/btm229. [DOI] [PMC free article] [PubMed] [Google Scholar]
- 56.Chiang M-C, Chern Y, Juo C-G. Biochim. Biophys. Acta. 2011;1812:1111–1120. doi: 10.1016/j.bbadis.2011.05.006. [DOI] [PubMed] [Google Scholar]
- 57.Ravache M, Weber C, Mérienne K, Trottier Y. PLoS One. 2010;5:e14311. doi: 10.1371/journal.pone.0014311. [DOI] [PMC free article] [PubMed] [Google Scholar]
- 58.Jin YN, Johnson GVW. J. Bioenerg. Biomembr. 2010;42:199–205. doi: 10.1007/s10863-010-9286-7. [DOI] [PMC free article] [PubMed] [Google Scholar]
- 59.Buckley NJ, Johnson R, Zuccato C, Bithell A, Cattaneo E. Neurobiol. Dis. 2010;39:28–39. doi: 10.1016/j.nbd.2010.02.003. [DOI] [PubMed] [Google Scholar]
- 60.McFarland KN, Cha J-HJ. Handb Clin Neurol. 2011;100:25–81. doi: 10.1016/B978-0-444-52014-2.00003-3. [DOI] [PubMed] [Google Scholar]
- 61.Bithell A, Johnson R, Buckley NJ. Biochem. Soc. Trans. 2009;37:1270–1275. doi: 10.1042/BST0371270. [DOI] [PubMed] [Google Scholar]
- 62.Schweitzer JK, Krivda JP, D’Souza-Schorey C. Curr Drug Targets. 2009;10:653–665. doi: 10.2174/138945009788680437. [DOI] [PubMed] [Google Scholar]
- 63.Caviston JP, Holzbaur ELF. Trends Cell Biol. 2009;19:147–155. doi: 10.1016/j.tcb.2009.01.005. [DOI] [PMC free article] [PubMed] [Google Scholar]
- 64.Von Bartheld CS, Altick AL. Prog. Neurobiol. 2011;93:313–340. doi: 10.1016/j.pneurobio.2011.01.003. [DOI] [PMC free article] [PubMed] [Google Scholar]
Associated Data
This section collects any data citations, data availability statements, or supplementary materials included in this article.