Abstract
High levels of plasminogen activator inhibitor-1 (PAI-1), which is produced by stromal, endothelial and cancer cells and has multiple complex effects on cancers, correlate with poor cancer prognosis. To more definitively study the role of endogenously produced PAI-1 in human pancreatic adenocarcinoma (PAC) PANC-1 cell line biology, we used anti-PAI-1 shRNA to create stable PAI-1 deficient cells (PD-PANC-1s). PD-PANC-1s exhibited a heterogeneous morphology. While the majority of cells exhibited a cuboidal shape similar to the parental PANC-1 or the vector-infected control cells, numerous large cells with long filopodia and a neuronal-like appearance were observed. Although both Vector-control cells and PD-PANC-1s expressed mRNAs that are characteristic of mesenchymal, neural and epithelial phenotypes, epithelial marker RNAs were up-regulated (e.g. E-cadherin, 32-fold) whereas mesenchymal marker RNAs were down-regulated (e.g. Thy1, 9-fold) in PD-PANC-1s, suggesting mesenchymal-to-epithelial transition. Neural markers exhibited both up- and down-regulation. Immunocytochemistry indicated that epithelial-like PD-PANC-1s expressed E-cadherin and β-catenin in significantly more cells, while neural-like cells exhibited robust expression of organized β-3-tubulin. PAI-1 and E-cadherin were rarely co-expressed in the same cells. Indeed, examination of PAI-1 and E-cadherin mRNAs expression in additional cell lines yielded clear inverse correlation. Indeed, infection of Colo357 PAC cells (that exhibit high expression of E-cadherin) with PAI-1-expressing adenovirus led to a marked decrease in E-cadherin expression and to enhanced migration of cells from clusters. Our results suggest that endogenous PAI-1 suppresses expression of E-cadherin and differentiation in PAC cells in vitro, supporting its negative impact on tumor prognosis.
Keywords: Plasminogen activator inhibitor 1, E-cadherin, Differentiation, Human pancreatic adenocarcinoma
Introduction
Epidemiological evidence demonstrates a correlation between high levels of plasminogen activator inhibitor-1 (PAI-1) and poor cancer prognosis (Foekens et al. 2000; Janicke et al. 1991; Harbeck et al. 2004) and a number of reports pointed at the involvement of tumor PAI-1 expression in tumor progression and metastasis (Bajou et al. 1998; Gutierrez et al. 2000; Maillard et al. 2005; Nishioka et al. 2011). Based on these findings, many studies have been performed in attempt to understand the role(s) of PAI-1 in cancer biology (for review, see Ulisse et al. 2009). In many of these experiments, the role of PAI-1 on cancer cells was studied by administering exogenous PAI-1, since PAI-1 is known to be synthesized and secreted by stromal and endothelial cells, although it is produced by cancer cells also (Offersen et al. 2003; Lindberg et al. 2006). A role for PAI-1 produced endogenously by cancer cells, has been studied in a much more limited number of reports. Knockdown of PAI-1 in gastric cancer cells decreased the formation of metastases (Nishioka et al. 2011). PAI-1-deficient malignant keratinocytes from PAI-1(−/−) mice were used to show that both tumor-produced and host PAI-1 were involved in tumor invasion (Bajou et al. 2004). Malignant fibroblasts from PAI-1(−/−) mice exhibited altered sensitivity to chemotherapeutic agents (Lademann et al. 2005) and altered tumorigenesis (Li et al. 2005). Downregulation of PAI-1 by RNA interference has been used to show that PAI-1 is involved in the induction of “replicative senescence” by p53 in mouse embryo fibroblasts and human BJ fibroblasts (Kortlever et al. 2006) and in the signaling activity of transforming growth factor-β in human keratinocytes and mouse embryo fibroblasts (Kortlever et al. 2008; Pedroja et al. 2009).
Pancreatic adenocarcinoma, the fourth highest cause of cancer deaths, is a uniquely aggressive malignancy with no effective therapy and extremely poor prognosis (Wong and Lemoine, 2009). We reported that PANC-1 cells, an established line of human pancreatic adenocarcinoma, exhibit high PAI-1 expression that inhibits the conversion of plasminogen to plasmin and, consequently, plasmin-induced aggregation (Deshet et al. 2008). In the present report, we studied the effects of endogenous PAI-1 depletion on the biology of PANC-1 cells. Our results suggest that PAI-1 negatively controls the expression of E-cadherin and differentiation of PAC cells, supporting the epidemiological link between increased endogenous PAI-1 expression and worse prognosis.
Materials and Methods
Cell culture
PANC-1 cells were routinely cultured in DMEM, 10% fetal bovine serum (FBS), penicillin and streptomycin (50U/ml and 50µg/ml, respectively) at 37° and in 6/94% CO2/air mixture. Cells were re-fed twice each week.
Plasminogen activator inhibitor-1 deficient cells (PD-PANC-1s) or cells without insert (Vector–control cells) were generated by infection with retroviral vector containing anti-PAI-1 shRNA insert, as described previously (Deshet et al. 2008). Stably infected cultures were periodically cultured in the same medium containing 0.2mg/ml hygromycin.
Other cell lines were cultured according to the ATCC protocols.
Adenovirus infection
Colo357 cells (50–70% confluent) plated on Mat-Tek poly-d-lysine coated 35mm plates were infected at 2 to 100 MOI adenovirus in serum free media at 37° with gentle shaking every 15min for 1.5h; complete media was then added to a final serum concentration of 10%. At 2 or 5 days post infection, cells were fixed with 4% paraformaldehyde and processed for immunofluorescence staining, as described below.
Proliferation assay
Proliferation was assessed by the MTT assay in 96-wells clusters following 24, 48 and 72 h in culture. The optical density was determined by microplate Elisa reader at 570 nm.
PCR
RNA was extracted using either the EZ-RNA II kit (Biological Industries, Bet HaEmek, Israel) or, for low number of cells, the RNeasy Micro kit (Qiagen, Hilden, Germany). Reverse transcription was performed using either the Applied Biosystems High Capacity Kit (Applied Biosystems, Carlsbad, CA, USA) or, for low number of cells, the Qiagen (Hilden, Germany) Sensiscript kit, according to the manufacturers’ instructions. Real time-PCR was essentially performed according to manufacturer’s protocol (TaqMan® Gene Expression Assays – Protocol, Applied Biosystems).
Cell counting and measurments
Cells were counted either manually with hemacytometer or using Vi-Cell® (Beckman Coulter, Miami, FL, USA). Mean cell diameter was measured using Vi-Cell®.
Immunocytochemical staining
Cells were grown on Superfrost Plus glass slides (Menzel, Brunschweig, Germany). The slides were rinsed with Hank’s solution and fixed for 3h in 4% paraformaldehyde in Hank’s solution. Immunocytochemical stain was performed on the BenchMark XT (Ventana) using standard protocol (60min pretreatment with CC1, blocking with I-View Inhibitor, 40min/37° C 1st Ab and detection with SA-HRP/DAB).
Immunofluorescence staining
Cells (92,000/well) were grown overnight on Mat-Tek glass bottom (#1.5 poly-d-lysine coated) culture dishes (Mat-Tek Corp, Ashland, MA, USA). Cells were fixed overnight with 4% paraformaldehyde, washed with PBS, permeabilized with 0.1% SDS in PBS for 5min and washed with PBS. Samples were blocked with donkey serum (5%) for 30min, then incubated with primary antibodies for 1h at 37°, rinsed extensively, exposed to secondary antibodies for 1h at 37°, rinsed again and mounted with Mowiol plus DAPI, as a nuclear counterstain. Confocal micrographs were acquired on a Zeiss NLO META system using a 40x Plan-Apochromat 1.3NA objective. Detector gains remained constant for all acquisitions.
Materials
PANC-1, ML-1 and ATC238 cells were purchased from the ATCC (VA, USA). Colo357 pancreatic adenocarcinoma was a gift of Dr. Nadir Arber. MCF7 and MDA231 breast cancer cell lines were a gift of Dr. Ilan Tsarfaty. PC-3 prostatic adenocarcinoma cell line was a gift of the late Dr. Eliezer Flesher. DMEM, F12, antibiotics, Hank’s solution, and trypsin solution were purchased from Biological Industries, Beth HaEmek, Israel. Human PAI-1 (stable mutant) was purchased from Calbiochem (Merck KGaA, Darmstadt, Germany). Horseradish peroxidase-linked antiIgG was from Cell Signaling Technology (Danvers, MA, USA). Matrigel was from BD-Bioscience (Bedford, MA, USA). Anti-E-cadherin and anti-vimentin antibodies (clones EP700Y and SP20, respectively) were purchased from NeoMarkers (Fremont, CA, USA) and anti-β-catenin (clone 14) was purchased from Cell Marque (Rocklin, CA, USA). For immunofluorescence, primary mouse monoclonal to CDH1 (E-cadherin, HECD-1) antibody and antiPAI-1 antibody were purchased from Abcam (Cambridge, MA, USA) and rabbit polyclonal to Neuronal Class III β-tubulin was from BAbCO (Richmond, CA, USA). DAPI and AlexaFluor secondary antibodies F(ab’)2 fragment, 488 anti-mouse and 546 anti-rabbit were purchased from Invitrogen (Eugene, OR, USA). MTT was from Sigma (Petah Tiqva, Israel).
We gratefully acknowledge the gift of PAI-1 expressing adenovirus by Dr. Robert D. Gerard (UT Southwestern Medical Center).
All other reagents were of analytical grade.
Statistics
All experiments were performed several times in triplicates or quadruplicates. Student’s t-test was used and differences were considered significant when p≤0.05.
Results
Effects of downregulation of PAI-1 on cell morphology
We have previously shown that PANC-1 cells express PAI-1 protein (Deshet et al. 2008) and that cells stably infected with a retroviral vector expressing anti-PAI-1 shRNA (PD-PANC-1s) exhibited an approximately 70% decrease in PAI-1 protein when compared to cells infected with the empty vector (Vector-controls) (Deshet et al. 2008).
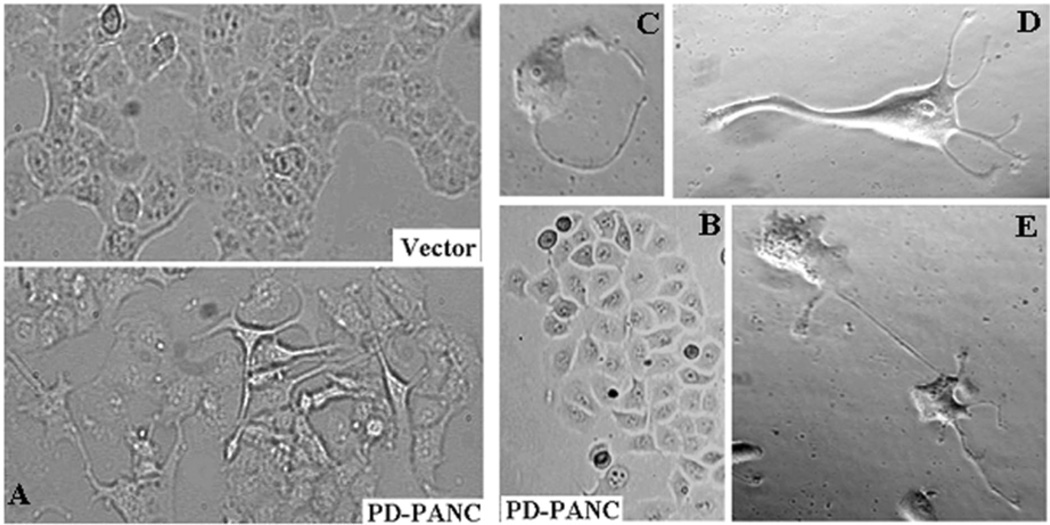
Although PD-PANC-1s proliferated at the same rate as Vector-control cells (not shown), they exhibited major changes in size and morphology (Fig. 1). The mean diameter of suspended Vector-control cells was 17.34±0.62µm whereas that of PD-PANC-1s was 19.73±0.49µm (p<0.005). Hence, PD-PANC-1 mean cell volume was 47% larger than that of Vector-controls. In monolayer culture, the predominant majority of Vector-controls were cuboidal (Fig. 1A-top); there was only a rare cell that had filopodia. In contrast, although the majority of PD-PANC-1s were cuboidal (see Figs. 1A-bottom and 1B), many cells in low-density cultures appeared much larger, exhibiting irregular shape and numerous lamellipodia and filopodia (Fig. 1A-bottom and 1C,D). The filopodia tended to connect to filopodia or bodies of neighboring cells, suggesting neural-like morphology (Fig. 1E).
Figure 1.
Morphology of PD-PANC-1s. A-Vector-controls (Left-top) or PD-PANC-1s (Left-bottom) were plated at high density. Note cells with long filopodia present in the PD-PANC-1s culture that are not present in Vector-controls (X4 objective). B- PD-PANC-1 culture displaying epithelial cuboidal morphology (X4 objective). C-E-micrographs (X20 phase objective) of low density plated PD-PANC-1s showing large individual cells with filopodia.
PAI-1 has been implicated in direct and indirect interactions of integrins with vitronectin. Lower PAI-1 expression and secretion could have, thus, affected the gross morphology by changing the cells’ attachment to the surface. However, addition of PAI-1 to the medium (0.03–3µg/ml) had no effect on PD-PANC-1s’ morphology (not shown).
Effects of downregulation of PAI-1 on differentiation state
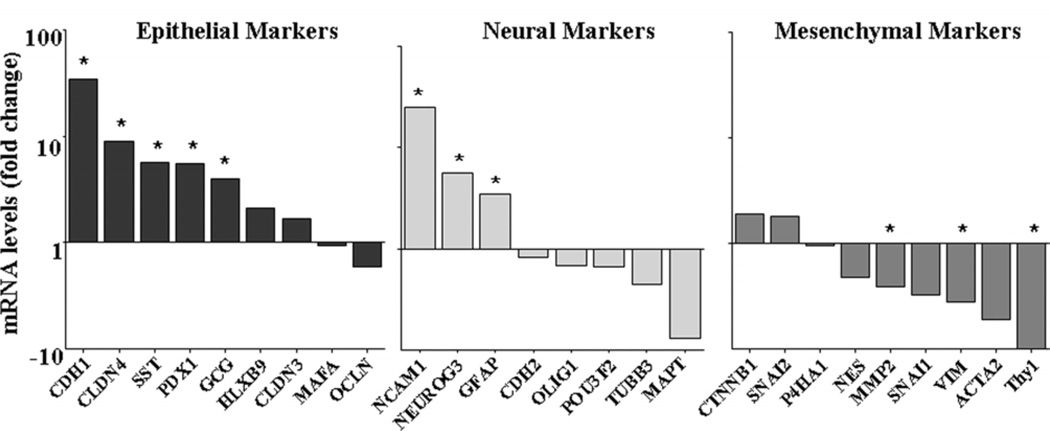
As seen in Figure 1, PD-PANC-1s in monolayer culture included a population of cells that exhibited characteristics of neural cells that were not present, or present in very low abundance, in Vector-control cultures. We, therefore, considered the possibility that the heterogeneity in the PD-PANC-1 population may be caused by differentiation along different cell lineages. We measured a number of mRNAs that characterized mesenchymal (SNAI1, SNAI2, THY1, CTNNB1, ACTA2, VIM, NES, P4HA1 and MMP2), epithelial (CDH1, PDX1, HLXB9, PTF1A, MAFA, CLDN3, CLDN4, OCLN, PNLIP, CPA1, INS, GCG and SST) and neural (NCAM1, CDH2, NEUROG3, POU3F2, OLIG1, MAPT, GFAP and TUBB3) cell types. Five epithelial marker mRNAs, CDH1, PDX1, HLXB9, CLDN4 and SST, and three neural marker mRNAs, NCAM1, NEUROG3 and GFAP, were expressed at higher levels in PD-PANC-1s than in Vector-controls, whereas four mesenchymal marker mRNAs, THY1, VIM, NES and MMP2, were expressed at lower levels in PD-PANC-1s than in Vector-controls (see Table 1 and Fig. 2). It is noteworthy that the levels of CDH1 and NCAM1 mRNAs were 34- and 25-fold higher, respectively, and THY1 mRNA was 9-fold lower in PD-PANC-1s than in Vector-controls. These findings were consistent with the idea that PD-PANC-1s were more epithelial or neural and less mesenchymal than Vector-controls.
Table 1.
mRNA levels (real time quantitative PCR cycle threshold) of marker genes in Vector-controls and PD-PANC-1s. The values are averages of duplicate biological samples
| Epithelial | Neural | Mesenchymal | ||||||
|---|---|---|---|---|---|---|---|---|
| Vector | PD-PANC1 | Vector | PD- PANC1 |
Vector | PD- PANC1 |
|||
| CDH1 | 26.7 | 21.6 | NCAM1 | 37.8 | 33.1 | CTNNB1 | 20.3 | 19.4 |
| CLDN4 | 23.8 | 20.6 | NEUROG3 | 38.5 | 36.0 | SNAI2 | 31.1 | 30.2 |
| SST | 38.0 | 35.5 | GFAP | 34.4 | 32.6 | P4HA1 | 22.9 | 23.0 |
| PDX1 | 29.2 | 26.7 | CDH2 | 22.9 | 23.2 | NES | 20.0 | 21.1 |
| GCG | 37.3 | 35.3 | OLIG1 | 35.4 | 36.0 | MMP2 | 22.5 | 23.8 |
| HLXB9 | 29.4 | 28.3 | POU3F2 | 31.5 | 32.1 | SNAI1 | 24.3 | 26.0 |
| CLDN3 | 25.9 | 25.2 | TUBB3 | 30.6 | 31.8 | VIM | 12.8 | 14.7 |
| MAFA | 30.9 | 31.0 | MAPT | 24.2 | 27.2 | ACTA2 | 25.2 | 27.6 |
| OCLN | 22.2 | 22.9 | THY1 | 23.0 | 26.4 | |||
Figure 2.
Expression of epithelial, neural and mesenchymal marker mRNAs in PD-PANC-1s compared to Vector-controls. Cells were grown in DMEM with 10% FBS. RNA was extracted and the levels of mRNAs were measured by RT-qPCR. The official gene symbol for each mRNA is listed. The genes with measurable levels of mRNAs are illustrated. The following mRNAs were below the level of detectability – PTF1A, PNLIP, INS and CPA1. The data are the mean of duplicate determinations. * - p<0.05.
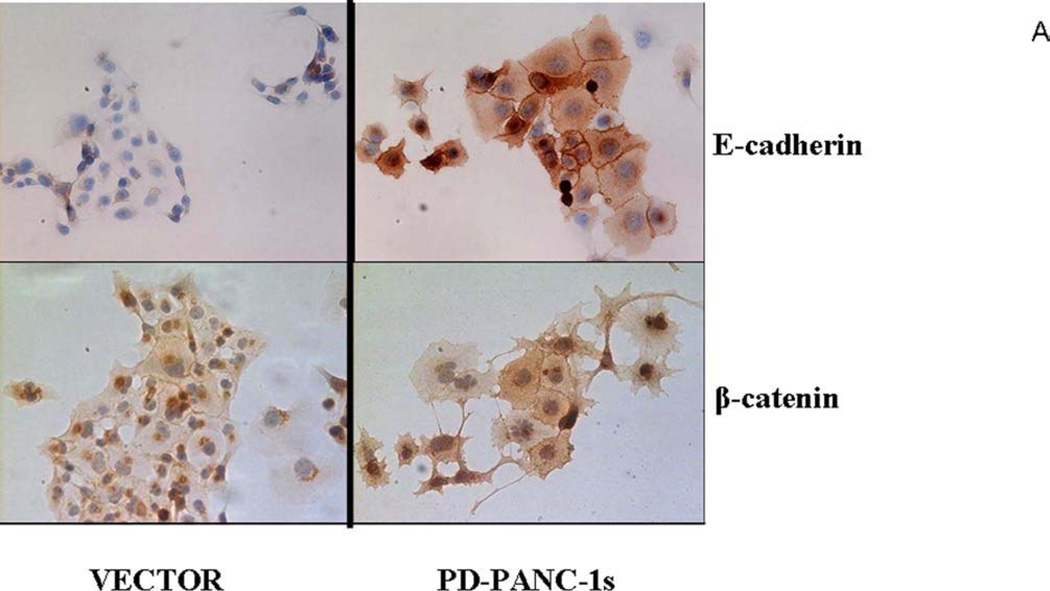
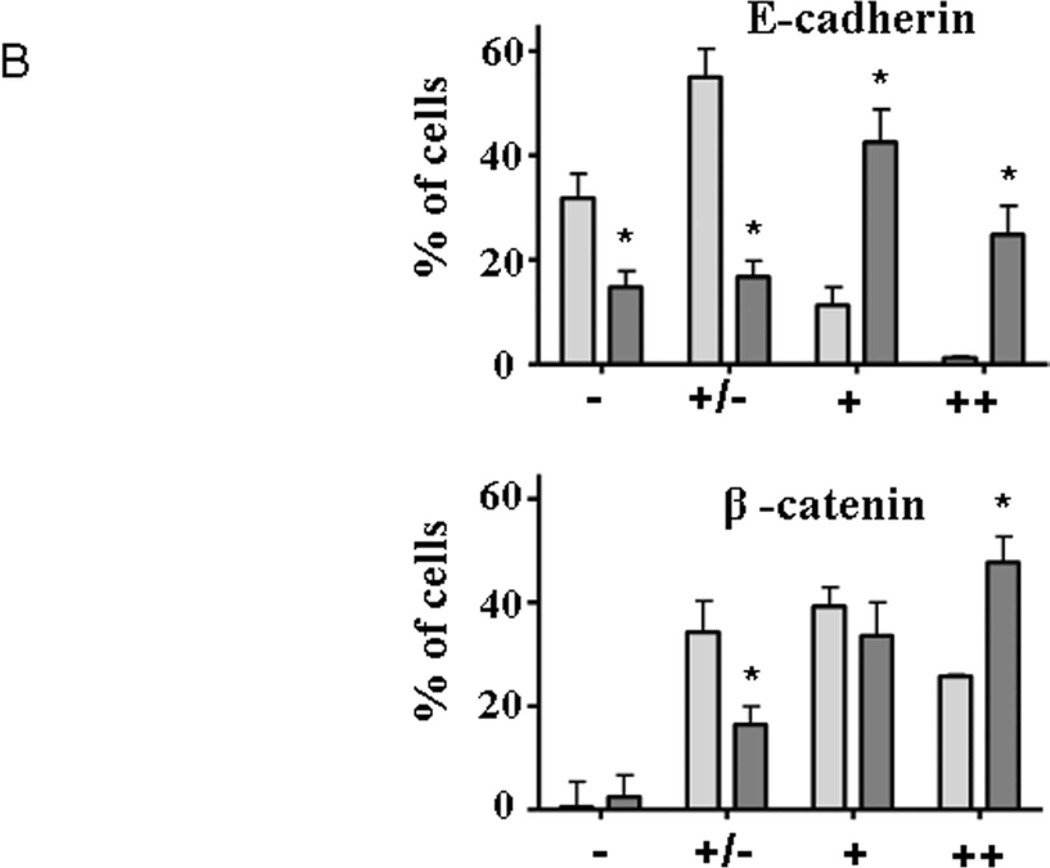
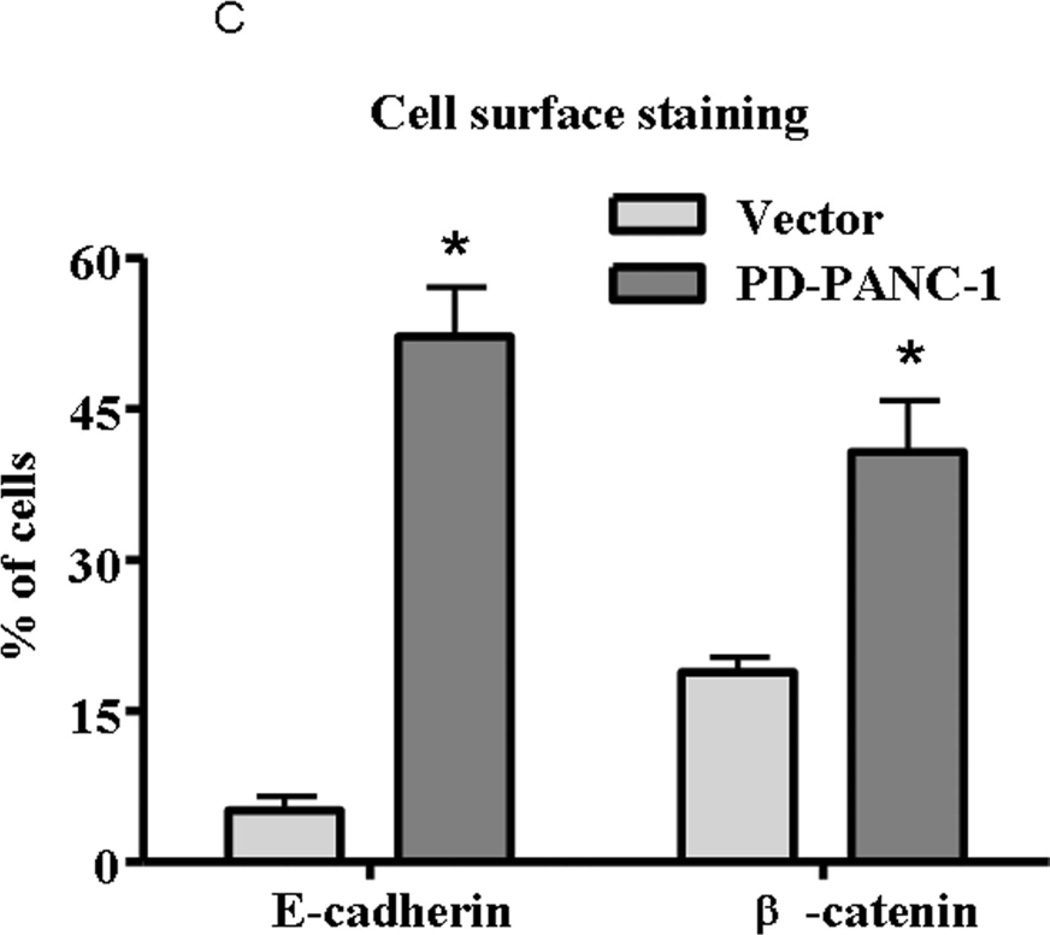
To confirm that PD-PANC-1s exhibited a more epithelial phenotype than Vector-controls, we monitored the expression and localization of E-cadherin and β-catenin proteins by immunocytochemistry (Fig. 3A). E-cadherin was expressed at intermediate levels in approximately 10% of Vector-controls (Fig. 3A,B) and fewer than 6% of the cells exhibited staining at cellular perimeter, i.e. likely to be associated with plasma membrane (Fig. 3C). In contrast, a majority of the PD-PANC-1s strongly stained for E-cadherin. In more than half of the E-cadherin expressing cells, the protein was associated with the cell perimeter, delineating intercellular interfaces. In both Vector-control and PD-PANC-1 cultures, some small cells exhibited very dense staining throughout the cytoplasm.
Figure 3.
Expression of E-cadherin and β-catenin in PD-PANC-1 cells compared to Vector-controls.
A-Immunocytochemical staining of E-cadherin, and β-catenin in Vector-controls and PD-PANC-1s growing in monolayer was performed as described in Materials and Methods.
B-Statistics of immunopositive cells. Light grey bars – Vector-control cells; dark grey bars – PD-PANC-1 cells. Arbitrary degree of staining: (-) – none; (±) – weak; (+) – significant; (++) – strong. Statistics were performed on 10–15 random fields at X30 magnification comprising 165–258 cells.
C-Quantitation of cells expressing cell perimeter-associated staining of E-cadherin and β-catenin. The data are the mean±SE of 165–258 cells.
Staining for β-catenin revealed a pattern qualitatively similar to that of E-cadherin (Fig. 3). PD-PANC-1 cultures exhibited more strongly staining cells and more cells exhibiting cellular perimeter β-catenin than Vector-controls (Fig. 3C). Although PD-PANC-1s expressed four-fold less vimentin mRNA, the majority of both Vector-controls and PD-PANC-1s stained for vimentin at the same intensity (not shown).
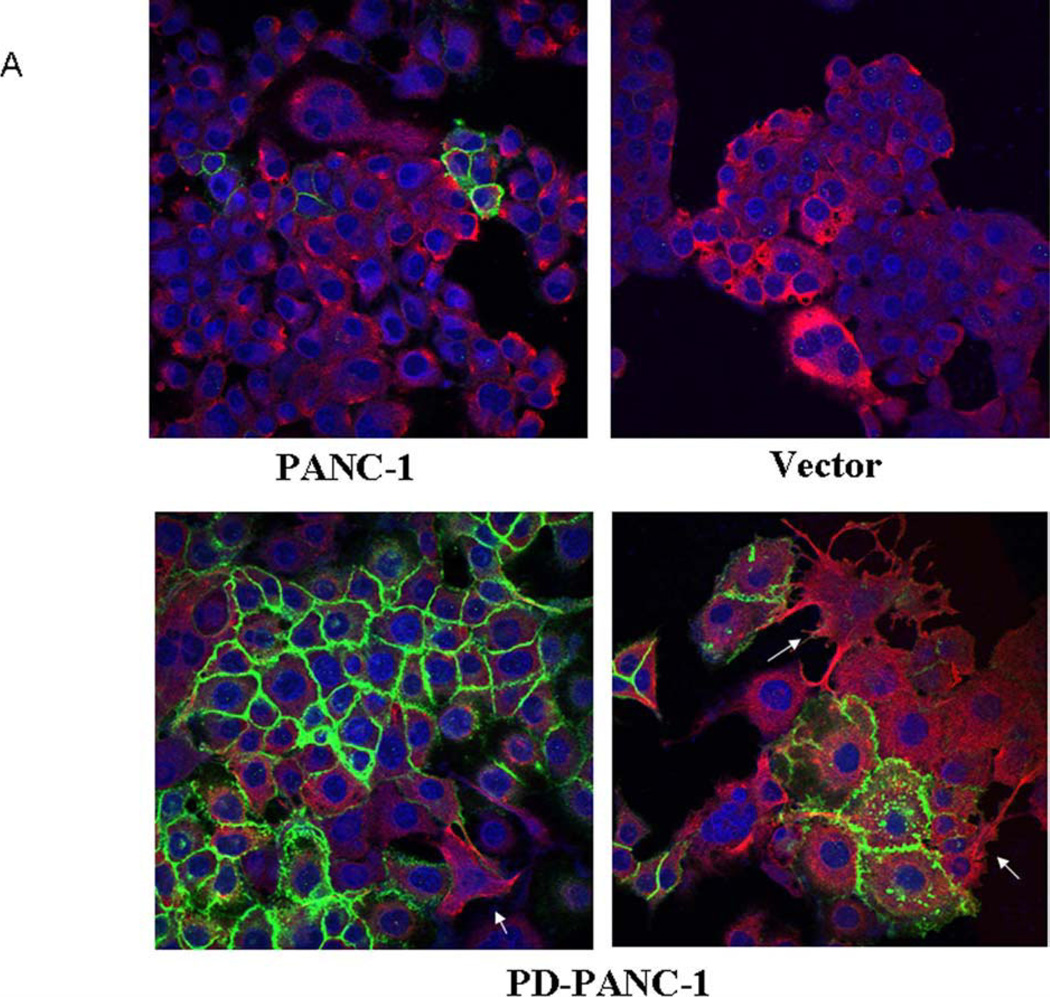
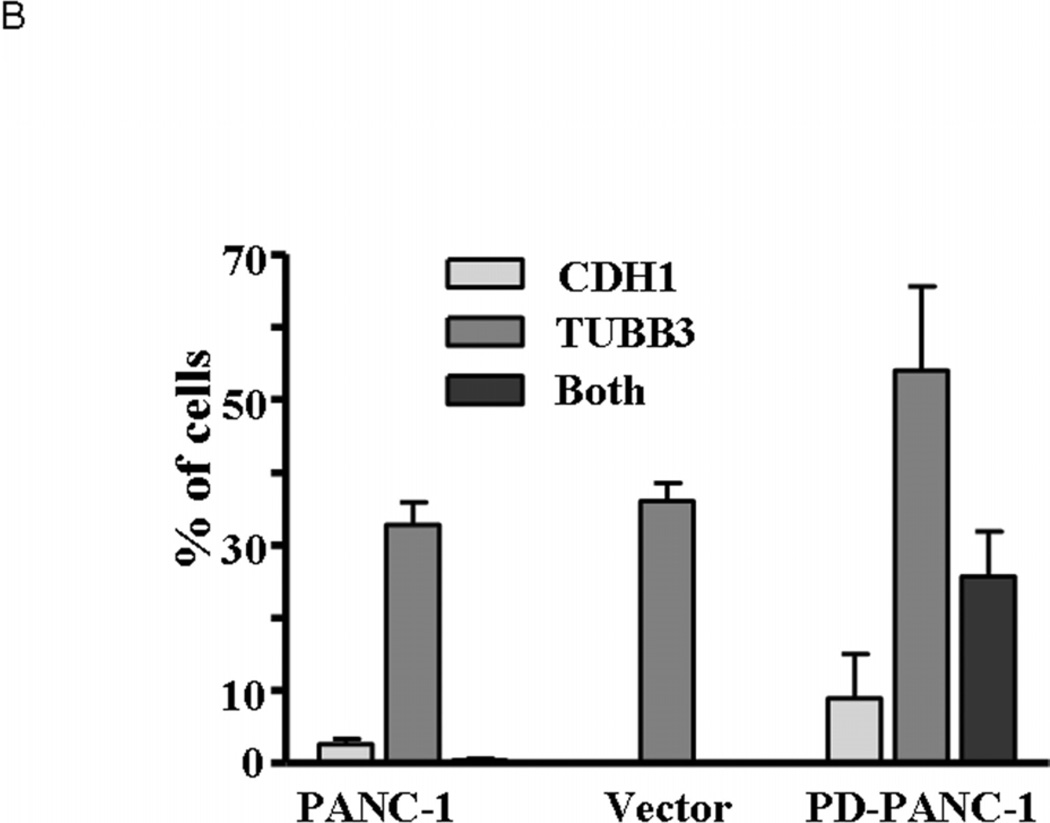
Having found that PD-PANC-1s expressed the epithelial marker E-cadherin at high levels and with appropriate cell surface distribution, we used immunofluorescence microscopy to determine whether the neural proteins β-3-tubulin (TUBB3) and glial fibrillary acidic protein (GFAP) were expressed also. Immunofluorescence microscopy confirmed that E-cadherin was expressed at high levels in 35% of PD-PANC-1s but was not expressed in Vector-controls and in only 3% of uninfected PANC-1 cells (Fig. 4A). GFAP protein was present diffusely in the cytoplasm of many cells in all three cultures (not shown). TUBB3 staining was diffuse in the cytoplasm of 80% of PD-PANC-1s and in approximately 35% of PANC-1 cells and Vector-controls. Approximately 25% of PD-PANC-1s expressed both markers (Fig. 4B).
Figure 4.
Expression of E-cadherin and beta-3-tubulin in PANC-1 cells, Vector-control cells and PD-PANC-1s.
A- Immunocytochemical fluorescence staining was performed on cells growing in monolayer as described in Materials and Methods. For PD-PANC-1s, a field demonstrating a large number of cell membrane-associated E-cadherin (green) or neural-like cells expressing dense filamentous TUBB3 (red) is shown.
B- Quantitation of cells expressing E-cadherin and beta 3 tubulin. The data are the mean±SE of 488 PANC-1 cells, 516 Vector-control cells and 363 PD-PANC-1s.
Although the staining for TUBB3 was generally less intense in most of the PD-PANC-1 cells, in a minor population of large cells with filopodia (exclusively observed in PD-PANC-1 cultures), TUBB3 staining was prominent and similar to that found in neural cells (Fig. 4A, see arrows).
Thus, it appears that PD-PANC-1 cultures were much less homogeneous than either PANC-1s or Vector-controls, comprised of individual cells expressing higher levels of epithelial, neural, or both marker proteins. Since PD-PANC-1s also exhibited decreased expression of mesenchymal markers, the culture appears to represent significant sub-populations of cells partially differentiated along the epithelial or neural lineage. These results, coupled with the marked increase in E-cadherin protein in PD-PANC-1s, suggested that decreased PAI-1 expression may correlate with increased expression of E-cadherin.
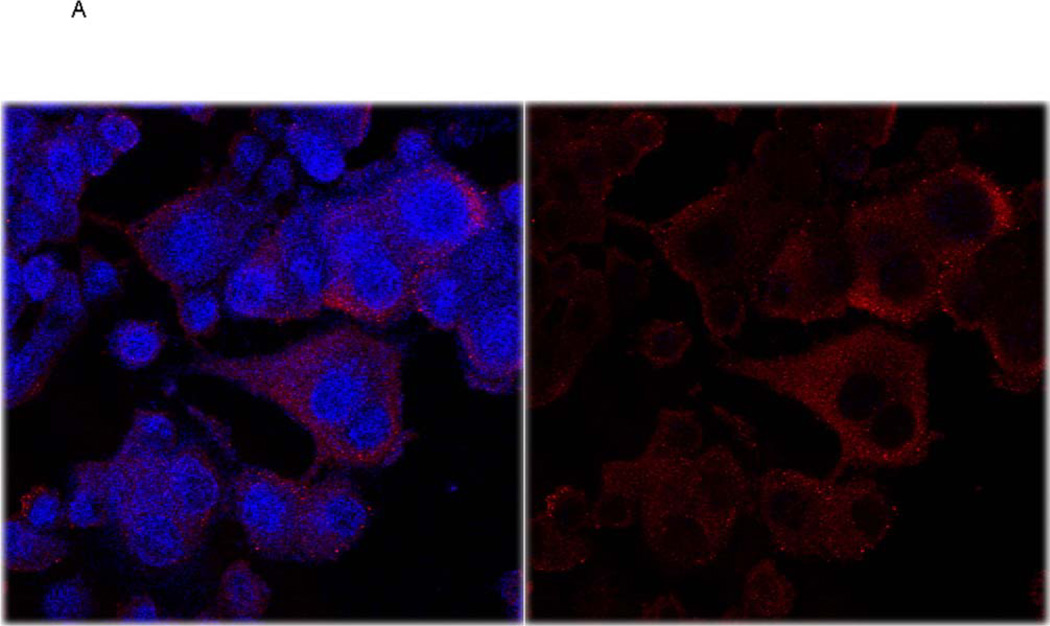
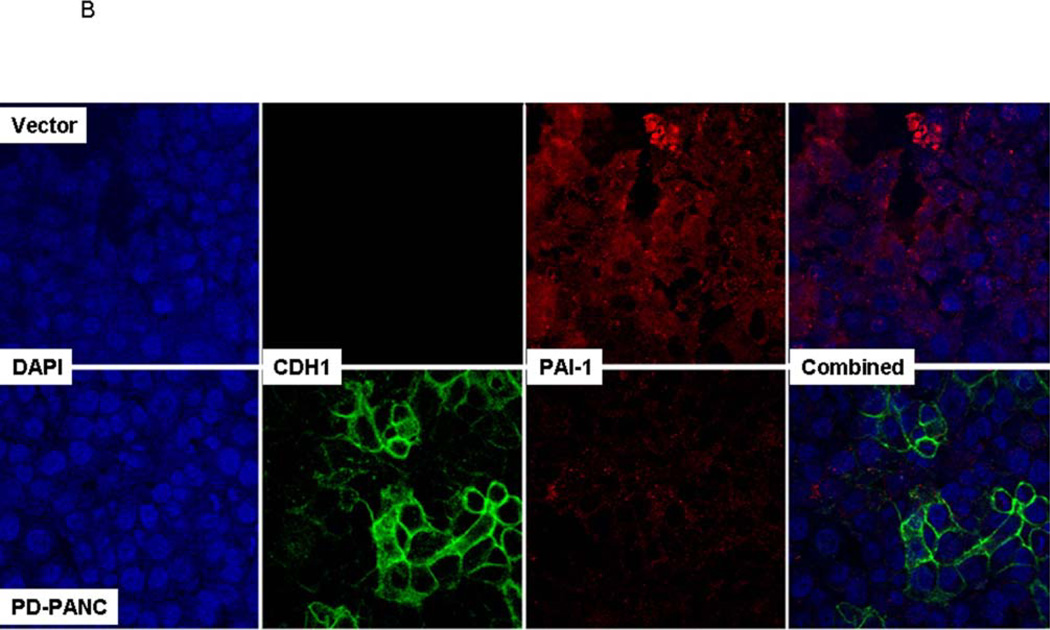
Immunostaining for PAI-1 revealed cytoplasmic distribution, including pseudopodia, with numerous punctate foci (Fig. 5A). No clear association with plasma membrane was observed. Although precise quantitation was difficult, the staining was weaker in PD-PANC-1s (Fig. 5B).
Figure 5.
A. Vector-control cells were fixed and double stained for E-cadherin and PAI-1 and counterstained with DAPI for nuclei, as described in Methods. Since very few Vector-infected cells expressed E-cadherin, the E-cadherin channel (green) was omitted. Left panel – overlay of PAI-1 and DAPI stain, right panel – PAI-1 staining alone.
B. Vector-control and PD-PANC-1 cells were fixed and double stained for Ecadherin and PAI-1 and counterstained with DAPI for nuclei, as described in Methods.
To determine the relationship between the expression of PAI-1 and E-cadherin, we doubly stained Vector and PD-PANC-1s for both markers (Fig. 5B). In PD-PANC-1s E-cadherin was expressed in 24%, but co-expressed with PAI-1 in only 4.6% of the cells, confirming our observation that PAI-knockdown resulted in a dramatic increase in E-cadherin.
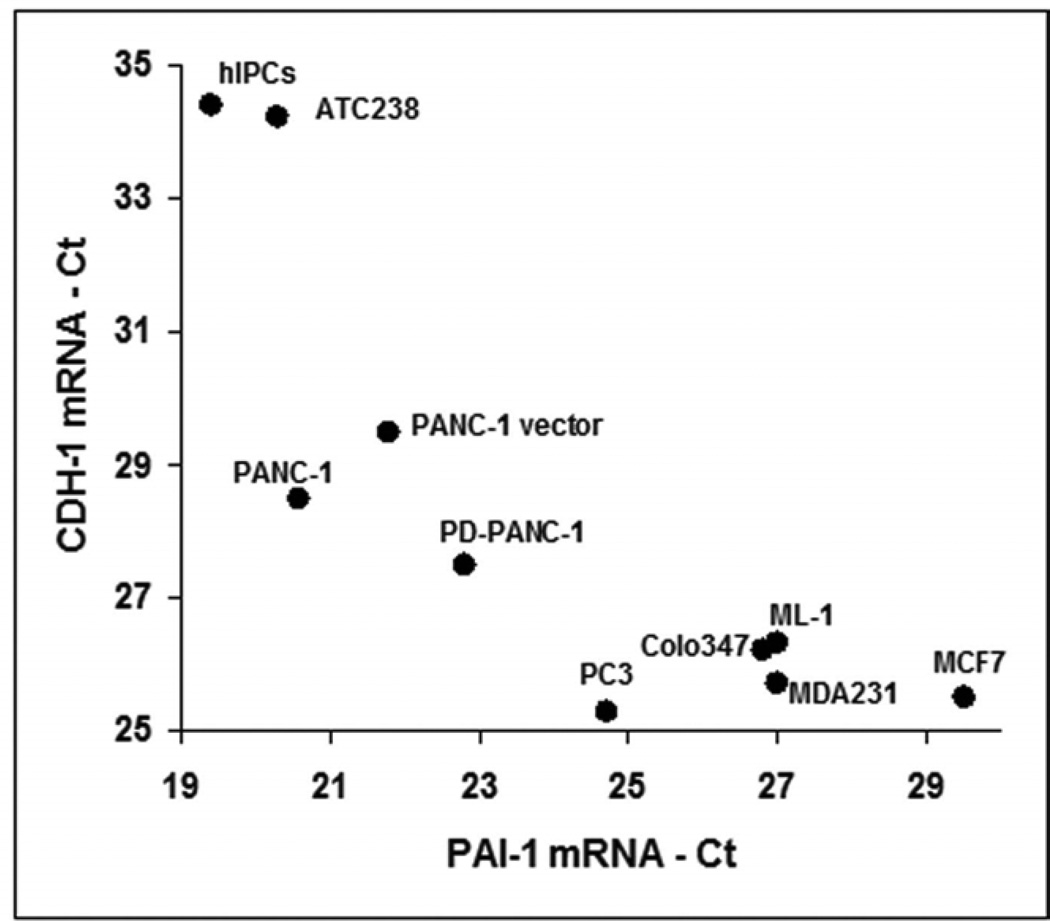
To further study the relationship between the expression of PAI-1 and E-cadherin, we examined the expression of their mRNAs in several cell lines; pancreatic adenocarcinoma Colo357, breast carcinomas MCF-7 and MDA-231, prostatic carcinoma PC-3, thyroid carcinomas ATC238 and ML-1, human islet-derived pancreatic precursor cells (hIPCs, Gershengorn et al., 2004), as well as control, vector infected-PANC-1 and PD-PANC-1s. Indeed, a clear inverse relationship between the expression of E-cadherin and that of PAI-1 was observed (Fig. 6).
Figure 6.
The cultures of the indicated cell lines were processed for RNA extraction, cDNA reverse transcription and qPCR for E-cadherin (CDH1) and PAI-1 mRNA levels as described in Methods. The results were normalized to Ct=18 of GAPDH.
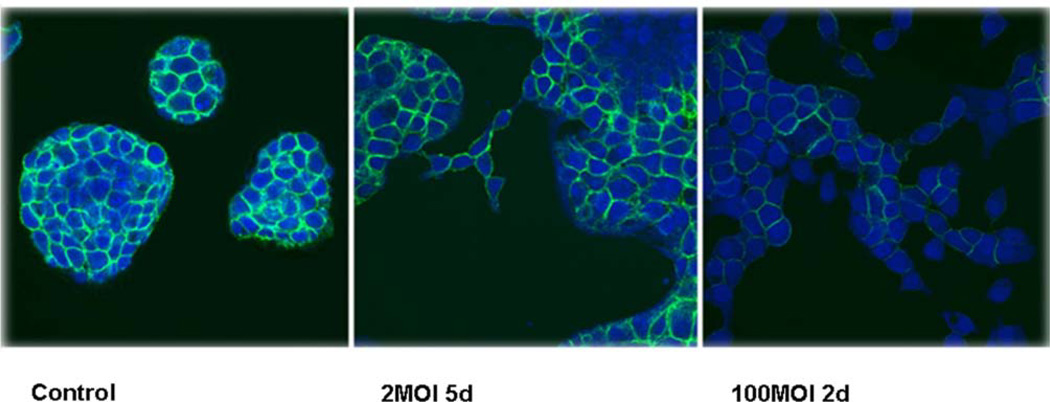
Our data suggested that the expression of PAI-1 suppresses the expression of E-cadherin. To test this hypothesis directly, we infected Colo357 cultures, a human PAC cell line which expresses high levels of E-cadherin and forms tight spherical colonies (Fig. 7, Control) , with an adenovirus construct in which PAI-1 gene was constitutively driven by a CMV promoter. Indeed, Colo357 infection with low virus levels (2MOI, 5 days post-infection) resulted in a decrease in the level of expression of E-cadherin and a disruption of the colonies architecture, suggesting that cells migrate out of the spherical colonies. High viral levels (100MOI, 2 days), resulted in a more pronounced decrease in the expression of E-cadherin and a more dramatic change in the colonies morphology (Fig. 7).
Figure 7.
Colo357 cells were cultured in DMEM and infected with PAI-1-containing adenovirus at different MOI. The cells were fixed and stained for E-cadherin as described in Material and Methods. Control cells were infected with empty adenovirus, which had no effect on the expression of E-cadherin or on colonies morphology. The control in the figure was infected with 10MOI of empty adenovirus for 5 days.
Discussion
Epidemiological evidence indicates that high expression of PAI-1 in many cancers correlates with poor prognosis (Binder and Mihaly, 2008). This finding challenges the simple logic of PAI-1’s primary function – to inhibit the conversion of plasminogen to plasmin (also slowing the plasmin activation of pro-uPA to uPA). Indeed, we previously demonstrated that PD-PANC-1s convert plasminogen to plasmin more rapidly than control (Vector-infected) PANC-1 cells and, consequently, are more sensitive to plasminogen-induced aggregation (Deshet et al. 2008). Plasmin activates matrix metalloproteinases and promotes proteolysis of extracellular matrix, cellular migration and invasion (see Danø et al. 2005, for review), contributing to the aggressiveness of tumor cells. However, PAI-1 appears to be involved in a number of additional important processes, such as direct competition of binding of integrins to vitronectin (Stefansson et al. 1996) and indirect internalization of the uPAR-uPA-integrin-PAI-1 complex (Nykjaer et al. 1997; Czekay et al. 2001). These aspects of PAI-1 activity are often invoked to explain the epidemiological data. The present report was designed to test the in vitro effect of PAI-1 depletion in cells of an aggressive human pancreatic tumor.
In the present report we demonstrate that depletion of endogenous PAI-1 affects the biology of PANC-1 cells in a way that cannot be directly attributed to its previously described functions, including changes in expression of epithelial, neural and mesenchymal markers.
The morphology of PD-PANC-1s changed dramatically. Some cells appeared much larger and/or with numerous filopodia and lamellipodia. PD-PANC-1s, when compared with Vector-control cells, exhibited higher expression of a number of mRNAs for genes that are considered markers of epithelial cells (CDH1, CLDN4, SST, PDX1,GCG and HLXB9) and lowers levels of mRNAs for several genes that are markers of mesenchymal cells (THY1, ACTA2, VIM). It is noteworthy that PANC-1s expressed much more cell membrane-associated E-cadherin than the Vector-control and parental PANC-1 cells. Increased expression of E-cadherin is generally perceived as a hallmark of more differentiated epithelial phenotype (Schmalhofer et al. 2009). Indeed, PD-PANC-1s expressed more cell membrane-associated β-catenin, which is consistent with a more epithelial phenotype also. These changes can be considered as changes of precursor or stem cells when they undergo a transition from a mesenchymal to an epithelial phenotype (Yang et al. 2008). Indeed, we showed previously that PANC-1 cells can undergo mesenchymal-to-epithelial transition (Gershengorn et al. 2004).
Several markers of a neural phenotype were appreciably expressed in Vector-control cells (CDH2, POU3F2, TUBB3, MAPT). Indeed, TUBB3 and GFAP proteins were also detected in uninfected PANC-1 cells. This is not surprising since it is known that pancreatic epithelial/endocrine cells have characteristics of neural cells and express genes that are expressed most highly in neural cells (van Arensbergen et al. 2010). PD-PANC-1s expressed both higher (NCAM1, NEUROG3 and GFAP) and lower (MAPT and TUBB3) levels of mRNA coding for neural marker genes. Unexpectedly, immunofluorescent staining revealed that the proportion of TUBB3-positive cells increased from 30–35% in uninfected and Vector-control cells to over 50% in PD-PANC-1s. The intensity of staining, however, was much less in most of the cells (consistent with the decrease observed in TUBB3 mRNA expression), but in a minority of cells that also displayed neural morphology, strong staining was seen. These cells also did not stain for cell surface E-cadherin. Hence, depletion of endogenous PAI-1 resulted in a shift of PANC-1 cells’ phenotype from mesenchymal towards differentiated, mostly epithelial, but also neural.
Our results do support the epidemiological data. Decreased expression of PAI-1 in PD-PANC-1 cells promotes more differentiated phenotype and expression of differentiation markers. Moreover, many of the data relevant to PAI-1 expression fail to differentiate between PAI-1 expressed in the cancer cell proper, as opposed to that expressed by the stroma or invading cells of the immune/inflammatory response. Here we demonstrate the importance of PAI-1 expressed by tumor cells alone.
There are few reports describing PAI-1 localization in cultured cells. In our hands, immunofluorescent staining for PAI-1 in Vector-control cells revealed diffuse cytoplasmic localization with punctuate foci, suggesting PAI-1 association with cytoplasmic vesicles, possibly involved in PAI-1 internalization. Indeed,Balsara et al. (2011) andYang et al. (2007) reported similar PAI-1 staining in endothelial cells. Although PAI-1 staining was less intense in PD-PANCs, it still allowed visualization of both PAI-1 and E-cadherin in individual cells. Only a negligible proportion of cells expressed both proteins.
Our results, including the scarcity of individual PD-PANC-1 cells staining for both PAI-1 and E-cadherin, implied that PAI-1 and E-cadherin expression is inversely regulated. We therefore examined several cancer cell lines, in which the inverse relationship between PAI-1 and E-cadherin mRNAs expression was clearly apparent. Conversely, forcing increased expression of PAI-1 in Colo357 PAC cells markedly decreased the expression of endogenous E-cadherin and changed the morphology of Colo357 colonies from tightly spherical to more dispersed, consistent with decreased inter-cellular adhesion and increased migration.
In conclusion, PAI-1 knockdown in PANC-1 cells produces heterogeneous population, mostly more differentiated along the E-cadherin-expressing epithelial and TUBB3-expressing neural lineages. Our results suggest that PAI-1 expression may control the expression of E-cadherin and, possibly, other markers of differentiation, thus controlling the phenotype of pancreatic tumor cells.
Acknowledgments
YO is the incumbent of Andy Lebach Chair of Clinical Pharmacology and Toxicology at Tel Aviv University. This publication is a partial fulfillment of the PhD thesis of LS at the Tel Aviv University. We gratefully acknowledge the technical help of Dr. Ingrid Espinoza.
REFERENCES
- Bajou K, Maillard C, Jost M, Lijnen RH, Gils A, Declerck P, Carmeliet P, Foidart JM, Noel A. Host-derived plasminogen activator inhibitor-1 (PAI-1) concentration is critical for in vivo tumoral angiogenesis and growth. Oncogene. 2004;23:6986–6990. doi: 10.1038/sj.onc.1207859. [DOI] [PubMed] [Google Scholar]
- Bajou K, Noel A, Gerard RD, Masson V, Brunner N, Holst-Hansen C, Skobe M, Fusenig NE, Carmeliet P, Collen D, Foidart JM. Absence of host plasminogen activator inhibitor 1 prevents cancer invasion and vascularization. Nat Med. 1998;4:923–928. doi: 10.1038/nm0898-923. [DOI] [PubMed] [Google Scholar]
- Balsara RD, Merryman R, Virjee F, Northway C, Castellino FJ, Victoria A Ploplis A deficiency of uPAR alters endothelial angiogenic function and cell morphology. Vasc Cell. 2011;3:10–26. doi: 10.1186/2045-824X-3-10. [DOI] [PMC free article] [PubMed] [Google Scholar]
- Binder BR, Mihaly J. The plasminogen activator inhibitor "paradox" in cancer. Immun Lett. 2008;118:116–124. doi: 10.1016/j.imlet.2008.03.017. [DOI] [PubMed] [Google Scholar]
- Czekay RP, Kuemmel TA, Orlando RA, Farquhar MG. Direct binding of occupied urokinase receptor (uPAR) to LDL receptor-related protein is required for endocytosis of uPAR and regulation of cell surface urokinase activity. Mol Biol Cell. 2001;12:1467–1479. doi: 10.1091/mbc.12.5.1467. [DOI] [PMC free article] [PubMed] [Google Scholar]
- DanØ K, Behrendt N, Høyer-Hansen G, Johnsen M, Lund LR, Ploug M, Roemer J. Plasminogen activation and cancer. Thromb Haemost. 2005;93:676–681. doi: 10.1160/TH05-01-0054. [DOI] [PubMed] [Google Scholar]
- Deshet N, Lupu-Meiri M, Espinoza I, Fili O, Shapira Y, Lupu R, Gershengorn MC, Oron Y. Plasminogen-induced aggregation of PANC-1 cells requires conversion to plasmin and is inhibited by endogenous plasminogen activator inhibitor-1. J Cell Physiol. 2008;216:632–639. doi: 10.1002/jcp.21441. [DOI] [PubMed] [Google Scholar]
- Foekens JA, Peters HA, Look MP, Portengen H, Schmitt M, Kramer MD, Brunner N, Janicke F, Meijer-van Gelder ME, Henzen-Logmans SC, van Putten WLJ, Klijn JGM. The urokinase system of plasminogen activation and prognosis in 2780 breast cancer patients. Cancer Res. 2000;60:636–643. [PubMed] [Google Scholar]
- Gershengorn MC, Hardikar AA, Wei C, Geras-Raaka E, Marcus-Samuels B, Raaka BM. Epithelial-to-mesenchymal transition generates proliferative human islet precursor cells. Science. 2004;306:2261–2264. doi: 10.1126/science.1101968. [DOI] [PubMed] [Google Scholar]
- Gutierrez LS, Schulman A, Brito-Robinson T, Noria F, Ploplis VA, Castellino FJ. Tumor development is retarded in mice lacking the gene for urokinase-type plasminogen activator or its inhibitor, plasminogen activator inhibitor-1. Cancer Res. 2000;60:5839–5847. [PubMed] [Google Scholar]
- Harbeck N, Kates RE, Gauger K, Willems A, Kiechle M, Magdolen V, Schmitt M. Urokinase-type plasminogen activator (uPA) and its inhibitor PAI-1: novel tumor-derived factors with a high prognostic and predictive impact in breast cancer. Thromb Haemost. 2004;91:450–456. doi: 10.1160/TH03-12-0798. [DOI] [PubMed] [Google Scholar]
- Janicke F, Schmitt M, Graeff H. Clinical relevance of the urokinase-type and tissue type plasminogen activators and of their type 1 inhibitor in breast cancer. Semin Thromb Hemost. 1991;17:303–312. doi: 10.1055/s-2007-1002624. [DOI] [PubMed] [Google Scholar]
- Kortlever RM, Higgins PJ, Bernards R. Plasminogen activator inhibitor-1 is a critical downstream target of p53 in the induction of replicative senescence. Nat Cell Biol. 2006;8:877–884. doi: 10.1038/ncb1448. [DOI] [PMC free article] [PubMed] [Google Scholar]
- Kortlever RM, Nijwening JH, Bernards R. Transforming growth factor-beta requires its target plasminogen activator inhibitor-1 for cytostatic activity. J Biol Chem. 2008;283:24308–24313. doi: 10.1074/jbc.M803341200. [DOI] [PMC free article] [PubMed] [Google Scholar]
- Lademann U, Rømer MU, Jensen PB, Hofland KF, Larsen L, Christensen IJ, Brunner N. Malignant transformation of wild-type but not plasminogen activator inhibitor-1 gene-deficient fibroblasts decreases cellular sensitivity to chemotherapy-mediated apoptosis. Eur J Cancer. 2005;41:1095–1100. doi: 10.1016/j.ejca.2005.02.010. [DOI] [PubMed] [Google Scholar]
- Li CF, Kandel C, Baliko F, Nadesan P, Brünner N, Alman BF. Plasminogen activator inhibitor-1 (PAI-1) modifies the formation of aggressive fibromatosis (desmoid tumor) Oncogene. 2005;24:1615–1624. doi: 10.1038/sj.onc.1208193. [DOI] [PubMed] [Google Scholar]
- Lindberg P, Larsson A, Nielsen BS. Expression of plasminogen activator inhibitor-1, urokinase receptor and laminin gamma-2 chain is an early coordinated event in incipient oral squamous cell carcinoma. Int J Cancer. 2006;118:2948–2956. doi: 10.1002/ijc.21568. [DOI] [PubMed] [Google Scholar]
- Maillard C, Jost M, Romer MU, Brunner N, Houard X, Lejeune A, Munaut C, Bajou K, Melen L, Dano K, Carmeliet P, Fusenig NE, Foidart JM, Noel A. Host plasminogen activator inhibitor-1 promotes human skin carcinoma progression in a stage-dependent manner. Neoplasia. 2005;7:57–66. doi: 10.1593/neo.04406. [DOI] [PMC free article] [PubMed] [Google Scholar]
- Nishioka N, Matsuoka T, Yashiro M, Hirakawa K, Olden K, Roberts JD. Plasminogen activator inhibitor 1 RNA interference suppresses gastric cancer metastasis in vivo. Cancer Sci. 2011 doi: 10.1111/j.1349-7006.2011.02155.x. Epub ahead of print. [DOI] [PMC free article] [PubMed] [Google Scholar]
- Nykjaer A, Conese M, Christensen EI, Olson D, Cremona O, Gliemann J, Blasi F. Recycling of the urokinase receptor upon internalization of the uPA:serpin complexes. EMBO J. 1997;16:2610–2620. doi: 10.1093/emboj/16.10.2610. [DOI] [PMC free article] [PubMed] [Google Scholar]
- Offersen BV, Nielsen BS, Høyer-Hansen G, Rank F, Hamilton-Dutoit S, Overgaard J, Andreasen PA. The myofibroblast is the predominant plasminogen activator inhibitor-1-expressing cell type in human breast carcinomas. Am J Pathol. 2003;163:1887–1899. doi: 10.1016/S0002-9440(10)63547-X. [DOI] [PMC free article] [PubMed] [Google Scholar]
- Pedroja BS, Kang LE, Imas AO, Carmeliet P, Bernstein AM. Plasminogen Activator Inhibitor-1 Regulates Integrin αvβ Expression and Autocrine Transforming Growth Factor β Signaling. J Biol Chem. 2009;284:20708–20717. doi: 10.1074/jbc.M109.018804. [DOI] [PMC free article] [PubMed] [Google Scholar]
- Schmalhofer O, Brabletz S, Brabletz T. E-cadherin, β-catenin, and ZEB1 in malignant progression of cancer. Cancer Metastasis Rev. 2009;28:151–166. doi: 10.1007/s10555-008-9179-y. [DOI] [PubMed] [Google Scholar]
- Stefansson S, Lawrence DA. The serpin PAI-1 inhibits cell migration by blocking integrin alpha V beta 3 binding to vitronectin. Nature. 1996;383:441–443. doi: 10.1038/383441a0. [DOI] [PubMed] [Google Scholar]
- Ulisse S, Baldini E, Sorrenti S, D'Armiento M. The urokinase plasminogen activator system: a target for anti-cancer therapy. Curr Cancer Drug Targets. 2009;9:32–71. doi: 10.2174/156800909787314002. [DOI] [PubMed] [Google Scholar]
- van Arensbergen J, García-Hurtado J, Moran I Maestro MA, Xu XB, Van de Casteele M, Skoudy AL, Palassini M, Heimberg H, Ferrer J. Derepression of Polycomb targets during pancreatic organogenesis allows insulin-producing beta-cells to adopt a neural gene activity program. Genome Research. 2010;20:722–732. doi: 10.1101/gr.101709.109. [DOI] [PMC free article] [PubMed] [Google Scholar]
- Wong HH, Lemoine NR. Pancreatic cancer: molecular pathogenesis and new therapeutic targets. Nature Rev Gastr Hepat. 2009;6:412–422. doi: 10.1038/nrgastro.2009.89. [DOI] [PMC free article] [PubMed] [Google Scholar]
- Yang J, Weinberg RA. Epithelial-Mesenchymal Transition: At the Crossroads of Development and Tumor Metastasis. Develop Cell. 2008;14:818–829. doi: 10.1016/j.devcel.2008.05.009. [DOI] [PubMed] [Google Scholar]
- Yang H, He S, Quan Z, Peng W, Yan B, Liu J, Wen F, Cao R, Xu Y, Wen G, Hu W. Small Interfering RNA-mediated Caveolin-1 Knockout on Plasminogen Activator Inhibitor-1 Expression in Insulin-stimulated Human Vascular Endothelial Cells. Acta Biochim. Biophys. Sin. 2007;39:224–233. doi: 10.1111/j.1745-7270.2007.00270.x. [DOI] [PubMed] [Google Scholar]


