Abstract
There is great interest in point-of-care antibody testing for the diagnosis of infectious and autoimmune diseases. As a first step in the development of self-contained and miniaturized devices for highly quantitative antibody detection, we demonstrate the application of Luciferase Immunoprecipitation Systems (LIPS) technology in a microfluidic format. Protein A/G was immobilized on the walls of PDMS-glass microchannels of 500 nL volume. The assay proceeds with the simultaneous introduction of plasma and Renilla luciferase–tagged antigens. Following washing, coelenterazine substrate was added and bound antigen-luciferase measured by chemiluminescence. Total assay time, including rinsing and detection, is under ten minutes. Using these stable microfluidic devices, high diagnostic performance (100% sensitivity and 100% specificity) was achieved for the diagnosis of HSV-2 infection. Based on these findings, the LIPS microfluidic format should readily lend itself to automation and the transfer to portable instrumentation.
Keywords: antibody detection, biosensor, LIPS, microfluidics
Introduction
Due to the widespread use of antibody serology for clinical evaluation, there is great interest in automated point-of-care testing. Although several formats that employ dip-sticks or lateral flow immunochromatographic devices are already available, these tests are not quantitative and are practical only for relatively simple diagnostic applications (Weigl et al. 2008). Microfluidic devices offer an alternative format for more complicated and comprehensive clinical testing including detection and quantification of nucleic acids, measurement of different protein analytes and quantitative detection of antibodies directed against infectious agents and autoimmune targets. In contrast to standard well-based assay formats, microfluidic devices lend themselves to process automation and the possibility of use in point-of-care testing by unskilled operators. Miniaturization of the assay format also enables the use of reduced volumes of clinical sample and reagents, and can lead to decreased assay time due to the reduction in binding speeds for diffusion-limited processes.
There has been considerable focus on developing microfluidic immunoassays, with recent progress described in several reviews (Bange et al. 2005; Ng et al. 2010), including one focused on diagnosis of infectious disease in resource-poor settings (Lee et al. 2010). Most of these microfluidic applications have used a sandwich immunoassay format to evaluate clinical analytes. Typically, antigens or antibodies are immobilized at the capture site and the clinical sample is then applied, allowing binding of the target. A wash step is then employed to remove unbound material, followed by the application of labeled secondary antibodies or other reagents. The excess reagents are then removed by a second washing step and the specifically retained label detected by electrical, optical or other detectors. These microfluidic approaches, based on solid phase ELISA and microarray formats in which the antigenic target is immobilized on a surface, are hampered by slow kinetics and the distortion of critical conformational epitopes needed for high sensitivity. Furthermore, the requirement to simultaneously optimize solid phase binding to a variety of targets while minimizing the background arising from nonspecific binding can add undesired complexity to device operation. To date, there have been relatively few studies using microfluidics to analyze clinical samples. Notable exceptions include the development of an immunosensor for antibodies against Helicobacter pylori using antigen tethered to magnetic beads with electrochemical detection (Pereira et al. 2010). Several other groups have demonstrated measurements of clinically relevant analytes in serum samples including C-reactive protein (CRP) (Bhattacharyya and Klapperich 2007; Gervais and Delamarche 2009), specific IgE levels (Heyries et al. 2008), prostate-specific antigen (Okada et al. 2011), total IgG (Linder et al. 2002) and ferritin (Kartalov et al. 2008). Of particular interest, Gervais and Delamarche demonstrated a microfluidic sandwich immunoassay that relies on device geometry and capillary pumping to automate all assay steps after the initial introduction of serum and carrier buffer, and applied the device to detection of CRP (Gervais and Delamarche 2009). Ohashi et al. demonstrated a micro-ELISA for the measurement of serum IgE levels in nine minutes (Ohashi et al. 2009). Most of these systems have used fluorescence-based detection, which requires an external light source and optical filtering, and all employ labeled secondary antibodies, a step that adds to the complexity of the assay. Chemiluminescence detection, as used in this work and in two of the above references (Bhattacharyya and Klapperich 2007; Heyries et al. 2008), lends itself to much simpler instrumentation. The background chemiluminescent signal, which arises primarily from autooxidation of the substrate, can also be very low. The background in fluorescence measurements is typically much higher, and is caused by imperfect filtering of the excitation light as well as autofluorescence of the sample components or system materials. The latter is a particular concern for polymeric microchip systems, in which the sample channel is surrounded by a relatively large volume of autofluorescent material.
In contrast to solid phase immunoassays, liquid phase assays for antibody detection, which employ radioactive or other labeled antigens, show high sensitivity, efficiently detect conformational epitopes and are optimal for measuring autoantibodies in various autoimmune diseases (Liu and Eisenbarth 2007). One major class of liquid phase assays is the homogeneous immunoassay, which relies on competition for binding sites between molecules in the sample and labeled but otherwise identical molecules. However, quantification in these systems typically requires separation of the free and immunocomplexed labeled molecules, which adds to instrument complexity. A review by Hou covers advances in applying electrophoretic separations for on-chip immunoassays on real-world samples(Hou and Herr 2008). Of particular note, Herr et al. have developed a portable instrument for saliva-based diagnostics, integrating sample pretreatment, analyte preconcentration, and electrophoresis with laser-induced fluorescence detection (Herr et al. 2007).
Another highly informative liquid phase assay, the Luciferase Immunoprecipitation Systems (LIPS) assay, employs light emitting recombinant antigens to measure antibody titers, and has been successfully applied in a variety of clinical disease states including both autoimmune and infectious diseases (Burbelo et al. 2010a). In LIPS assays, a lysate containing recombinant fusion protein, consisting of the antigen of interest fused to Renilla luciferase (Ruc) reporter, is produced from mammalian cells. When the Ruc-antigen fusion protein is mixed with the serum sample, potential antibodies in the sample bind the Ruc-antigen. Next, antibodies bound to the Ruc-antigen and other antibodies present in the sample are captured on immobilized protein A/G. After washing, only the Ruc-antigen that is bound by specific antibodies is retained, and can be quantitatively measured using chemiluminescence detection. LIPS has several advantages including a large dynamic range, rapid fluid phase kinetics, and low background compared to a standard ELISA(Burbelo et al. 2010a). Due to these advantages, LIPS demonstrates highly sensitive diagnostic performance for domestic and global pathogens, insights into infection-related disease mechanisms, discovery of new biomarkers for human diseases, subcategorization of symptoms based on antibody profiles, and identification of pathogenic autoantibodies against self-proteins.
To date, several LIPS formats are available including single tube assays to measure one antigen in a single sample (Burbelo et al. 2005), iterative testing using microtiter plates (Burbelo et al. 2010b; Burbelo et al. 2010c; Burbelo et al. 2009d) and microwell arrays for simultaneously profiling antibody responses to panels of antigens (Burbelo et al. 2011). In addition, a rapid format called QLIPS uses a relatively short incubation of 10 minutes but still shows sensitivity and specificity comparable to the standard 2 hour LIPS format (Burbelo et al. 2009a; Burbelo et al. 2009c; Burbelo et al. 2008). All of these formats use 100 µL reaction volumes and require laboratory facilities. Given the demonstrated utility of LIPS for profiling diverse diseases, a self-contained point-of-care format for the LIPS technology would have considerable potential (Burbelo et al. 2009d; Ching et al. 2011). Miniaturization of the LIPS assay in a flow-through format also could reduce reagent consumption, and allow for better control over the mixing and washing steps. In addition, such a format could readily permit multiplexed measurements to evaluate multiple disease markers in a few microliters of serum. The relative simplicity of the LIPS assay, which employs a single liquid phase antibody-antigen binding step and requires only one wash, could ultimately facilitate development of a miniaturized system with minimal instrumentation. In this paper we describe successful transfer of the LIPS assay to a microchannel format and provide initial validation by successfully diagnosing human Herpes Simplex-2 Virus (HSV-2) infection.
Materials and Methods
Materials
Anti-FLAG monoclonal antibody, glutaraldehyde (Grade I 70% in water), and bovine serum albumin were obtained from Sigma-Aldrich. Ultralink protein A/G agarose beads and salt-free lyophilized protein A/G were obtained from Pierce/Thermo Scientific. The microwell experiments used coelenterazine substrate from Promega (Madison, WI), and the microchannel experiments used native coelenterazine from Biosynth (Itasca, IL). Glass slides pre-coated with aminosilane were obtained from KD Medical (Columbia, MD).
Renilla Luciferase Constructs and Fusion Protein Production
The mammalian Renilla luciferase (Ruc) expression vector, pREN2 (Burbelo et al. 2005), was used for generating all Ruc-antigen lysates. Antigens produced via the pREN2 vector contain an N-terminal FLAG epitope tag that precedes the Ruc and can be selectively targeted using an anti-FLAG antibody (Sigma-Aldrich). This study used the antigen fusion for Ruc-gG2, found to be highly diagnostically useful for HSV-2 infection, which has been previously described (Burbelo et al. 2009b). Briefly, for production of crude cell lysates containing Ruc-gG2, Cos-1 cells were transfected; forty hours later, the transfected cells were harvested and Ruc-gG2 extract prepared by cell lysis and brief centrifugation. This Ruc-gG2 extract was mixed with an equal volume of glycerol, aliquoted, and stored at −80 °C until use.
Human Samples and HSV-2 Microfluidic Testing
Plasma samples were obtained from subjects and volunteers under institutional review board-approved protocols at the Clinical Center and National Institute of Allergy and Infectious Diseases, NIH (Bethesda, MD). The samples used in this study (a kind gift from Dr. Jeffrey Cohen, NIAID, NIH) represented a cohort of plasma previously tested by a standard ELISA, Western blotting and standard LIPS for HSV-2 serological status (Burbelo et al. 2009b). These samples were stored at −80° C until needed. A total of 20 plasma samples, 5 of each permutation of HSV-1/HSV-2 serology, were tested at least 3 times each. Two samples with different HSV-2 status were chosen at random to serve as standard positive and negative samples. These samples were tested 18 and 7 times, respectively, sometimes under different incubation conditions as described in the results section.
Microwell Experiments
Two initial sets of experiments were performed in single microwells in order to assess the impact of reducing IgG binding capacity and sample volume. All experiments followed the standard LIPS protocol previously described (Burbelo et al. 2005) using polyclonal FLAG antibody (Sigma-Aldrich) and a modified rinsing step. Briefly, 1 µL of Ruc-gG2 cell extract (3.9×10⁷ LU) was incubated with 1 µL of FLAG Ab (1 mg/mL), varying amounts of agarose-linked protein A/G, and varying volumes of Buffer A (20 mM Tris, pH 7.5, 150 mM NaCl, 5 mM MgCl2, 1% Triton X-100) for two minutes at room temperature in a 1.5 mL centrifuge tube. After incubation, the beads were washed by adding 1 mL of Buffer A, briefly centrifuged, and the supernatant discarded. The washing procedure was repeated a total of 4 times with Buffer A and 2 times with PBS. 100 µL of 1x coelenterazine substrate (Promega) was then added to the washed beads and the light output of the reaction immediately measured with a single tube luminometer (Turner BioSystems, Sunnyvale, CA).
Microchannel Device Fabrication
The microchannels used in this study were 2 cm long, 1mm wide and 22 µm high, as measured by optical profilometry on the template, for a total volume of 440 nL. The channel template was fabricated by spin-coating SU-8 2015 (Microchem, Newton MA) onto a silicon wafer, and patterning with contact lithography. PDMS (Sylgard 184, Dow-Corning) was thoroughly mixed in a 10:1 w/w ratio of base to curing agent, before being poured over the template, degassed under vacuum at room temperature for one hour, and cured at 80°C for two hours. The cured PDMS, with a thickness of 2mm +/− 0.6mm, was peeled off of the SU-8 template and laid channel-side down in a clean Petri dish. Circular ports 2 mm in diameter were punched at either end of each rectangular microchannel to provide access to the channels. The individual microchannels were cut out with sufficient surrounding material to ensure bonding, laid channel-side up in a clean glass Petri dish and placed in a UV ozone cleaner (model 144AX, Jelight, Irvine CA) for 7 minutes. The oxidized PDMS was then immediately mounted channel-side down onto aminosilane-coated slides. The bonded devices were kept in Petri dishes at room temperature for at least ten days before use.
Microchannel Protein A/G Immobilization
The protocol for covalent attachment of protein A/G to the silanated glass inside the microchannel employed both passive and active flow of reagents. For passive flow, 1µL of fluid was dispensed in one port and a larger volume of fluid dispensed in the opposite port, resulting in flow driven by hydrostatic pressure and surface tension. For active flow, fluid was dispensed in one port and vacuum applied at the opposite port. Two vacuum pressures were used: high (between 25 and 30 inches Hg), giving a flow rate of 1.8 +/− 0.2 µL/s and low (less than 1 inch Hg), giving a flow rate of 84 +/− 16 nL/s. Although high pressure gives faster flow rates, in our experience high pressure rinses of protein coated channels led to considerable run to run variation. As a result, although the initial rinses were performed with high pressure, once the protein A/G was introduced to the channels, only low pressure vacuum was used for rinsing, BSA blocking, and subsequent device operation. During the incubation steps, devices were stored in Petri dishes that were humidified using moistened tissues placed adjacent to the devices First, the dry microchannels were rinsed four times by active flow using 10mM sodium tetraborate titrated with 0.5M boric acid to pH 7.0 (BB). A fresh dilution of 2.5% glutaraldehyde (GA) was prepared in BB, and 5µL of the diluted GA was drawn through each channel with vacuum. The devices were left at room temperature for 1h with an additional 10 µL of diluted GA passively flowing through each channel. The ports were then emptied and rinsed with BB using a micropipette, and each channel was washed twice with active flow of 5 µL BB. From this point onwards, the channels were never fully emptied. After emptying the ports with a micropipette, 5 µL of 5 mg/mL protein A/G in BB was actively flowed through each device. The devices were then incubated at room temperature for 2h with 8 µL of protein A/G passively flowing through each channel. Subsequently, all ports were emptied and rinsed with PBS, after which the channel was washed twice with active flow of 5 µL PBS. To prevent nonspecific adsorption, the channels were blocked with 5 mg/mL BSA, drawn into the channels with vacuum and then left with 10 µL BSA passively flowing for ten minutes at room temperature. The ports were then emptied with a micropipette and washed with PBS as before. Finally, the channels were washed twice by active flow of 5 µL PBS. The devices were filled with PBS, and stored in foil-wrapped humid Petri dishes at 4 °C until use.
Assay Operation
Protein A/G-coated microchannel devices were taken out of the refrigerator immediately before use. Aliquots of cell extract and coelenterazine were transferred from −80 °C to −4 °C at most 15 minutes before use. Plasma samples were centrifuged for 2 min at 14,000 g and then kept on ice until use. At room temperature, both ports of the microchannel were emptied with a micropipette. 3.8 µL PBS, 1 µL plasma, and 0.7 µL cell extract were added to one port, mixed by pipetting, and the resulting mixture drawn into the channel by aspirating the opposite port with low vacuum pressure. Two minutes after the plasma and extract were introduced into the channel, the ports were emptied with a micropipette and rinsed with PBS. The channel was then rinsed twice with 5 µL of PBS using low pressure vacuum. The total incubation time -- from the moment that the extract and plasma were mixed together to the moment that the mixture was washed out of the channel -- was 4 minutes +/− 10s.
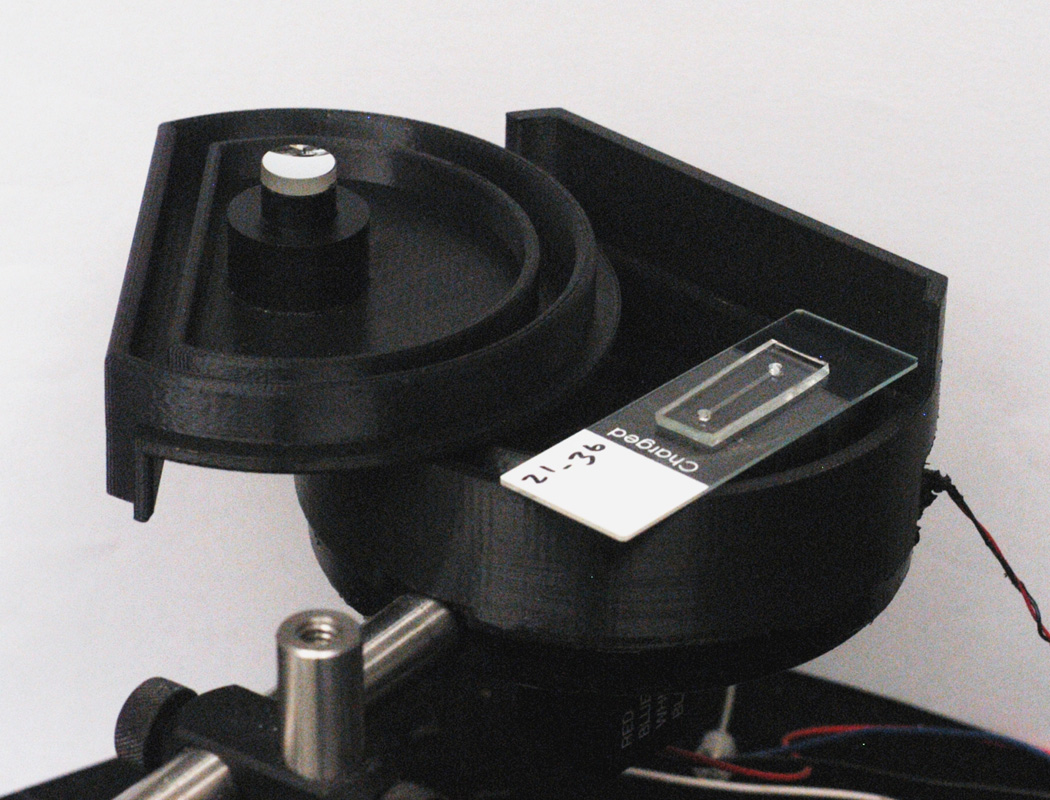
For the microchannel measurements, the chemiluminescence was recorded using a Hamamatsu 6780-20 photomultiplier tube (PMT), which has an 8 mm diameter circular sensor. A lab-built housing was designed in Solidworks (Dassault Systémes, Concord MA) and fabricated using a fused deposition molding prototyping system (Stratasys, Eden Prairie MN). This housing provides access for pipetting, incorporates a commercial shutter, holds a 1/2” diameter concave mirror with a 1/2” radius of curvature mounted above the microchannel to improve the light collection efficiency, and has sufficient flat area to conveniently accommodate the microchannel substrate. The output from the PMT was amplified (model C7319, Hamamatsu) and recorded using a digital multimeter (Agilent, model 34410A) controlled using Labview (National Instruments). To detect the bound fusion protein, both ports of the device were emptied with a pipettor, the device placed over the PMT, and 1 µL PBS added to one port. A stock solution of native coelenterazine dissolved at 2.5 mg/mL in acidified methanol (10 mL methanol + 20 µL 37% HCl) had been previously prepared, aliquoted and stored at −80 °C for at most four weeks. This stock solution of coelenterazine was diluted 1:51 in 100 mM Tris-glycine buffer, pH 8.05, with 500 mM NaCl, and 15 µL immediately dispensed into the opposite port and allowed to passively flow through the channel. The subsequent light output was recorded for at least 90 s. Devices were discarded after one use.
Results and Discussion
Optimization of Relevant Parameters for Microscale LIPS
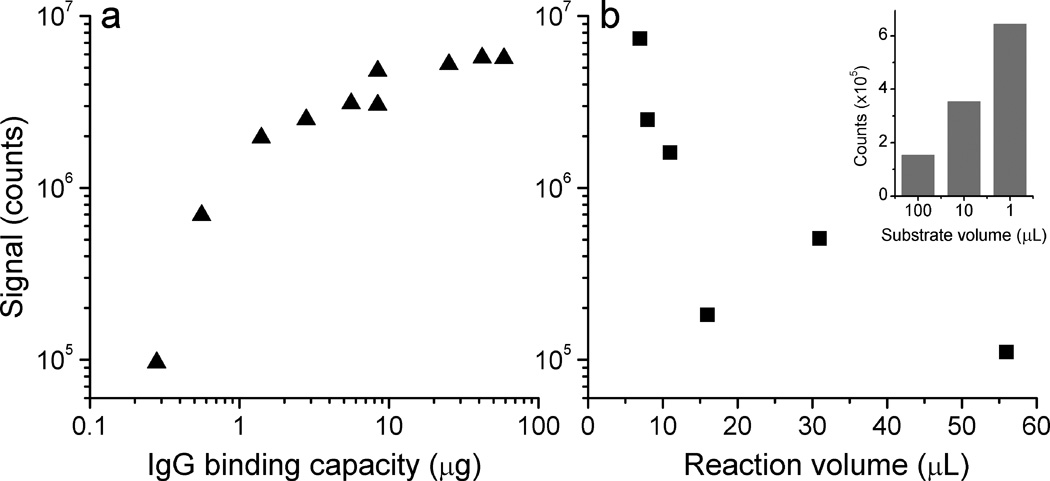
One major difference between performing the LIPS assay in a microfluidic channel as compared to the standard microtiter well format is the reduced IgG binding capacity, which could potentially lead to a large reduction in light output. On the other hand, the microchannel format also has a substantially reduced volume, allowing the use of more concentrated reagents to increase the signal. To assess the effects of simultaneously reducing binding capacity and reaction volume, a pilot series of experiments was first performed in microwells using Ruc-tagged antigen, 1 µg of anti-FLAG antibodies, and protein A/G beads diluted in Buffer A using minimal reaction volumes (≤ 8 µL). In these LIPS experiments, the N-terminal FLAG-epitope tagged Renilla luciferase-antigen fusion protein binds to the FLAG antibody, which is itself retained by the protein A/G beads. The fusion proteins in any captured immunocomplexes produce light upon the addition of 100 µL of coelenterazine. Figure 1a shows the results from varying the amount of protein A/G coated agarose in each reaction, such that the IgG binding capacity ranges from 300 ng to 60 µg. The light output increases rapidly with IgG binding capacity over the lower range, but begins to saturate when the binding capacity far exceeds the amount of antibody added. The lowest binding capacity used here (300 ng) still gives a signal over two orders of magnitude above the background level (<1000 counts), in part because of the reduced volumes used. However, even the lowest binding capacity used in this set of measurements is perhaps a factor of ten greater than what we expect for a functionalized smooth-walled channel. As a rough estimate for the expected binding capacity of the microchannel surface, we assume a dense protein A/G monolayer with IgG binding capacity of 1–2 pmol/cm2 (Dubrovsky et al. 1996). For a microchannel with total interior surface area of 0.02 cm2, this corresponds to a total IgG binding capacity of 200–400 fmol, or 30–60 ng. This additional ten-fold reduction would correspond to a signal still comfortably above background, but perhaps six hundred times lower than the standard assay.
Fig. 1.
Effect of reduced IgG binding capacity and reduced reaction volume on LIPS signals, measured in single microwells. In a), amount of agarose-tethered protein A/G varied; b) IgG binding capacity held constant at 42 µg, reaction volume varied. Inset: effect of reduction in detection buffer volume, while holding amount of coelenterazine constant.
A second set of measurements directly assessed the effect of using a smaller reaction volume than the standard LIPS microtiter well format. These experiments showed that when the reaction volume was reduced from 56 µL to 7 µL, there was a sixty-fold increase in signal (Fig. 1b). Furthermore having a reduced volume of detection buffer, while holding the amount of coelenterazine constant, also led to an increased signal. In these experiments, coelenterazine was diluted in detection buffer under three conditions: 100 µL of 1x (a 100-fold dilution from the stock solution), 10 µL of 10x, and 1µL of 100x concentration (no dilution). The most concentrated solution gave a signal four times higher than the 100-fold dilution, without a substantial increase in background (inset of Fig. 1b). For all of these experiments, the number of rinses and volume of rinse buffer used were kept constant, so enhanced nonspecific binding in the reduced volumes is unlikely to contribute significantly to these results. Based on these modifications, we estimated that it should be possible to conduct the LIPS assay in the simple miniaturized format with as little as a 2–3 fold loss of signal relative to the traditional filter plate setup.
LIPS Microchannel Format
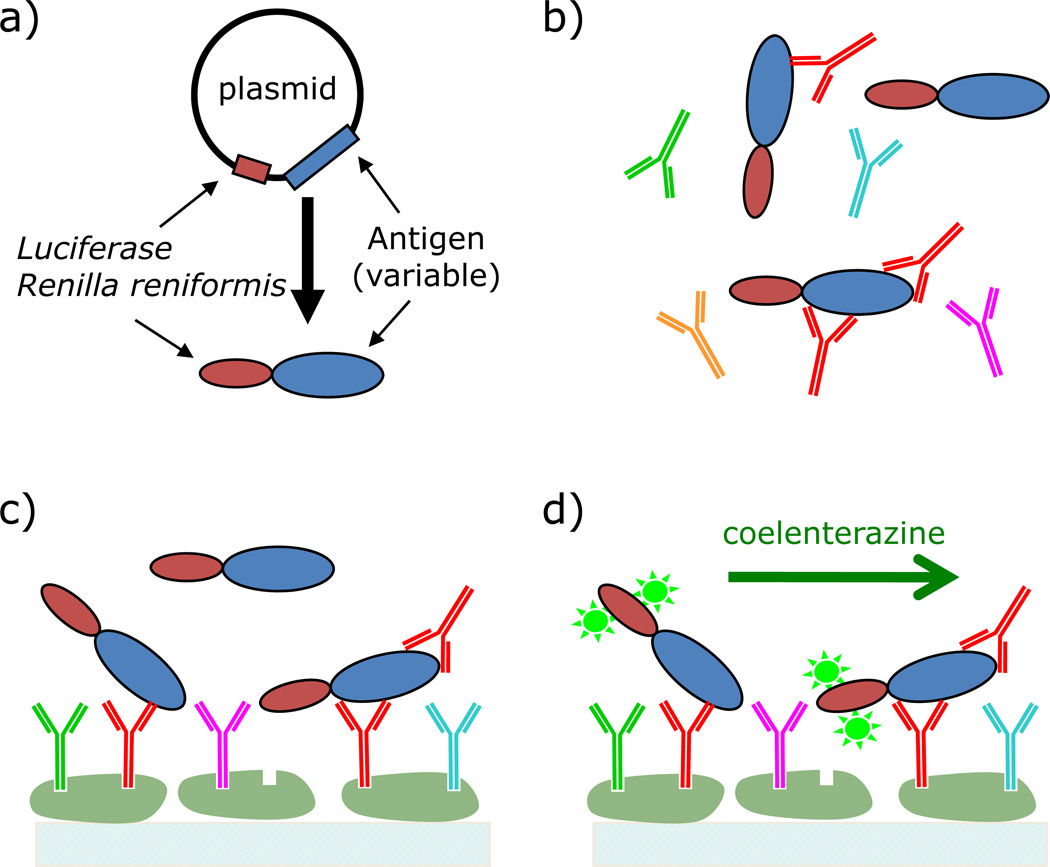
Based on the potential for microscale detection using the LIPS technology, a microchannel device was developed for antibody detection. A schematic for the microfluidic LIPS format is shown in Figure 2. In these studies, various antigen targets are generated as Ruc-antigen fusions (Fig. 2a). Protein A/G is immobilized on the interior surfaces of microchannels, and assay reagents are flowed actively and passively through the microchannels. For antibody detection, human plasma and cell extract containing the Ruc-antigen fusion protein are simultaneously added and pumped through the microchannel device (Fig. 2b). The antibodies and antibody-bound Ruc-antigen are captured by protein A/G immobilized to the solid support, and the unbound fusion protein removed by thorough rinsing (Fig. 2c). Note that the targeted antibodies are only a fraction of the total captured antibodies, and that the only remaining fusion protein is that captured by the targeted antibodies from the sample. Finally, the captured Ruc fusion protein is detected by measuring the chemiluminescence upon the introduction of the luciferase substrate, coelenterazine (Fig. 2d). The following sections provide experimental details for the development and application of the technology.
Fig. 2.
Schematic of the LIPS assay for surface-immobilized protein A/G. a) Generate fusion protein by transfection of Cos1 cells. b) Combine cell extract, containing fusion protein, and plasma sample. c) Capture antibodies with immobilized protein A/G. d) Wash to remove unbound fusion protein, introduce enzyme substrate (coelenterazine) and detect.
Initial Evaluation of the LIPS Microchannel Device for Detecting anti-HSV2 Antibodies
After verifying that the microchannels with surface tethered protein A/G could be used to measure FLAG antibodies (data not shown) we moved on to measuring plasma samples using the microchannels. We chose to apply the microfluidic serological test to the detection of anti-HSV-2 antibodies because of the previous highly successful detection of antibodies using the standard LIPS format (Burbelo et al. 2009b). For initial experiments, known negative and positive plasma HSV-2 plasma samples were tested in the microfluidic channel with the HSV-2-specific Ruc-gG2 antigen. For these measurements, 1 µL of plasma, 0.7 µL of cell extract, and 3.8 µL of PBS were added to one port of a microchannel that had previously been functionalized with protein A/G and blocked with BSA. The mixture was drawn into the channel with low-pressure vacuum and left to incubate for four minutes, after which the ports and then the channel were rinsed with PBS. For detection of the bound fusion protein, the device was placed over the PMT, and coelenterazine, the luciferase substrate, was pipetted into one of the ports and allowed to passively flow through the channel while the light output was recorded using the laboratory-built instrument shown in Figure 3.
Fig. 3.
Picture of PMT used for measuring chemiluminescence, with custom-built housing. A single microchannel mounted on a 1”x3” glass slide sits on top. When used, mounted microchannel is placed inside the housing, the lid (shown upside-down) is closed, such that the mirror helps direct light to the PMT, and the shutter (control wires shown at lower right) is opened.
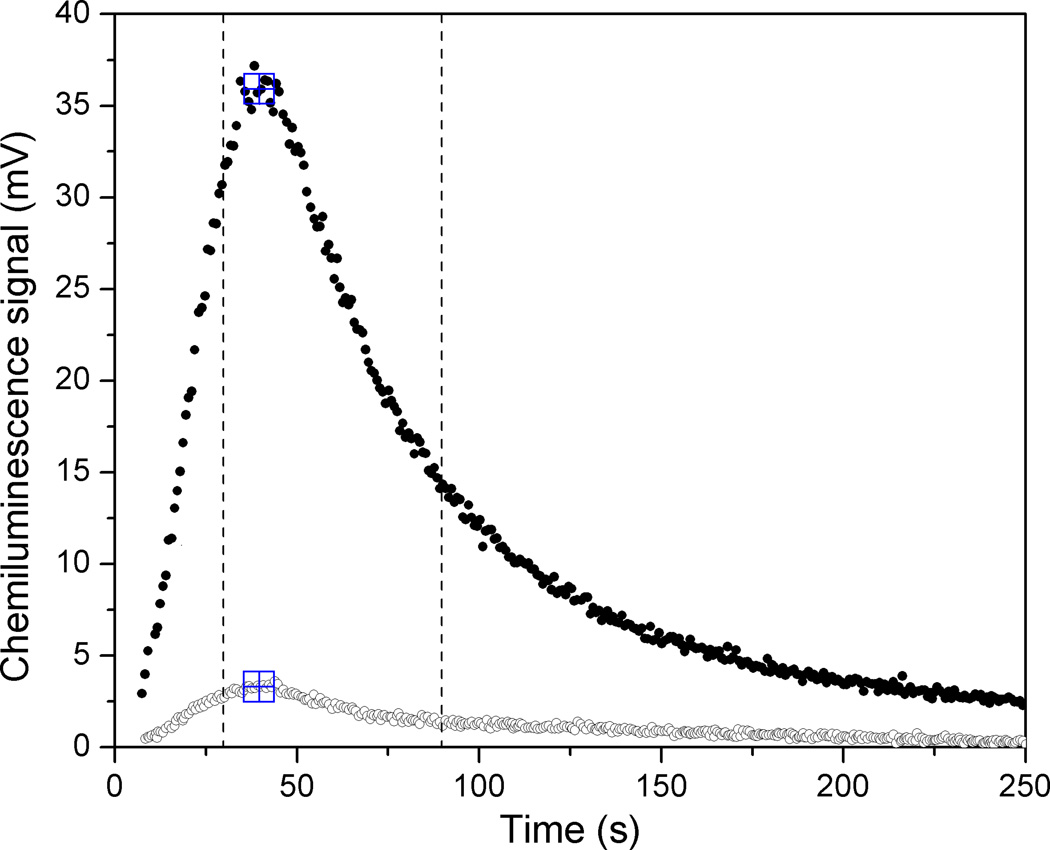
The results of two measurements on these standard samples using the established operation protocol are shown in Figure 4. As expected, the signal corresponding to a positive HSV-2 plasma sample was considerably lower than that measured for pure anti-FLAG monoclonal antibody in buffer (data not shown), but the relative light output corresponding to the positive and negative HSV-2 samples is nonetheless clearly distinguishable. The decrease in light signal relative to the anti-FLAG measurements is almost certainly due to the presence of other IgG molecules that also bind to the immobilized protein A/G but are not directed against the gG2 HSV-2 antigen. The coefficient of variation over all eighteen measurements using this protocol on the standard positive sample, all performed with single-use devices and taken over multiple days, was 16%. The observed peak shape is determined by the chemical reaction rate as well as the kinetics of coelenterazine delivery to the luciferase attached to the channel walls. Independent measurements of the flow rates using crystal violet in water under similar channel loading conditions as the coelenterazine give a time of approximately ten seconds for the front to reach the midpoint of the channel, roughly consistent with the observed rise in signal. The luminescence measured for the negative sample likely arises from incomplete rinsing of the unbound fusion protein and shows considerable run-to-run variation (CV ~50%), albeit at a level well below that measured for the positive sample.
Fig. 4.
Chemiluminescence signal, as recorded by PMT, for positive (filled) and negative (open) HSV2 samples measured in microchannel with four-minute incubation time. Large square symbols indicate peak position found with data-handling algorithm. Vertical lines indicate time window used for peak integration.
While examination of the full time-varying signal is useful for optimizing the measurement parameters, when comparing different samples it is clearly advantageous to convert the measured curve into a single number. To this end, we used the integrated signal under the curve for a sixty-second window starting ten seconds before the peak. The peak position was defined as the highest recorded voltage for which the immediately adjacent points were no more than 2% lower, in order to eliminate spurious noise-driven peaks. The peak position and time limits for calculating the integrated signal from these two measurements are indicated in Figure 4. For the fully standardized protocol and device parameters used for the sample panel in this paper, the peak shape is consistent enough to give a linear correlation between peak value and the integrated area. In calculating the integrated area, we also corrected for a small signal arising from the autooxidation of coelenterazine, measured by flowing coelenterazine through an otherwise untreated microchannel and integrating the resulting signal over a sixty-second window, from 25 to 85 seconds after the coelenterazine was added. The resulting value was subtracted from the signals for both the positive and negative sera samples.
Evaluation of the Surface Chemistry and Stability of the LIPS Microfluidic Device
Several experiments were performed to explore the effect of altered surface chemistry on the signal obtained using the standard HSV-2 positive and negative samples. In each experiment, one component was omitted from the surface chemistry, using buffer only for that step and maintaining the same incubation times. Leaving out the glutaraldehyde resulted in a signal for the positive sample that was 62% of that from the normal surface chemistry, but an unchanged signal level from the negative sample, suggesting that nonspecific adsorption of protein A/G, particularly to the PDMS channel walls, is a substantial contribution to the IgG binding capacity. Surface capture of IgG can also be achieved by relying on nonspecific adhesion of protein A/G to an untreated glass slide. Nonetheless, we chose to focus on covalently linking the protein A/G to a functionalized solid surface, as this method is more consistent with future device development requiring different surface coatings within a single device.
In contrast, leaving out the protein A/G resulted in approximately equal signals for the positive and negative samples, at a level approximately 32% of the positive signal for the normal surface chemistry. In this case, the luminescence likely arises from non-specific adhesion of the luciferase-bearing fusion protein to the channel walls. Finally, omission of the BSA blocking step had minimal effect on the signal levels for both the positive and negative samples, likely because the protein A/G and abundant serum proteins are reasonably effective in preventing non-specific adhesion of the fusion protein. However, for the sake of consistency with the experiments on the sample panel, we continued to perform the BSA blocking step for the measurements reported here.
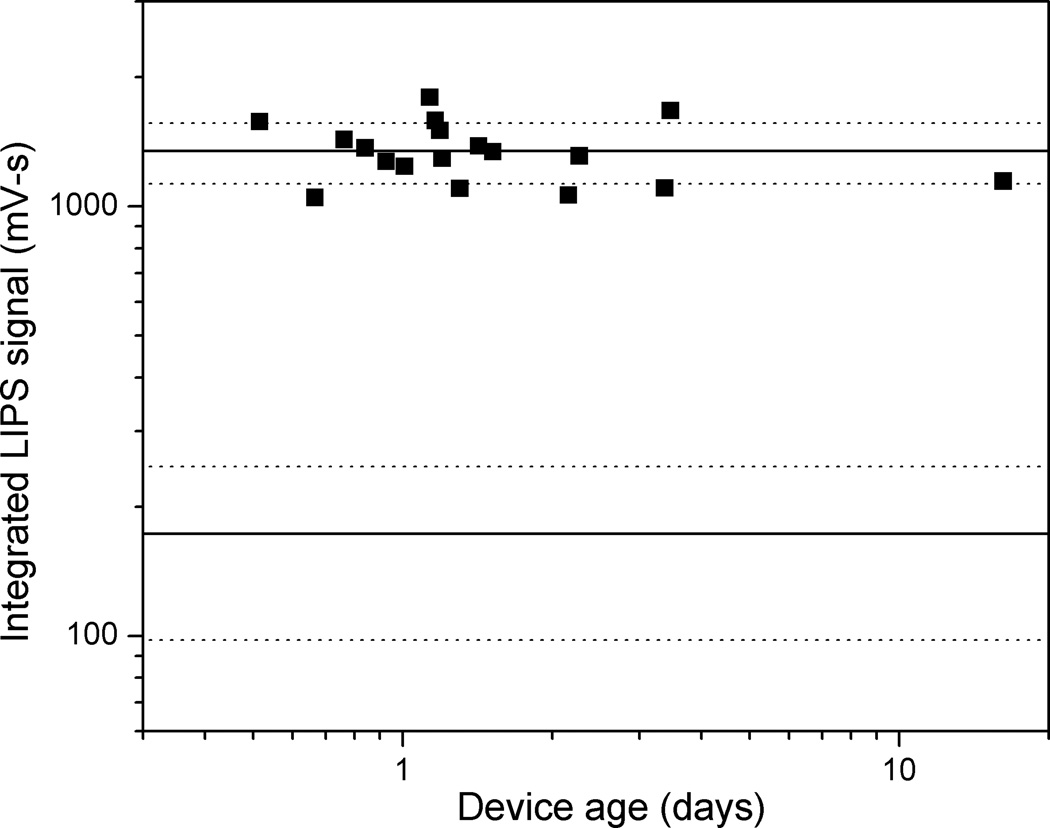
Understanding the stability of the LIPS microfluidic device is an important issue required for possible future clinical applications. In order to assess the stability of the functionalized microchannel and the reproducibility of the assay, the standard HSV2 positive sample was measured repeatedly on multiple devices at varying intervals after protein A/G attachment and BSA blocking. The results for measurements on devices between twelve hours and sixteen days old are shown in Figure 5. For reference, the average signal for the positive HSV-2 plasma samples (1350 mV-s), as well as the average signal for all negative samples (173 mV-s) were plotted as heavy solid lines, with the dotted lines indicating one standard deviation from the mean (217 mV-s and 75 mV-s for the positive and negative samples, respectively). All measurements on the standard positive sample gave a signal well outside the range of values obtained for the negative samples. Furthermore, there is no indication of a systematic change in signal level with device age, even for the sixteen day old device. Because of this demonstrated stability, the later triplicate measurements of the twenty-sample panel used devices between one and four days old. No systematic effects related to device age were observed in those measurements.
Fig. 5.
Device stability after Protein A/G attachment and BSA block, as measured using LIPS signal from standard positive plasma sample for devices between twelve hours and sixteen days old. Heavy lines represent average signal, and dashed lines one standard deviation, for this positive sample and for all negative samples respectively.
LIPS Microfluidic Detection of HSV-2 Antibodies for Serological Status
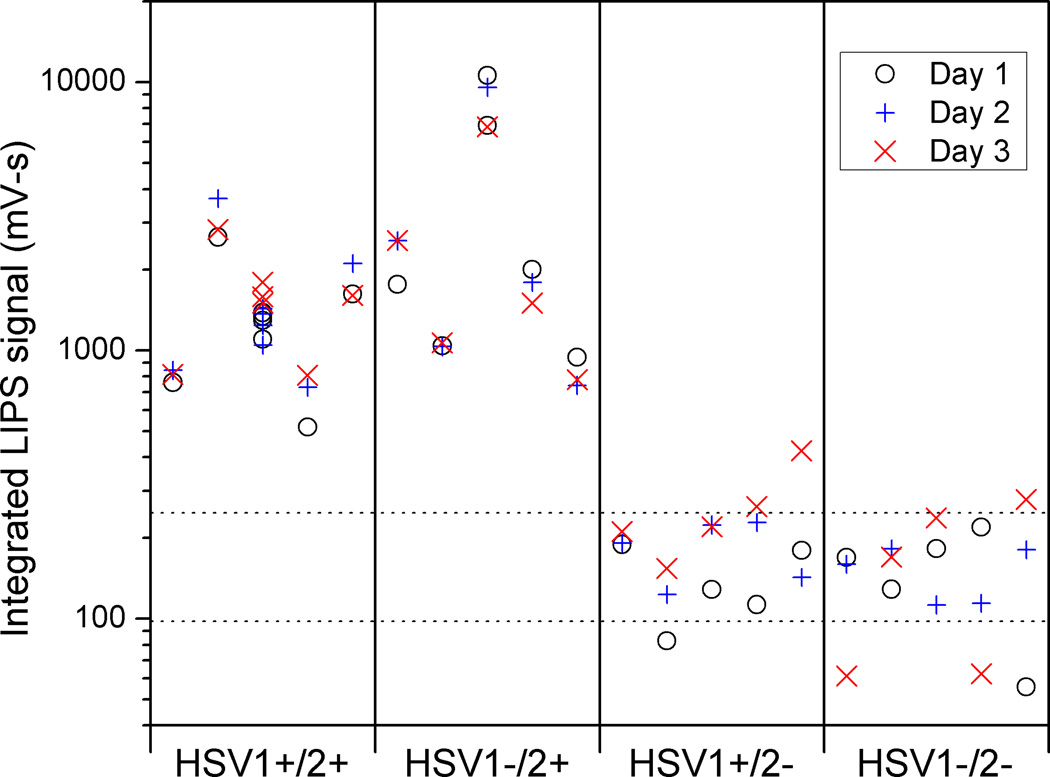
To determine the practical application of the LIPS microfluidic approach for serological testing, twenty human plasma samples previously measured in the standard LIPS format were evaluated (Burbelo et al. 2009b). To evaluate reproducibility, the entire panel of plasma samples was measured on three separate days. The results are shown in Figure 6, with dotted lines plotted at one standard deviation away from the average value of all HSV2 negative samples. The large number of points associated with the middle HSV1+/2+ sample arises from its use as the positive standard in the device stability and other experiments. Although there is some measurement to measurement variation in the signal for each positive sample, the differences between samples are typically larger. Furthermore, there is clear separation between the HSV2 positive and the HSV2 negative samples, regardless of HSV1 status. The difference between the smallest positive (518 mV-s, day 1) and largest negative signal (424 mV-s, day 3) measured is only about 20%. However, when compared to the average signal measured for a negative sample (173 mV-s), this smallest positive signal measured is over 4.5 standard deviations (one SD = 75.2 mV-s) higher; the difference would be still larger if we considered the average signal measured for that positive sample.
Fig. 6.
Result of triplicate measurements on twenty-sample panel. Vertical lines separate different HSV serologies. Horizontal dashed lines correspond to one standard deviation from average negative sample value. Measurements were taken on three different days and individual measurements for each of the 5 patients in each serology group are depicted.
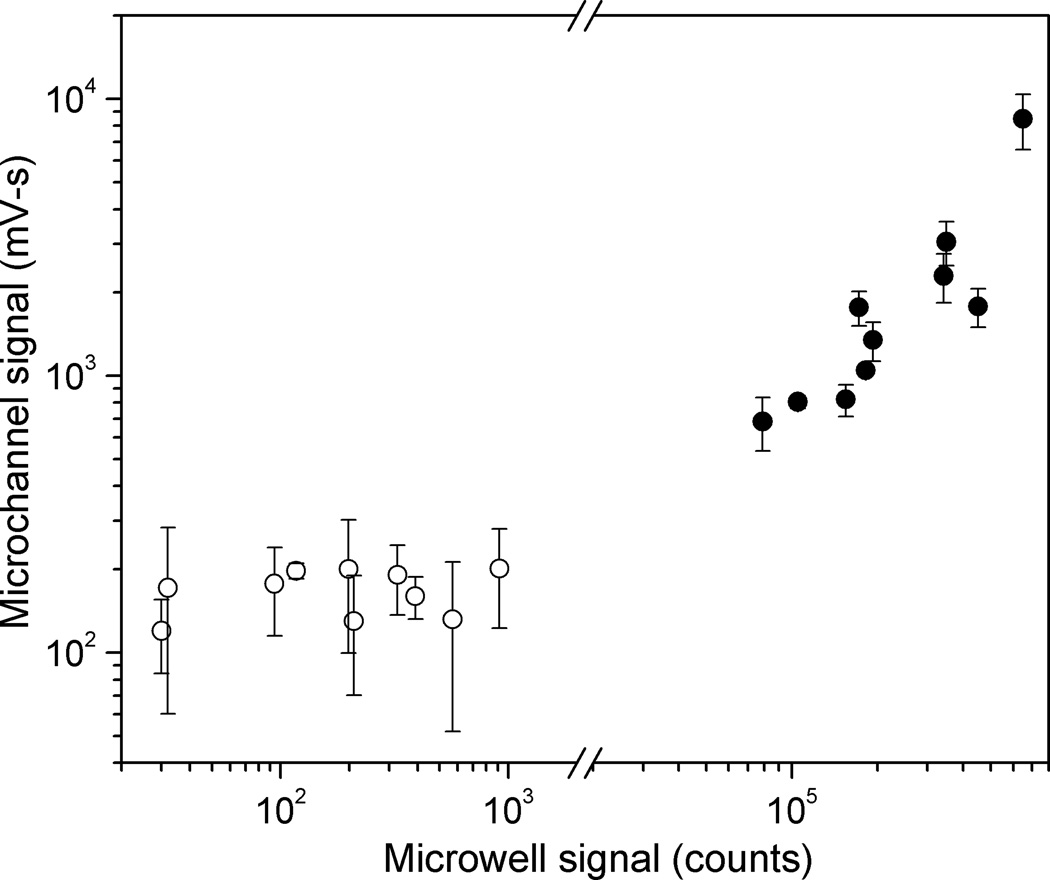
The data obtained for the sample panel using the microchannel format was compared with previously obtained LIPS data for HSV-2 serological status (Burbelo et al. 2009b) using the standard microwell filter plate format (Fig. 7). Both formats showed clear separation between positive and negative samples, and the data tracked each other well; the signal levels for the highest negative and lowest positive samples are separated by a factor of 3.5 for the microchannel format, and a factor of 87 for the microwell format. A cutoff line placed within this window between high negative and low positive values will give 100% sensitivity and 100% specificity for this randomly-chosen panel. For the positive samples, higher signals in the microchannel format were generally correlated with higher signals in the standard format. The observed departures from perfect correlation between the two formats likely are due to differences in antibody binding kinetics among the clinical samples. In the microchannel format the incubation time was only 4 minutes compared to the standard LIPS format of 2 hours. Differences in relative signal values have been previously observed in LIPS versus QLIPS with shorter incubation times (Burbelo et al. 2009c; Burbelo et al. 2008). For the negative samples, the signal observed in the microchannel measurements shows no clear correlation with those measured in the 96-well plate. The relatively consistent non-zero value for the microchannel measurements, and the smaller separation between the signal from positive and negative samples that results, likely arise from difficulties in rinsing the port regions thoroughly in the current microchannel setup, or possibly from deficiencies in the surface chemistry leading to non-specific adhesion within the channels. Future improvements to device design should help to mitigate these problems.
Fig. 7.
Comparison of LIPS signals measured in microchannel using four minute incubation with those measured in standard microwell format and two-hour incubation, for twenty-sample panel shown in Figure 5. Average values for each sample are plotted, with error bars indicating one standard deviation for microchannel measurements. HSV2+ samples (filled circles) are well separated from HSV2− samples (open circles) for both microchannel (factor of 3.5) and microwell (factor of 87) measurements.
Conclusion
This work demonstrates that the LIPS assay can be performed rapidly in a microchannel format using surface-tethered protein A/G to capture and measure antigen-specific IgG antibody levels. The two major features of the microfluidics devices for LIPS are the ability to immobilize sufficient protein A/G for efficient IgG capture and the ability to sensitively detect the amount of antigen bound by using the Renilla luciferase reporter. Since the solid-phase capture of the IgG in the microfluidic format is constant between assays, and Renilla luciferase can be used to tag different antigens, the microfluidics approach described here can be diversified to detect antibodies to many more targets. Particularly encouraging was the finding that the protein A/G functionalized microchannel devices were stable for at least two weeks. With further refinement and standardization, quantitative titers could be obtained for different LIPS tests using the microchannel format described here.
One of the key findings of our microfluidics study was the ability to accurately diagnose HSV-2 infection status in less than ten minutes, giving results consistent with the previous LIPS study using the standard format showing 100% sensitivity and specificity for HSV-2 diagnosis (Burbelo et al. 2009b). Currently there are two commercially available tests for rapid HSV-2 diagnosis: the HerpeSelect Express from Focus Diagnostics and the Biokit HSV-2 Rapid Test. The HerpeSelect Express is a lateral flow immunoassay that uses 15 µL of whole blood and can be performed in 15 minutes. The Biokit HSV-2 is a membrane-based test that uses 50 µL of whole blood or serum and gives results in 10 minutes. Both of these tests only provide qualitative results, and the interpretation of a positive result can be subjective. One of the clear advantages of the microfluidic tests described here is the possibility of obtaining highly quantitative antibody titer that could be used to monitor disease activity and stratify different disease states.
Although the focus of our clinical studies was on using the LIPS assay to detect anti-HSV-2 antibodies for diagnosis, the universal format of IgG capture coupled with different antigen-specific reporters is particularly appealing. Based on the diagnostic performance of the LIPS signals observed for detecting HSV-2 antibodies, we anticipate that other successful LIPS tests developed in the standard microwell format could be miniaturized using this microfluidic format. Additional improvements are also possible including the use of alternate luciferases and substrates that have enhanced activity. For example, the modified glow substrate has a sustained signal over the coelenterazine flash signal and could be used to generate a much larger integrated signal. Another possibility is the use of multiple channels that could be used in parallel to evaluate antibody titers against a variety of targets. Of particular interest would be to develop point of care testing for a panel of antibodies directed against both autoimmune and a spectrum of different infectious diseases for comprehensive disease surveillance. Future work will focus on automating the flow control, particularly for the rinsing and detection steps, in order to allow for the possibility of use by an unskilled operator. Here the simplicity of the assay operation, which includes a single liquid-phase binding event followed by solid phase capture using protein A/G and then a single rinsing step, is a considerable advantage. Another focus for future efforts will be to increase IgG binding capacity in the detection area, with the goal of being able to use low-cost, battery powered electronics for the luminescence readout. The proven application of the LIPS format to a number of diseases prevalent in the developing world suggests a conceptually straightforward route to a broadly useful multiplexed assay.
Acknowledgments
This work was supported by the Intramural Research Program of the National Institutes of Health, including the National Institute of Biomedical Imaging and Bioengineering and the National Institute of Dental and Craniofacial Research. We are grateful to Dr. Jeffrey Cohen for proving the human clinical serum samples.
References
- Bange A, Halsall HB, Heineman WR. Biosensors and Bioelectronics. 2005;20:2488. doi: 10.1016/j.bios.2004.10.016. [DOI] [PubMed] [Google Scholar]
- Bhattacharyya A, Klapperich CM. Biomedical Microdevices. 2007;9:245. doi: 10.1007/s10544-006-9026-2. [DOI] [PubMed] [Google Scholar]
- Burbelo P, Ching K, Issa A, Loftus C, Li Y, Satoh M, Reeves W, Iadarola M. Journal of Translational Medicine. 2009a;7:83. doi: 10.1186/1479-5876-7-83. [DOI] [PMC free article] [PubMed] [Google Scholar]
- Burbelo PD, Bren KE, Ching KH, Gogineni ES, Kottilil S, Cohen JI, Kovacs JA, Iadarola MJ. Molecular BioSystems. 2011;7:1453. doi: 10.1039/c0mb00342e. [DOI] [PMC free article] [PubMed] [Google Scholar]
- Burbelo PD, Ching KH, Bush ER, Han BL, Iadarola MJ. Expert Review of Vaccines. 2010a;9:567. doi: 10.1586/erv.10.50. [DOI] [PMC free article] [PubMed] [Google Scholar]
- Burbelo PD, Goldman R, Mattson TL. BMC Biotechnology. 2005;5 doi: 10.1186/1472-6750-5-22. [DOI] [PMC free article] [PubMed] [Google Scholar]
- Burbelo PD, Hoshino Y, Leahy H, Krogmann T, Hornung RL, Iadarola MJ, Cohen JI. Clin. Vaccine Immunol. 2009b;16:366. doi: 10.1128/CVI.00350-08. [DOI] [PMC free article] [PubMed] [Google Scholar]
- Burbelo PD, Issa AT, Ching KH, Wyvill KM, Little RF, Iadarola MJ, Kovacs JA, Yarchoan R. Journal of Infectious Diseases. 2010b;201:1919. doi: 10.1086/652869. [DOI] [PMC free article] [PubMed] [Google Scholar]
- Burbelo PD, Kovacs JA, Ching KH, Issa AT, Iadarola MJ, Murphy AA, Schlaak JF, Masur H, Polis MA, Kottilil S. The Journal of Infectious Diseases. 2010c;202:894. doi: 10.1086/655780. [DOI] [PMC free article] [PubMed] [Google Scholar]
- Burbelo PD, Leahy HP, Iadarola MJ, Nutman TB. PLoS Negl Trop Dis. 2009c;3:e438. doi: 10.1371/journal.pntd.0000438. [DOI] [PMC free article] [PubMed] [Google Scholar]
- Burbelo PD, Leahy HP, Issa AT, Groot S, Baraniuk JN, Nikolov NP, Illei GG, Iadarola MJ. Autoimmunity. 2009d;42:515. doi: 10.1080/08916930902911738. [DOI] [PMC free article] [PubMed] [Google Scholar]
- Burbelo PD, Ramanathan R, Klion AD, Iadarola MJ, Nutman TB. Journal of Clinical Microbiology. 2008;46:2298. doi: 10.1128/JCM.00490-08. [DOI] [PMC free article] [PubMed] [Google Scholar]
- Ching KH, Burbelo PD, Gonzalez-Begne M, Roberts MEP, Coca A, Sanz I, Iadarola MJ. Journal of Dental Research. 2011;90:445. doi: 10.1177/0022034510390811. [DOI] [PMC free article] [PubMed] [Google Scholar]
- Dubrovsky T, Tronin A, Dubrovskaya S, Guryev O, Nicolini C. Thin Solid Films. 1996;284–285:698. [Google Scholar]
- Gervais L, Delamarche E. Lab on a Chip. 2009;9:3330. doi: 10.1039/b906523g. [DOI] [PubMed] [Google Scholar]
- Herr AE, Hatch AV, Throckmorton DJ, Tran HM, Brennan JS, Giannobile WV, Singh AK. Proceedings of the National Academy of Sciences of the United States of America. 2007;104:5268. doi: 10.1073/pnas.0607254104. [DOI] [PMC free article] [PubMed] [Google Scholar]
- Heyries KA, Loughran MG, Hoffmann D, Homsy A, Blum LcJ, Marquette CA. Biosensors and Bioelectronics. 2008;23:1812. doi: 10.1016/j.bios.2008.02.025. [DOI] [PubMed] [Google Scholar]
- Hou C, Herr AE. Electrophoresis. 2008;29:3306. doi: 10.1002/elps.200800244. [DOI] [PubMed] [Google Scholar]
- Kartalov E, Lin D, Lee D, Anderson W, Taylor C, Scherer A. Electrophoresis. 2008;29:5010. doi: 10.1002/elps.200800297. [DOI] [PMC free article] [PubMed] [Google Scholar]
- Lee WG, Kim Y-G, Chung BG, Demirci U, Khademhosseini A. Advanced Drug Delivery Reviews. 2010;62:449. doi: 10.1016/j.addr.2009.11.016. [DOI] [PMC free article] [PubMed] [Google Scholar]
- Linder V, Verpoorte E, de Rooij NF, Sigrist H, Thormann W. Electrophoresis. 2002;23:740. doi: 10.1002/1522-2683(200203)23:5<740::AID-ELPS740>3.0.CO;2-7. [DOI] [PubMed] [Google Scholar]
- Liu E, Eisenbarth GS. Clinical Immunology. 2007;125:120. doi: 10.1016/j.clim.2007.08.005. [DOI] [PMC free article] [PubMed] [Google Scholar]
- Ng AHC, Uddayasankar U, Wheeler AR. Analytical and Bioanalytical Chemistry. 2010;397:991. doi: 10.1007/s00216-010-3678-8. [DOI] [PubMed] [Google Scholar]
- Ohashi T, Mawatari K, Sato K, Tokeshi M, Kitamori T. Lab on a Chip. 2009;9:991. doi: 10.1039/b815475a. [DOI] [PubMed] [Google Scholar]
- Okada H, Hosokawa K, Maeda M. Anal. Sci. 2011;27:237. doi: 10.2116/analsci.27.237. [DOI] [PubMed] [Google Scholar]
- Pereira SV, Messina GnA, Raba J. Journal of Chromatography B. 2010;878:253. doi: 10.1016/j.jchromb.2009.05.007. [DOI] [PubMed] [Google Scholar]
- Weigl B, Domingo G, LaBarre P, Gerlach J. Lab on a Chip. 2008;8:1999. doi: 10.1039/b811314a. [DOI] [PMC free article] [PubMed] [Google Scholar]


