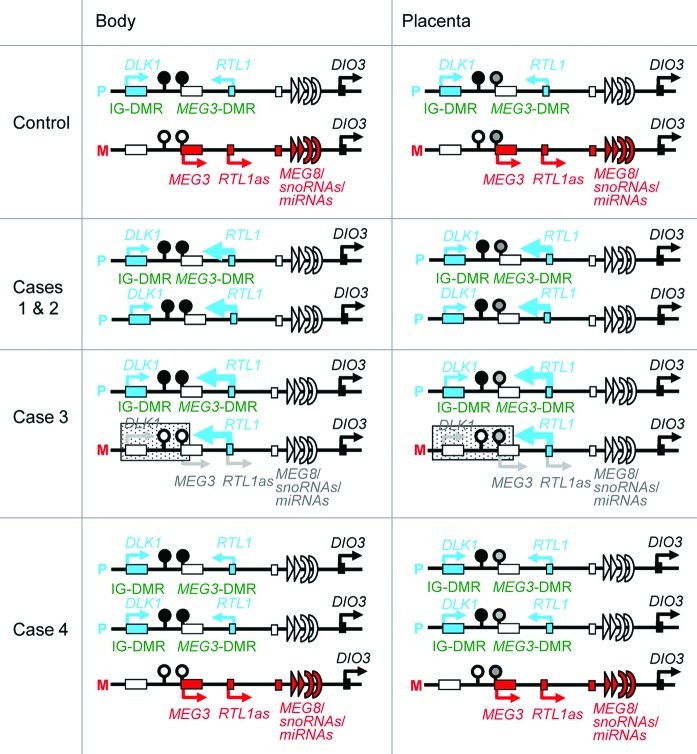
Figure 6. Schematic representation of the chromosome 14q32.2 imprinted region in a control subject, cases 1 and 2 with upd(14)pat, case 3 with a microdeletion (indicated by stippled rectangles), and case 4 with two copies of the imprinted region of paternal origin and a single copy of the imprinted region of maternal origin. This figure has been constructed using the present results and the previous data.2,3 P, paternally derived chromosome; M, maternally derived chromosome. Filled and open circles represent hypermethylated and hypomethylated DMRs, respectively; since the MEG3-DMR is grossly hypomethylated and regarded as non-DMR in the placenta, it is painted in gray. PEGs (DLK1 and RTL1) are shown in blue, MEGs (MEG3, RTL1as, MEG8, snoRNAs and miRNAs) in red, a probably non-imprinted gene (DIO3) in black, and non-expressed genes in white. Thick arrows for RTL1 in cases 1–3 represent increased RTL1 expression that is ascribed to loss of functional microRNA-containing RTL1as as a repressor for RTL1.

An official website of the United States government
Here's how you know
Official websites use .gov
A
.gov website belongs to an official
government organization in the United States.
Secure .gov websites use HTTPS
A lock (
) or https:// means you've safely
connected to the .gov website. Share sensitive
information only on official, secure websites.
