

Abstract
The Infinium Human Methylation450 BeadChip ArrayTM (Infinium 450K) is an important tool for studying epigenetic patterns associated with disease. This array offers a high-throughput, low cost alternative to more comprehensive sequencing-based methodologies. Here we compare data generated by interrogation of the same seven clinical samples by Infinium 450K and reduced representation bisulfite sequencing (RRBS). This is the largest data set comparing Infinium 450K array to the comprehensive RRBS methodology reported so far. We show good agreement between the two methodologies. A read depth of four or more reads in the RRBS data was sufficient to achieve good agreement with Infinium 450K. However, we observe that intermediate methylation values (20–80%) are more variable between technologies than values at the extremes of the bimodal methylation distribution. We describe careful processing of Infinium 450K data to correct for known limitations and batch effects. Using methodologies proposed by others and newly implemented and combined in this report, agreement of Infinium 450K data with independent techniques can be vastly improved.
Keywords: DNA methylation, InfiniumHD array, RRBS, genome-wide, clinical sample, EWAS
Introduction
DNA methylation is the most stable of all epigenetic modifications and regulates transcriptional activity.1,2 During development, the pattern of DNA methylation is dynamic. Differentiated cells develop a stable DNA methylation pattern that regulates tissue-specific transcriptomes.3 However, it is also clear that epigenetic marks, including DNA methylation, are subject to environmental regulation well beyond the point of cell differentiation4 and can be actively modified throughout life and so has potential as a mediator for environmental effects on disease and transgenerational transmission.5,6 There is evidence of DNA methylation changes in response to in utero environment7,8 and early life.9 DNA methylation is substantially changed with age across the life course10 and across relatively small intervals, at least in children.11 Methylation profiling across the whole genome (or methylome) is used as a discovery tool to identify differentially methylated regions important in disease.12 Combination of methylome measures with cohort studies (epigenome wide association studies or EWASs) represents new opportunities to elucidate specific DNA methylation marks that are associated with complex human disease.13,14 The challenge is that of establishing the validity of technologies that are more suitable for use with large samples as well as the development of ideal analytical approaches.
Here we study two commonly used methodologies to measure the methylome in human samples (Infinium 450K and RRBS). Both assays assess methylation at single CpG resolution and producing a quantitative signal. Both utilize sodium bisulfite (NaHSO3) treatment of DNA to convert unmethylated cytosines to uracils.15 Methylated cytosines are protected from conversion. After amplification (which coverts uracils to thymines), the cytosine to thymine signal ratio is proportional to the level of methylation at any given position.
Illumina produce Infinium 450K arrays that use target-specific probes to interrogate individual CpGs in bisulfite converted and amplified DNA. Although the coverage offered by such arrays is far inferior to sequencing-based methods, their throughput, resolution and cost effectiveness has made them an increasingly widely used platform for the first wave of EWASs.13 Infinium 450K arrays contain two different chemistries. Type 1 assays employ two probes per CpG locus. The 3' terminus of each probe is designed to match either the protected cytosine (methylated) or the thymine (converted) base. Type II assays utilize one probe per locus. The 3' terminus of the probe complements the base directly upstream of the query site while a single base extension results in the addition of a labeled G or A base, complementary to either the cytosine or thymine residue, in both probe types. Methylation levels are reported as the ratio of the methylated probe intensity and the overall intensity (sum of the methylated and unmethylated probe intensities), this statistic is known as the β-value and varies between 0–100%.16
As with any high-throughput genomic data, Infinium arrays are prone to technical artifacts. Batch effects have been reported for the Infinium 450K precursor, the Infinium 27K array, which includes only type I assays.17 Single channel adjustment and then normalization on pooled two-color signals was proposed in the release of R package “lumi”18 and was shown to remove mild batch effects and improve data quality. The range of β-values obtained from the Infinium 450K specific type II assays has been observed to be smaller than that of Type I assays. Dedeurwaerder et al.19 suggested a “peak based correction” of the type II range to that of type I. Control probes are included in the Infinium 450K array to, among other purposes, assay the signal from individual channels. Illumina suggest control probe correction of the values from type II assays to take into account any imbalances between the channels.
RRBS involves digestion of genomic DNA with methylation sensitive restriction enzymes, size selection bisulfite conversion and library amplification.20 It targets bisulfite sequencing to a well-defined set of genomic regions with moderate to high CpG density.21 The resulting DNA library is sequenced using NGS approaches. Reads are aligned to the genome and the % methylation values are calculated from the ratio of reads containing an unconverted cytosine at the CpG positions compared with reads containing a thymine.
Good agreement between methylation values produced by the Infinium 27K array and RRBS has been observed before in homogeneous cell line samples.22 Comparison of CpG % methylation values from genomic DNA from the HUES6 human ES cell line assayed by the Infinium 27K array and RRBS returned a Pearson’s r value of 0.92.
Here we study the concordance of methylome profiles generated by the new Infinium 450K array and a modified RRBS methodology in heterogeneous clinical samples, such as may be included in a EWAS study. We find good levels of concordance in the raw data. Agreement between the two techniques is greatly improved by careful processing of the Infinium 450K data to correct known limitations. The newly developed analysis methods are described and new code is made available to the research community. We believe that the results described here are useful to researchers selecting methylome measurement methodologies for EWAS experiments and processing Infinium 450K data from such studies.
Results
CpG Coverage on heterogeneous clinical samples is relatively stable between samples, and technologies overlap by an average of 64,951 CpGs per sample. Methylome data was generated using both Infinium 450K array (n = 72) and RRBS methodology (n = 7) (see Table S1 for sample characteristics and Table S2 for schematic).
The raw data from both methodologies in the seven common samples with no quality cut-offs were compared for CpG coverage (Table 1). The average number of CpGs covered (at any read depth) in the seven samples by RRBS was 6,052,399 (SD = 496,344) and the average number of CpGs shared by both Infinium 450K and RRBS was 104,335 (SD = 8,602). When a read density cut-off of four or more reads was applied to the RRBS data, the average number of CpGs covered was reduced to 2,808,469 (SD = 167,495) and the average number of CpGs shared by both Infinium 450K and RRBS was 64,951 (SD = 3,911).
Table 1. Number of CpGs covered by RRBS and shared with Infinium 450K across the seven samples.
| Sample | Number of CpGs covered by RRBS | Number of CpGs shared with Infinium 450K | Number of CpGs covered by RRBS (Nreads ≥ 4) |
Number of CpGs shared with Infinium 450K (Nreads ≥ 4) |
Pearson R (RRBS Nreads ≥ 4) |
Spearman R (RRBS Nreads ≥ 4) |
|---|---|---|---|---|---|---|
| 1 |
6,715,332 |
113,571 |
2,846,600 |
65,702 |
0.96 |
0.82 |
| 2 |
6,658,349 |
114,336 |
3,027,004 |
69,041 |
0.96 |
0.83 |
| 3 |
6,250,352 |
109,113 |
2,990,478 |
68,749 |
0.96 |
0.84 |
| 4 |
5,838,715 |
101,765 |
2,628,619 |
60,641 |
0.95 |
0.83 |
| 5 |
5,462,059 |
93,562 |
2,607,467 |
61,366 |
0.96 |
0.82 |
| 6 |
5,817,127 |
93,693 |
2,703,504 |
60,815 |
0.96 |
0.81 |
| 7 |
5,624,859 |
104,305 |
2,855,611 |
68,346 |
0.94 |
0.82 |
| Average |
6,052,399 |
104,335 |
2,808,469 |
64,951 |
|
|
| Stdev |
496,344 |
8,602 |
167,495 |
3,911 |
|
|
| Total | 42,366,793 | 73,0345 | 19,659,283 | 454,660 | 0.96 | 0.83 |
The RRBS read density cut-off was set at 4 or more reads. RRBS data had a range of read densities from 1–45,972 (Fig. 1A). Analysis of the correlation between the raw Infinium 450K β-values and RRBS measured methylation values at the different read cut-offs suggested concordance climbs quickly between 1–4 reads (Fig. 1B). Spearman ranked r decreased after 15 reads, assumedly due to reduced n. Four or more reads was enough to achieve reasonable concordance between Infinium 450K and RRBS (i.e., Pearson’s R = 0.96, Spearman R = 0.83) while retaining a data set of 454,660 CpGs for downstream analysis (the data set is the aggregate of CpGs measured by both Infinium and RRBS across all seven samples). Fifty-three percent of the combined data set is represented by type II assays and 47% by type I assays. The four or more reads cut-off is at the lower end of the range used by other researchers, for instance Bock et al.22 used five or more reads, Messiner et al.20 used ten or more reads.

Figure 1. Optimal selection of number of reads quality cut-off in RRBS data. (A) Frequency distribution of number of reads in RRBS data. X-axis is truncated at 200 reads but maximum in data are 45,972. (B) Correlation between Infinium 450K and RRBS values using different read cutoffs for RRBS data, estimated using Pearson R (black squares) and Spearman R (black circles) values. Number of CpGs shared between the two technologies and remaining after read cut-offs are indicated by red stars.
Infinium 450K design concentrates on CpG islands, shores and shelves, while majority of RRBS coverage is within open-sea, at lower read coverage cut-offs. Figure 2 shows the relative proportions of CpG coverage relative to CpG islands as annotated in UCSC. As previously noted,22 RRBS coverage tended toward regions of moderate or low CpG density, while the Infinium 450K design is concentrated at high CpG density. As expected, as higher Nreads cutoffs are implemented, the RRBS coverage of CpG islands increased while open sea coverage decreased. Interestingly, the proportion of shores and shelves covered remained relatively constant. The overlap set used for further analysis has an increased CpG island proportion compared with either of the two methods independently.

Figure 2. Pie charts of CpG coverage in relation to CpG island location. (A) RRBS data average for all seven samples at Nreads ≥ 1. (B) RRBS data average for all seven samples at Nreads ≥ 4. (C) RRBS data average for all seven samples at Nreads ≥ 10. (D) Infinium 450K assays passing QC. (E) Shared data between RRBS (Nreads ≥ 4) and Infinium 450K (n = 454,660). (F) Relationship of proportion CpG island coverage and Nreads cutoff.
Both data sets had a bimodal frequency distribution. Both the Infinium 450K and RRBS data sets for the 454,660 shared CpGs had a bimodal frequency distribution, approaching a β-distribution (Fig. 3). The RRBS distribution was irregular and “spiky” due to tied values produced by the reduced resolution of continuous methylation values at low read depth. In the RRBS frequency distribution the peaks were located at 0–0.25% and 99.75–100%. In the Infinium 450K type I assay data the peaks were at 1.75–2.25% and 97.25–97.75%. The Infinium 450K data shows a shorter range for the type II assays with peaks at 5.25–5.75% and 85.75–86.25%. This phenomenon has previously been observed.19,23

Figure 3. Histograms of % methylation value frequency in (A) RRBS data and (B) Infinium 450K data for the 454,660 CpGs covered by both technologies. Data was plotted into 201 bins stepped by 0.5 between 0% and 100%. For RRBS data, y-axis was truncated for clarity, the peak at 0–0.25% extends to 180,000 and the peak at 99.75–100% extends to 28,700. For Infinium 450K data, type I assay data was indicated in red and type II in blue.
An approximately linear relationship was observed between Infinium 450K and RRBS data, which was stable across samples. The raw β values were compared with the RRBS data with Nreads ≥ 4. An approximately linear relationship was observed significant in both Spearman and Pearson correlations (Fig. 4A). The slope of the fitted line was 0.83. A similar relationship was observed across all the seven samples studied independently (Table 1). We are aware that neither Pearson’s nor Spearman correlation statistics are appropriate for this data and results could be misleading. The former assumes a joint normal distribution24 an assumption that is obviously violated by our data (Fig. 3) and so probably overestimates the correlation. The latter is sensitive to tied values in the data,25 which is a feature of the “spiky” distribution of RRBS data and so probably underestimates the correlation. Also, both methods explicitly assume a linear relationship between the two variables. To examine the putatively nonlinear dependency between Infinium 450K and RRBS data we applied maximal information coefficient (MIC) is a newly proposed method for discovering nonlinear dependency in biological data sets.13 The MIC (strength) value lies between 0 to 1 with a perfect deterministic relation having a value of 1, totally independent relations having a value of 0 while noisy relations lie somewhere in between. The strength of the interdependency between RRBS (Nreads ≥ 4) and the Infinium 450K data are 0.81. Maximum information coefficient (MIC) methodology does not assume a joint normal distribution or rank the data points, however the power and robustness under different n of the method is under debate.14

Figure 4. The concordance of Raw Infinium 450K data vs. RRBS data (A) A scatter plot of % methylation values from RRBS (x-axis) and % methylation values from Infinium 450K (y-axis) over a density cloud. Density cloud is generated by the smoothed two-dimensional histogram using 50 equally spaced bins in both directions. A random selection of 2000 data from type I probes is plotted as red dots and another random selection of 2000 data from type II probes is plotted as blue dots. (B) Bland-Altman plot for raw Infinium data compared with RRBS Nreads ≥ 4. Average % methylation at each CpG from both methods is on the x-axis. Difference in % at each CpG over the two methods is on the y-axis. Data from Type I assays is shown in red, type II is shown in blue.
As an alternative method to quantify agreement between the methylome measures, Bland-Altman plots (difference between the two methods plotted against the mean values from both methods)15 were produced. Figure 4B showed greater discordance at intermediate methylation levels i.e. 20–80%, an observation also made by Roessler et al.10 Also noticeable in the plots is an upward trend in the type II assay values suggestive of divergence at high methylation values.
Processing of Infinium 450K data by novel proposed pipeline, produces a step-wise improvement in agreement with RRBS. Infinium 450K data was signal extracted for .idat files to non-normalized data in GenomeStudioTM. To correct color imbalance, values were normalized to values from control probes and background subtracted (script available in Supplemental material). After these intra-sample normalization procedures, M-values (logit transformation)16 were calculated. The type II M-value range was fitted to the type I range as suggested by Dedeurwaerder et al.6 and coded in R (script available in Supplemental material and submitted to Bioconductor). β-values were then calculated. Finally inter-sample normalization was performed by quantile normalization. The concordance of the processed Infinium 450K data with RRBS was still significant (Table 2) but now the fitted line had an improved slope of 0.93 (Fig. 5A) and the Bland-Altman plot (Fig. 5B) showed that the upward trend for the type II assay datapoints no longer exists and now overlays the type I assay data.
Table 2. Number of CpG % methylation values showing agreement within 5%, 10% and 20% ranges, between Infinium 450K and RRBS (Nreads ≥ 4) data, at different levels of Infinium processing.
| Difference Range (n = 454,660) | within 20% | within 10% | within 5% | Spearman's Rank R | Pearson's R2 | Slope | MIC | |||
|---|---|---|---|---|---|---|---|---|---|---|
|
Probe Type |
Type I |
Type II |
Type I |
Type II |
Type I |
Type II |
|
|
|
|
|
Raw Data |
196,937 |
217,721 |
172,003 |
161,520 |
132,267 |
75,144 |
0.83 |
0.92 |
0.83 |
0.81 |
| 93% |
90% |
81% |
67% |
62% |
31% |
p < 0.001 |
p < 0.001 |
|
|
|
|
After color adjustment |
197,089 |
221,887 |
173,872 |
165,158 |
139,888 |
73,510 |
0.83 |
0.92 |
0.87 |
0.81 |
| 93% |
92% |
82% |
68% |
66% |
30% |
p < 0.001 |
p < 0.001 |
|
|
|
|
After color and Type II adjustment |
197,089 |
225,828 |
173,872 |
192,004 |
139,888 |
144,070 |
0.83 |
0.93 |
0.92 |
0.81 |
| 93% |
93% |
82% |
79% |
68% |
60% |
p < 0.001 |
p < 0.001 |
|
|
|
| After color, Type II and QN |
197,444 |
226,386 |
175,211 |
195,114 |
143,022 |
149,216 |
0.83 |
0.93 |
0.93 |
0.81 |
| 93% | 94% | 82% | 81% | 67% | 62% | p < 0.001 | p < 0.001 | |||
The greatest number of CpGs agreeing at every level, between processing level, are bolded. Overall correlation statistics are also shown (n = 454,660).

Figure 5. Processed Infinium 450K data vs. RRBS data. (A) A scatter plot of % methylation values from RRBS (x-axis) and % methylation values from Infinium 450K (y-axis) over a density cloud. Density cloud is generated as in Figure 4A. (B) Bland-Altman plot for processed Infinium 450K data compared with RRBS Nreads ≥ 4 is generated as in Figure 4B.
To provide a quantitative measure of agreement between the two technologies, the number of CpGs with values returned from Infinium 450K and RRBS that fall within 20%, 10% and 5% of each other, were counted at each stage of the Infinium processing. At all levels we were able to demonstrate a stepwise improvement in agreement (Table 2), with the most dramatic improvement resulting from the type II assay adjustment to the range of type I range. In the raw data, 62% of the type I assays and 31% of the type II assays returned values within 5% of the RRBS value for the same CpG. After processing 67% of type I and 62% of type II assays returned values within 5% of the RRBS value.
To determine if the relatively generous Nreads ≥ 4 cut-off in the RRBS data caused much lower levels of agreement due to low resolution or erroneous values, we repeated the analysis at Nreads ≥ 10 (Table 3). There was a slight improvement in the proportion of CpGs agreeing and the step-wise improvement during Infinium data processing was repeated.
Table 3. Number of CpG % methylation values showing agreement within 5%, 10% and 20% ranges, between Infinium 450K and RRBS (Nreads ≥ 10) data, at different levels of Infinium processing.
| Difference range (n = 387,789) | Within 20% | Within 10% | Within 5% | Spearman's rank R | Pearson's R2 | Slope | MIC | |||
|---|---|---|---|---|---|---|---|---|---|---|
|
Probe Type |
Type I |
Type II |
Type I |
Type II |
Type I |
Type II |
|
|
|
|
|
Raw Data |
166,565 |
192,635 |
147,047 |
145,040 |
114,131 |
69,159 |
0.83 |
0.93 |
0.84 |
0.83 |
| 94% |
92% |
83% |
69% |
64% |
33% |
p < 0.001 |
p < 0.001 |
|
|
|
|
After color adjustment |
166,723 |
195,934 |
148,589 |
148,186 |
119,916 |
67,879 |
0.83 |
0.93 |
0.88 |
0.83 |
| 94% |
93% |
84% |
71% |
67% |
32% |
p < 0.001 |
p < 0.001 |
|
|
|
|
After color and Type II adjustment |
166,723 |
199,332 |
148,589 |
172,073 |
119,916 |
130,431 |
0.83 |
0.94 |
0.93 |
0.83 |
| 94% |
95% |
84% |
82% |
67% |
62% |
p < 0.001 |
p < 0.001 |
|
|
|
| After color, Type II and QN |
167,026 |
199,786 |
149,690 |
174,764 |
122,500 |
135,190 |
0.83 |
0.94 |
0.95 |
0.83 |
| 94% | 95% | 84% | 83% | 69% | 64% | p < 0.001 | p < 0.001 | |||
The greatest number of CpGs agreeing at every level, between processing level, are bolded. Overall correlation statistics are also shown (n = 387,789).
Next, to determine if the individual data processing steps were additive in their effects, we applied each independently to the raw data. Type II adjustment alone increases the number of type II assays within 5% of the RRBS data (Nreads ≥ 4) from 75,144 (31%) to 144,968 (60%). This is by far the greatest improvement in concordance resulting fro.=m a single processing step. When all steps are combined the number is 189,216 (62%) (Table S3), showing that the effects of processing are additive in improving concordance, although the effect of color adjustment is small compared with that of type II adjustment. Type I assays are not affected by type II adjustment. The processing step which most improves the agreement of the type I assays within 5% of the RRBS data (Nreads ≥ 4) is color adjustment [139,888 (66%) compared with 132,267 (62%) in the raw data]. When all processing steps are combined 143,022 (67%) of type I assays agree within 5% of the RRBS data (Nreads ≥ 4) (Table S3). The same pattern is seen when comparing data at RRBS Nreads ≥ 10 (Table S4).
The control normalization procedure implemented above is very similar to that contained within the default processing (control normalization) in the GenomeStudioTM Software. However, the GenomeStudio algorithm also includes an inter-sample normalization step, randomly selecting a sample as the reference. This is inconvenient as the β values change slightly between each processing run. For this data set, the GenomeStudio algorithm performed similarly but consistently worse in terms of agreement levels at 5%, 10% and 20% than the simpler script above (Table S4).
Very recently an alternative method for typeI/typeII assay distribution adjustment called SWAN (subset-quartile within array normalization) was published.26 It is an interesting point of difference that whist Dedeurwaerder et al. assume the type I distribution is “correct” and fit the type II value distribution to that of type I, Maksimovic et al. adjust both type I and type II values. For this data set, the SWAN processed data agreed less with RRBS than data processed with the full processing pipeline described above (Tables S3 and S4) for all but the type I 20% bracket. Another interesting comparison is with SWAN processed data and Type II adjustment on the raw data, here the picture is more mixed but the type II adjustment consistently produces higher levels of agreement in the 5% bracket. Therefore we can conclude that the peak correction method is more appropriate to this particular data set than SWAN. We hypothesize that this is because the range of the type I assay data are quite accurate,19,26 while the range of the more numerous type II assay data are less so. Fitting the type II range to the type I standard, as in peak-based correction results in a “type I-like” distribution. SWAN normalizes both assay types together and so returns a more “type II-like” distribution, as type II assays outnumber type I. As type II adjustment (either by peak-correction or SWAN) resulted in the greatest improvement in concordance, the selection of the most appropriate methodology at this step is critical.
Even after processing, the strikingly greater degree of discordance at intermediate methylation values is still present. An ANOVA test confirms there is a significant difference (p < 0.0001, F-statistic = 84159.13) in the absolute differences between the assays at 0–20%, 20–80% and 80–100% processed b value ranges. The median absolute difference at 20–80% is 12.89 compared to 2.03 and 4.89 at 0–20% and 20–80% respectively (Table 4). This is also true of the SWAN processed data (Table S5). In agreement with this observation, CpG islands which tend to be hypomethylated (median methylation values = 3% so tend to be within the highly concordant 0–20% category) have higher levels of agreement between technologies than CpG island shores (median methylation values 28–29%), shelves (median methylation values 84–85%) and open sea (median methylation value 82%) (Table 5).
Table 4. Number of CpG % methylation values showing agreement or not (within 10%), between processed Infinium 450K and RRBS data (Nreads ≥ 4), at different % methylation value ranges.
| Infinium β value range |
Difference < 10% |
Difference > 10% |
Total | Median absolute difference | Standard deviation of absolute difference |
|---|---|---|---|---|---|
|
x ≤ 20% |
257,897 |
14,671 |
272,568 |
2.00 |
3.96 |
| |
95% |
5% |
|
|
|
|
20% < x ≤ 80% |
29,573 |
46,720 |
76,293 |
13.24 |
12.44 |
| |
39% |
61% |
|
|
|
|
80% < x ≤ 100% |
82,855 |
22,944 |
105,799 |
4.94 |
9.31 |
| 78% | 22% |
Table 5. Number of CpG % methylation values showing agreement (within 10%), between processed Infinium 450K and RRBS data (Nreads ≥ 4), at different CpG location categories.
| CpG location category | Within 10% | Total | % Within 10% | Average methylation value overall | Median methylation value | Standard deviation |
|---|---|---|---|---|---|---|
| Islands |
238,359 |
271,566 |
88% |
16 |
3 |
29 |
| N Shore |
32,959 |
43,640 |
76% |
41 |
28 |
38 |
| S Shore |
30,802 |
40,249 |
77% |
42 |
29 |
38 |
| N Shelf |
8,724 |
12,815 |
68% |
73 |
84 |
28 |
| S Shelf |
7,200 |
10,478 |
69% |
73 |
85 |
28 |
| Open Sea | 53,288 | 75,912 | 70% | 66 | 82 | 33 |
Removal of batch effects contributes to improved concordance of processed Infinium 450K data and RRBS. The color adjustment and inter-sample quantile normalization steps of the Infinium 450K data processing, which should theoretically improve artifactual batch effects, resulted in greater agreement with RRBS data (Tables 2 and 3). We have previously noted batch effects by array hybridization in Infinium 450K data (unpublished observations). Therefore, we interrogated 72 umbilical cord samples run across six arrays. This sample set includes the seven samples also studied by RRBS and described above. The number of CpGs with differential methylation values (p < 0.01) between the array batches was calculated by ANOVA. In the unprocessed data 163,438 (38%) CpGs were differentially methylated between the arrays. After processing, this number was reduced to 58,532 (14%). After FDR correction the numbers at p ≤ 0.2 were 233.650 (55%) before processing and 123,611 (29%) after processing. (Fig. 6; Tables S6–7). Therefore, although an array-batch effect was still present and may necessitate batch-effect-removal methodologies such as “COMBAT,”17,27 it was much reduced by data processing. To determine if processing had reduced variation in all directions (not just batch), the ANOVA test was also applied to gender and gestational age, phenotypes expected to associate with differential methylation (refs 28 and 29 and refs. 30 and 31, respectively). For gender, methylation levels at 29,642 (7%) of the CpGs were associated in the raw data and 48,436 (11%) were associated in the processed data. After FDR correction (p ≤ 0.2) 41,108 (10%) assays were differential before processing and 73,595 (17%) were differential after processing. For gestational age 3,842 (0.9%) CpGs had methylation levels differential for gestational age (< 37 weeks or > 38 weeks) in the raw data, compared with 8,454 (2%) probes in the processed data. After FDR correction (p ≤ 0.2) 104 (0.02%) were differential before processing and 179 (0.04%) were differential after processing. Therefore, one of the factors improving the concordance between the Infinium 450K processed data and RRBS data, seems to be reduction in the batch effects in Infinium 450K data. The resulting decrease in batch-related variation appears to have the advantage of increasing power to detect differential methylation associating with biological phenotypes. Further study is warranted on the robustness and biological implications of methylome variation in umbilical cord tissues with these and other phenotypes.

Figure 6. Percentage of assays with methylation values significantly associated with: array on which sample was run, gestational age (GA) or gender; before (blue bars) and after (red bars) data processing, in the set of 72 samples.
Discussion
The Infinium 27K array produces methylation estimates with a good concordance to the results from other methylome estimation techniques.22 The expanded Infinium 450K array incorporating the new type II assays, has a high level of agreement with the 27K,16,32 and detects differential methylation with high sensitivity.32 Bibikova et al.16 showed a linear correlation measured by Pearson’s R2 of 0.95 and 0.96 over 189,821 and 167,996 CpGs in a normal and tumor sample respectively, between whole genome bisulfite sequencing (WGBS) and Infinium 450K. This is comparable to Pearson’s R2 statistic returned by our data set (R2 = 0.94, n = 387,789) at the Nreads ≥ 10 cut-off the authors applied to the WGBS data set. The authors showed an error distribution containing 10,000s of CpGs with differences between WGBS and Infinium 450K of more than 20%. Roessler et al.23 found 63.8% of the 340 CpGs studied in cell lines and 60.5% of the 352 CpGs studied across primary tumor specimens showed a difference between Infinium 450K and pyrosequencing of less than 10%. This is a lower level of agreement than we see in our raw data (73% of 454,660 assays agree within 10%) and much lower than after Infinium 450K data processing (82% of 454,660 agree within 10%), Table 2. The discrepancy could be due to the less sensitive nature of the pyrosequencing comparison or the more variable nature of the malignant tissues under study. The authors also found little improvement in the concordance of their Infinium 450K data with pyrosequencing after type II peak correction. This may be due to the small number of CpGs studied.
Although Infinium 450K arrays are primarily designed for comparison between samples, not quantification of methylation in a single sample, it is important to demonstrate a linear relationship with methylation with minimal biases among assays. In a typical comparative study, values returned for an individual assay are first compared with each other to detect methylation differences, so differences in range or sensitivity between assays seem less important. However, subsequently the differential values for each assay (e.g., p-value from a two-group test, regression coefficient, fold change or absolute methylation difference) are ranked against each other to determine the most promising changes for further validation or as input for pathway analysis. In the raw Infinium 450K data studied here, the range of the type II assays is smaller than that for type I; consequently the p-values are likely to be higher and the fold changes lower for type II compared with type I. This would result in the type II assays tending to achieve lower ranks than type I assays, and so bias and reduced power in the study. Both the type II range adjustment proposed by Dedeurwaerder et al.19 and executed in this study and the SWAN method proposed by Maksimovic et al.26 will remove these artifacts and so allow an unbiased ranking of assay signals.
A related point is that batch effects have been demonstrated on the Infinium 27K arrays17 due to type I assays from different hybridizations (i.e., arrays) having different ranges between the red and green signals. These effects are likely to be greater on the Infinium 450K arrays due to additional scope for the color balance specific to each hybridization run to affect the reported β values (type II assays rely on a comparison of red and green signals). Color balance adjustments as suggested by others17,18 are included in the processing methodology described here. Processing on this data set reduced batch effects by array and appeared to increase capacity to detect true phenotypic variation. Methods like these will be essential to enable multi-array, multi-day and multi-center studies.
It is very likely that 2nd and 3rd generation sequencing approaches to methylome estimation will eventually succeed Infinium 450K arrays. The RRBS approach described here offers approximately six times the coverage of the Infinium 450K array. The processing time for 48 samples on Infinium arrays (including data analysis) is 5 days, whereas the RRBS analysis takes about 14 days per 8–16 samples. Infinium 450K requires less starting DNA (between 0.5 to 2 µg, compared with 5µg for RRBS) and is compatible with DNA samples extracted from FFPE preserved tissue. Currently the Infinium 450K offers a high-throughput low cost alternative for large studies, enabling the processing of the hundreds or thousands of samples required for EWAS.13,33 We observe that in clinical samples intermediate methylation values (20–80%) are more variable between technologies than values at the extremes of the bimodal methylation distribution. This is in agreement with the findings of Roessler et al.23 but demonstrated across many more CpGs and using a different comparator technology (RRBS as opposed to pyrosequencing). As Infinium 450K is the common technique in these two studies it seems probable that the higher error rate at intermediate methylation values is a feature of the Infinium 450K technology.
A limitation of our study is that both the comparator techniques depend on bisulfite conversion, which is vulnerable to both inappropriate and failed conversion at a rate of up to 4%.34,35 The two data sets are produced from independent bisulfite conversions so conversion errors may account for some of the mismatch observed. Also our combined data set is biased toward CpG islands (Fig. 2E). Both methodologies may be prone to artifacts at high CpG densities due to multiple CpGs being present in the probe or read, causing hybridization bias or alignment error, respectively. Hence the agreement calculated from our combined data set may underestimate the agreement that would be found if both technologies sampled the whole genome. Conversely, CpG islands are usually hypomethylated skewing our data set to methylation values in the 0–20% methylation range where higher levels of agreement were found (Table 4). This phenomenon seems to have a stronger effect than the artifacts found at high CpG densities as levels of agreement between Infinium 450K and RRBS are indeed higher in CpG islands, than in other locations (Table 5).
It should be noted that this data describes extremely heterogeneous clinical samples. Umbilical cord tissue (often the only somatic tissue source available at birth) includes multiple cell types and so measured methylation levels cannot be attributed to specific cell lineages but are instead a composite of methylation in all the cell types assayed. In this study the methylomes of two pieces of the same cord were assayed using separate techniques. Some discordance may be expected as the two tissue pieces may have different proportions of cell types. However, the agreement we saw is in line with what other investigators have seen using two methods to measure the same tissue sample. Therefore, our results suggest that soma-wide, individual-specific methylation variation may be detectable even in this heterogeneous tissue.
In conclusion, methylome data generated on heterogeneous clinical samples shows very good reproducibility between the Infinium 450K and RRBS platforms. We have demonstrated that with careful processing, using methodologies proposed by others16,18,19 and newly implemented and combined by us, linearity of Infinium 450K data against independent techniques can be vastly improved. However, intermediate β values show more variability from RRBS than values at the extremes. Infinium 450K and RRBS techniques are complimentary in that they sample different subsets of the methylome although both are biased toward CpG islands. All current technologies for assessing genome wide DNA methylation have their unique advantages. Factors such as coverage, processing time and the sensitivity desired at intermediate values of methylation will be key determinants for choosing the most suitable approach for EWAS studies.
Methods
Samples
Seven umbilical cord samples were from babies born at the KK Women’s and Children’s Hospital (KKH) and the National University Hospital (NUH), in Singapore. These hospitals are part of the GUSTO birth cohort study. Written parental consent to participate in the study was given and hard copies are stored by the GUSTO data team. Ethical approval for the study and the consent forms and contents was granted, by the ethics boards of both KKH and NUH, which are centralized Institute Review Board (CIRB) and Domain Specific Review Board (DSRB), respectively. Gestational age was defined from a dating ultrasound (10–12 weeks) followed by an additional scan at 18–22 weeks. The babies were all of Chinese ethnic origin and male. They were conceived without assisted conception techniques. They were within the normal birth weight range (2734–3565 g) and had gestational ages classified as near-term (37 weeks–39 weeks and 6 days). The maternal ages varied between 26–36 years.
Sample handling
DNA from 72 umbilical cord samples (Table S1 for demographic information), were run across six Infinium arrays in three different experimental batches. Seven of the umbilical cord samples were interrogated by both Infinium 450K arrays and RRBS. The seven samples were handled completely separately for Infinium and RRBS, i.e., one tissue piece was processed for Infinium 450K and one was processed for RRBS. Sample 1 is the only exception, for sample 1 the same DNA extraction was used in both the Infinium and RRBS. In the first experimental day sample 1 was interrogated on Infinium450K in a batch that included 21 other samples, not also interrogated by RRBS. On the second experimental day, samples 2, 3 and 4 were interrogated on Infinium450K alongside 19 other samples, not also interrogated by RRBS. On the third experimental day, samples 5, 6 and 7 were interrogated on Infinium 450K, alongside 19 other samples not also interrogated by RRBS. On each experimental day two Infinium450K arrays were run. For the second experimental day, samples 2 and 4 were run on the same array while sample 3 was run on a different array. For the third experimental day samples 5 and 6 were run on the same array, while sample 7 was run on a different array (see Table S1 for sample characteristics and Table S2 for schematic).
Infinium 450K methylation assay.
Genomic DNA methylation analysis followed the manufacturers’ instructions. After extraction of genomic DNA from frozen umbilical cord specimens according to standard procedures, 1 mg was bisulfite converted using EZ-96 DNA Methylation™ Gold Kit (Catalog No.: D5007, Zymo Research). Successful conversion was confirmed via methylation-specific PCR prior to proceeding with subsequent steps of the Infinium assay protocol. The bisulfite converted genomic DNA was isothermally amplified at 37°C for 22hrs, enzymatically fragmented, purified and hybridized on an Infinium® HumanMethlyation 450 BeadChip (C No.: WD-314–1002, Illumina Inc.) at 48°C for 18 h. After which, the BeadChip was then washed to remove any un-hybridized or non-specific hybridized DNA. Labeled single-base extension was performed on primers hybridized with DNA, and the hybridized DNA was removed. The extended primers were stained with multiple layers of fluorescence, the BeadChip was then coated using a proprietary solution and scanned using the Illumina® iScan system. The image data were processed with the Genome Studio™ Methylation Module software.
Infinium 450K data processing.
Signal extraction was performed in GenomeStudioTM Methylation Module on the intensity files (.idat) produced by the Illumina iSCAN system. Raw β values were extracted from Genome studio without further data processing (i.e., no background subtraction or normalization).
CpGs with two beads or less for either methylated or unmethylated signal, for any sample; or with signal detection p-values (calculated from the individual bead intensities) more than 0.05, for any sample were discarded for all samples. 1.9% of the data was removed at this step, leaving 129,236 type1 probes and 347,123 type II probes for subsequent analysis.
Full data (i.e., both signals and control profile file) were also extracted from GenomeStudio for further processing. Signals were classified as red (Signal A for type II and red channel type I) or green (Signal B for type II and green channel type I). The green signals were normalized to the red channel signals by multiplying them by the product of the red channel control value divided by the green channel control value. Control values were obtained from the control profile file. Background subtraction was performed on the assays from both channels using the negative probe control values (the green negative control value was adjusted in the same way).
Green channel signal: 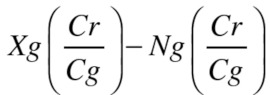
|
Red channel signal: Xr-Nr
Where Xg and Xr are the green and red channel signals, respectively, Cg and Cr are the normalization control values from the control profile for green and red channels, respectively, and Ng and Nr are the negative control values for the green and red channels, respectively. R protocol is supplied in Supplemental materials.
At this point, β-values were calculated for further analysis. β-values are the ratio of the methylated probe intensity and the overall intensity, β-value for an ith interrogated CpG site:
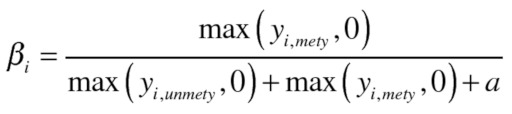 |
Where yi,methy and yi,unmethy are the intensities measured by the ith methylated and unmethylated probes respectively, averaged over the replicate beads. a is a constant offset, by default 100. Therefore β-values range between 0–1 with 0 representing no methylation and 1 representing 100% methylation. R protocol is supplied in the Supplemental Materials.
β-values were further processed to scale the % methylation range of the type2 probes to the type 1 probes using the procedure suggested by reference 19, R protocol is supplied in the Supplemental Materials.
RRBS.
The full details of the experimental procedure for RRBS are elaborated in Lee YK, 2012, submitted. Briefly, 5 µg genomic DNA was fragmented by sequential restriction enzyme digestion for 2 h each by 150 U each of MspI and TaqαI (Catalog Nos.: R0106S and R0149M, New England Biolabs) at optimal temperatures, according to manufacturer’s instructions. The digested product was purified with the QIAquick PCR Purification Kit (Catalog No: 28106, QIAGEN GmbH). End-repair and adaptor ligation were performed using the ChIP-Seq Sample Preparation Kit (Catalog No.: IP-102-1001, Illumina). Illumina’s RRBS for Methylation Analysis protocol was followed, except that 10 µL of the methylation adaptor oligo was used and the ligation was performed for 15 min at 20°C in the adaptor-ligation step. The purified fragments were then bisulphite treated using the EZ-96 DNA Methylation-Gold Kit (Catalog No.: D5007, Zymo Research), according to manufacturer’s instructions. The converted DNA was amplified with 1x reaction buffer, additional 1.5 mM of MgCl2, 300 µM of dNTP mix, 500 nM each of PCR primer PE 1.0 and 2.0, and 2.5 U of HotStarTaq DNA polymerase. The thermocycling condition was 15 min at 94°C for heat activation, and 8–12 cycles of 20 sec at 94°C, 30 sec at 65°C and 30 sec at 72°C, followed by a 5 min final extension at 72°C. The enriched fragments were purified by gel electrophoresis and quantified by Agilent 2100 Bioanalyzer (Agilent Technologies). Sequencing was performed on the Illumina Genome Analyzer IIx platform, as per manufacturer’s instructions. Data analysis was performed using an in-house developed pipeline (Lee YK, 2012, submitted). Briefly, the paired-end 36 nt reads were filtered based on their Phred scores, using a cut off of 30, which indicates a base calling error of approximately 0.001. All reads were then converted in silico based on their C/G base count ratios. Two reference genomes were created, obtained by either converting all cytosines to thymines, or all guanines to adenosines. The converted reads were aligned to both genomes using the Bowtie algorithm.36 Read mapping efficiency obtained was between 60–70% of the filtered reads. Bisulfite conversion efficiency was higher [estimated by Bisulfite Conversion Rate = (nonCpG C’T)/ (nonCpG C’C + nonCpG C’T) *100%] than 99% in all cases.
Polymorphisms overlapping with CpGs may introduce abnormalities. CpG sites with percentage of dinucleotides other than “CG” or “TG” greater than 20% of all reads were excluded from further analysis.
CpG location mapping.
The genomic coordinates of CpG Islands were downloaded from UCSC (hg 19, table: cpgIslandExt, total: 28,691, accessed on: 10th May, 2012). CpG Island shores were defined as up to 2-kb regions from the CpG Island Start or End as per convention.32,37,38 CpG Island shelves were next defined as another 2 kb from the shore boundaries, as specified in Table 1: Group Methylation Profile Table, Infinium HD Assay in GenomeStudio Methylation Module v1.8 User Guide from Illumina. CpGs upstream of CpG Islands were prefixed as North (N) while downstream CpGs were prefixed as South (S).
Data visualization.
High density scatter plots (Figs. 4A and 5A) were generated in Matlab using a smoothed density method.39 Other plots were also generated in Matlab using built-in functions.
Supplementary Material
Glossary
Abbreviations:
- Infinium 450K
Infinium Human Methylation450 BeadChip ArrayTM
- RRBS
reduced representation bisulfite sequencing
- EWAS
epigenome-wide association study
- CpG
cytosine followed by guanine in DNA sequence
- SD
standard deviation
- MIC
maximal information coefficient
- beta value
% methylation value calculated from Infinium array (follows beta distribution)
- M value
logit transformation of beta value
- ANOVA
analysis of variance
- WGBS
whole genome bisulfite sequencing
Disclosure of Potential Conflicts of Interest
No potential conflicts of interest were disclosed.
Financial Disclosures
The GUSTO Cohort is supported by a Translational Clinical Research Flagship program grant from the Singapore National Medical Research council. SICS Investigators are supported in part through Agency for Science Technology and Research (A*STAR) funding.
Supplemental Materials
Supplemental materials may be found here: www.landesbioscience.com/journals/epigenetics/article/22102
Footnotes
Previously published online: www.landesbioscience.com/journals/epigenetics/article/22102
References
- 1.Jones PA. Functions of DNA methylation: islands, start sites, gene bodies and beyond. Nat Rev Genet. 2012;13:484–92. doi: 10.1038/nrg3230. [DOI] [PubMed] [Google Scholar]
- 2.Deaton AM, Bird A. CpG islands and the regulation of transcription. Genes Dev. 2011;25:1010–22. doi: 10.1101/gad.2037511. [DOI] [PMC free article] [PubMed] [Google Scholar]
- 3.Cedar H, Bergman Y. Programming of DNA methylation patterns. Annu Rev Biochem. 2012;81:97–117. doi: 10.1146/annurev-biochem-052610-091920. [DOI] [PubMed] [Google Scholar]
- 4.Bird A. Perceptions of epigenetics. Nature. 2007;447:396–8. doi: 10.1038/nature05913. [DOI] [PubMed] [Google Scholar]
- 5.Hanson M, Godfrey KM, Lillycrop KA, Burdge GC, Gluckman PD. Developmental plasticity and developmental origins of non-communicable disease: theoretical considerations and epigenetic mechanisms. Prog Biophys Mol Biol. 2011;106:272–80. doi: 10.1016/j.pbiomolbio.2010.12.008. [DOI] [PubMed] [Google Scholar]
- 6.Feinberg AP. Epigenetics at the epicenter of modern medicine. JAMA. 2008;299:1345–50. doi: 10.1001/jama.299.11.1345. [DOI] [PubMed] [Google Scholar]
- 7.Godfrey KM, Sheppard A, Gluckman PD, Lillycrop KA, Burdge GC, McLean C, et al. Epigenetic gene promoter methylation at birth is associated with child’s later adiposity. Diabetes. 2011;60:1528–34. doi: 10.2337/db10-0979. [DOI] [PMC free article] [PubMed] [Google Scholar]
- 8.Heijmans BT, Tobi EW, Stein AD, Putter H, Blauw GJ, Susser ES, et al. Persistent epigenetic differences associated with prenatal exposure to famine in humans. Proc Natl Acad Sci U S A. 2008;105:17046–9. doi: 10.1073/pnas.0806560105. [DOI] [PMC free article] [PubMed] [Google Scholar]
- 9.McGowan PO, Sasaki A, D’Alessio AC, Dymov S, Labonté B, Szyf M, et al. Epigenetic regulation of the glucocorticoid receptor in human brain associates with childhood abuse. Nat Neurosci. 2009;12:342–8. doi: 10.1038/nn.2270. [DOI] [PMC free article] [PubMed] [Google Scholar]
- 10.Heyn H, Li N, Ferreira HJ, Moran S, Pisano DG, Gomez A, et al. Distinct DNA methylomes of newborns and centenarians. Proc Natl Acad Sci U S A. 2012;109:10522–7. doi: 10.1073/pnas.1120658109. [DOI] [PMC free article] [PubMed] [Google Scholar]
- 11.Alisch RS, Barwick BG, Chopra P, Myrick LK, Satten GA, Conneely KN, et al. Age-associated DNA methylation in pediatric populations. Genome Res. 2012;22:623–32. doi: 10.1101/gr.125187.111. [DOI] [PMC free article] [PubMed] [Google Scholar]
- 12.Harris RA, Wang T, Coarfa C, Nagarajan RP, Hong C, Downey SL, et al. Comparison of sequencing-based methods to profile DNA methylation and identification of monoallelic epigenetic modifications. Nat Biotechnol. 2010;28:1097–105. doi: 10.1038/nbt.1682. [DOI] [PMC free article] [PubMed] [Google Scholar]
- 13.Rakyan VK, Down TA, Balding DJ, Beck S. Epigenome-wide association studies for common human diseases. Nat Rev Genet. 2011;12:529–41. doi: 10.1038/nrg3000. [DOI] [PMC free article] [PubMed] [Google Scholar]
- 14.Feinberg AP. Genome-scale approaches to the epigenetics of common human disease. Virchows Arch. 2010;456:13–21. doi: 10.1007/s00428-009-0847-2. [DOI] [PMC free article] [PubMed] [Google Scholar]
- 15.Hayatsu H, Wataya Y, Kai K, Iida S. Reaction of sodium bisulfite with uracil, cytosine, and their derivatives. Biochemistry. 1970;9:2858–65. doi: 10.1021/bi00816a016. [DOI] [PubMed] [Google Scholar]
- 16.Bibikova M, Barnes B, Tsan C, Ho V, Klotzle B, Le JM, et al. High density DNA methylation array with single CpG site resolution. Genomics. 2011;98:288–95. doi: 10.1016/j.ygeno.2011.07.007. [DOI] [PubMed] [Google Scholar]
- 17.Sun Z, Chai HS, Wu Y, White WM, Donkena KV, Klein CJ, et al. Batch effect correction for genome-wide methylation data with Illumina Infinium platform. BMC Med Genomics. 2011;4:84. doi: 10.1186/1755-8794-4-84. [DOI] [PMC free article] [PubMed] [Google Scholar]
- 18.Du P, Kibbe WA, Lin SM. lumi: a pipeline for processing Illumina microarray. Bioinformatics. 2008;24:1547–8. doi: 10.1093/bioinformatics/btn224. [DOI] [PubMed] [Google Scholar]
- 19.Dedeurwaerder S, Defrance M, Calonne E, Denis H, Sotiriou C, Fuks F. Evaluation of the Infinium Methylation 450K technology. Epigenomics. 2011;3:771–84. doi: 10.2217/epi.11.105. [DOI] [PubMed] [Google Scholar]
- 20.Meissner A, Gnirke A, Bell GW, Ramsahoye B, Lander ES, Jaenisch R. Reduced representation bisulfite sequencing for comparative high-resolution DNA methylation analysis. Nucleic Acids Res. 2005;33:5868–77. doi: 10.1093/nar/gki901. [DOI] [PMC free article] [PubMed] [Google Scholar]
- 21.Gu H, Bock C, Mikkelsen TS, Jäger N, Smith ZD, Tomazou E, et al. Genome-scale DNA methylation mapping of clinical samples at single-nucleotide resolution. Nat Methods. 2010;7:133–6. doi: 10.1038/nmeth.1414. [DOI] [PMC free article] [PubMed] [Google Scholar]
- 22.Bock C, Tomazou EM, Brinkman AB, Müller F, Simmer F, Gu H, et al. Quantitative comparison of genome-wide DNA methylation mapping technologies. Nat Biotechnol. 2010;28:1106–14. doi: 10.1038/nbt.1681. [DOI] [PMC free article] [PubMed] [Google Scholar]
- 23.Roessler J, Ammerpohl O, Gutwein J, Hasemeier B, Anwar SL, Kreipe HH, et al. Quantitative cross-validation and content analysis of the 450k DNA methylation array from Illumina, Inc. BMC Res Notes. 2012;5:210. doi: 10.1186/1756-0500-5-210. [DOI] [PMC free article] [PubMed] [Google Scholar]
- 24.Rodgers JS, Nicewander WA. Thirteen ways to looks at the correlation coefficients. Am Stat. 1988;42:59–66. doi: 10.2307/2685263. [DOI] [Google Scholar]
- 25.Zar JH. Spearman rank correlation. In: Armitage P, Colton T, eds. Encylopedia for Biostatistics: Wiley, 2005. [Google Scholar]
- 26.Maksimovic J, Gordon L, Oshlack A. SWAN: Subset-quantile Within Array Normalization for Illumina Infinium HumanMethylation450 BeadChips. Genome Biol. 2012;13:R44. doi: 10.1186/gb-2012-13-6-r44. [DOI] [PMC free article] [PubMed] [Google Scholar]
- 27.Johnson WE, Li C, Rabinovic A. Adjusting batch effects in microarray expression data using empirical Bayes methods. Biostatistics. 2007;8:118–27. doi: 10.1093/biostatistics/kxj037. [DOI] [PubMed] [Google Scholar]
- 28.Boks MP, Derks EM, Weisenberger DJ, Strengman E, Janson E, Sommer IE, et al. The relationship of DNA methylation with age, gender and genotype in twins and healthy controls. PLoS One. 2009;4:e6767. doi: 10.1371/journal.pone.0006767. [DOI] [PMC free article] [PubMed] [Google Scholar]
- 29.El-Maarri O, Becker T, Junen J, Manzoor SS, Diaz-Lacava A, Schwaab R, et al. Gender specific differences in levels of DNA methylation at selected loci from human total blood: a tendency toward higher methylation levels in males. Hum Genet. 2007;122:505–14. doi: 10.1007/s00439-007-0430-3. [DOI] [PubMed] [Google Scholar]
- 30.Schroeder JW, Conneely KN, Cubells JC, Kilaru V, Newport DJ, Knight BT, et al. Neonatal DNA methylation patterns associate with gestational age. Epigenetics. 2011;6:1498–504. doi: 10.4161/epi.6.12.18296. [DOI] [PMC free article] [PubMed] [Google Scholar]
- 31.Stünkel W, Pan H, Chew SB, Tng E, Tan JH, Chen L, et al. GUSTO Study Group Transcriptome changes affecting hedgehog and cytokine signalling in the umbilical cord: implications for disease risk. PLoS One. 2012;7:e39744. doi: 10.1371/journal.pone.0039744. [DOI] [PMC free article] [PubMed] [Google Scholar]
- 32.Sandoval J, Heyn HA, Moran S, Serra-Musach J, Pujana MA, Bibikova M, et al. Validation of a DNA methylation microarray for 450,000 CpG sites in the human genome. Epigenetics. 2011;6:692–702. doi: 10.4161/epi.6.6.16196. [DOI] [PubMed] [Google Scholar]
- 33.Jaffe AE, Murakami P, Lee H, Leek JT, Fallin MD, Feinberg AP, et al. Bump hunting to identify differentially methylated regions in epigenetic epidemiology studies. Int J Epidemiol. 2012;41:200–9. doi: 10.1093/ije/dyr238. [DOI] [PMC free article] [PubMed] [Google Scholar]
- 34.Darst RP, Pardo CE, Ai L, Brown KD, Kladde MP. Bisulfite sequencing of DNA. Curr Protoc Mol Biol 2010; Chapter 7:Unit 7 9 1-17. [DOI] [PMC free article] [PubMed] [Google Scholar]
- 35.Genereux DP, Johnson WC, Burden AF, Stöger R, Laird CD. Errors in the bisulfite conversion of DNA: modulating inappropriate- and failed-conversion frequencies. Nucleic Acids Res. 2008;36:e150. doi: 10.1093/nar/gkn691. [DOI] [PMC free article] [PubMed] [Google Scholar]
- 36.Langmead B, Trapnell C, Pop M, Salzberg SL. Ultrafast and memory-efficient alignment of short DNA sequences to the human genome. Genome Biol. 2009;10:R25. doi: 10.1186/gb-2009-10-3-r25. [DOI] [PMC free article] [PubMed] [Google Scholar]
- 37.Gu H, Smith ZD, Bock C, Boyle P, Gnirke A, Meissner A. Preparation of reduced representation bisulfite sequencing libraries for genome-scale DNA methylation profiling. Nat Protoc. 2011;6:468–81. doi: 10.1038/nprot.2010.190. [DOI] [PubMed] [Google Scholar]
- 38.Irizarry RA, Ladd-Acosta C, Wen B, Wu Z, Montano C, Onyango P, et al. The human colon cancer methylome shows similar hypo- and hypermethylation at conserved tissue-specific CpG island shores. Nat Genet. 2009;41:178–86. doi: 10.1038/ng.298. [DOI] [PMC free article] [PubMed] [Google Scholar]
- 39.Eilers PH, Goeman JJ. Enhancing scatterplots with smoothed densities. Bioinformatics. 2004;20:623–8. doi: 10.1093/bioinformatics/btg454. [DOI] [PubMed] [Google Scholar]
Associated Data
This section collects any data citations, data availability statements, or supplementary materials included in this article.