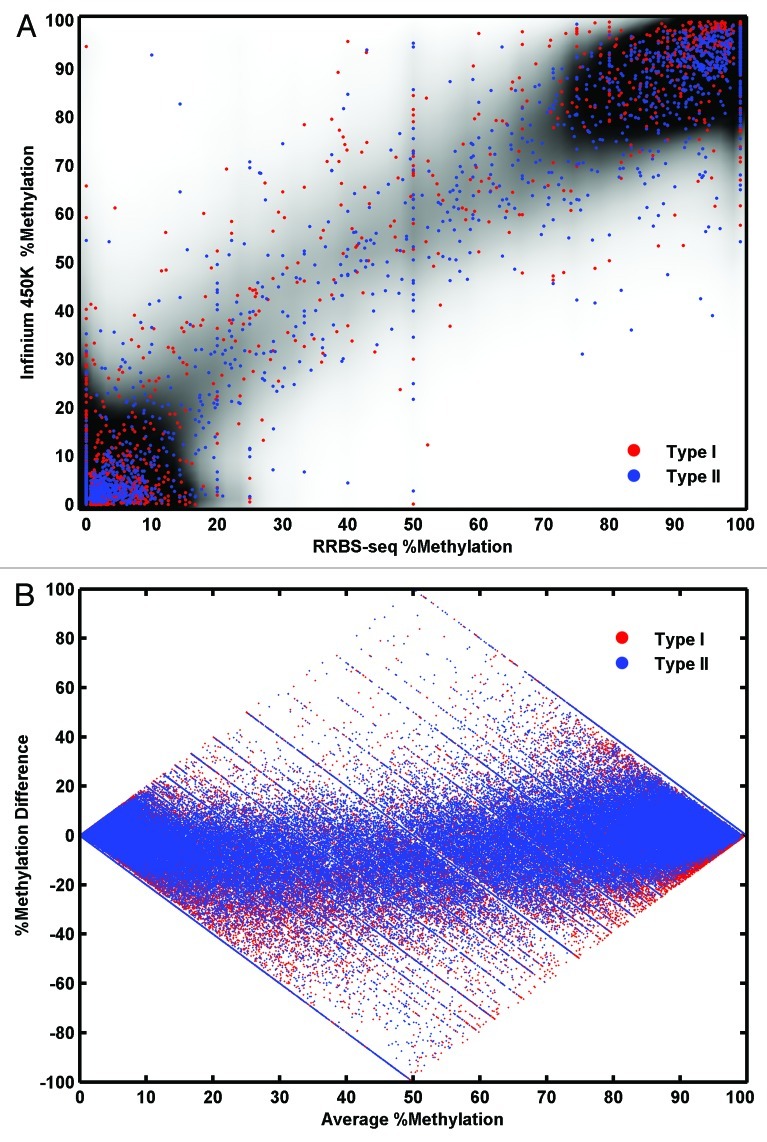
Figure 5. Processed Infinium 450K data vs. RRBS data. (A) A scatter plot of % methylation values from RRBS (x-axis) and % methylation values from Infinium 450K (y-axis) over a density cloud. Density cloud is generated as in Figure 4A. (B) Bland-Altman plot for processed Infinium 450K data compared with RRBS Nreads ≥ 4 is generated as in Figure 4B.

An official website of the United States government
Here's how you know
Official websites use .gov
A
.gov website belongs to an official
government organization in the United States.
Secure .gov websites use HTTPS
A lock (
) or https:// means you've safely
connected to the .gov website. Share sensitive
information only on official, secure websites.
