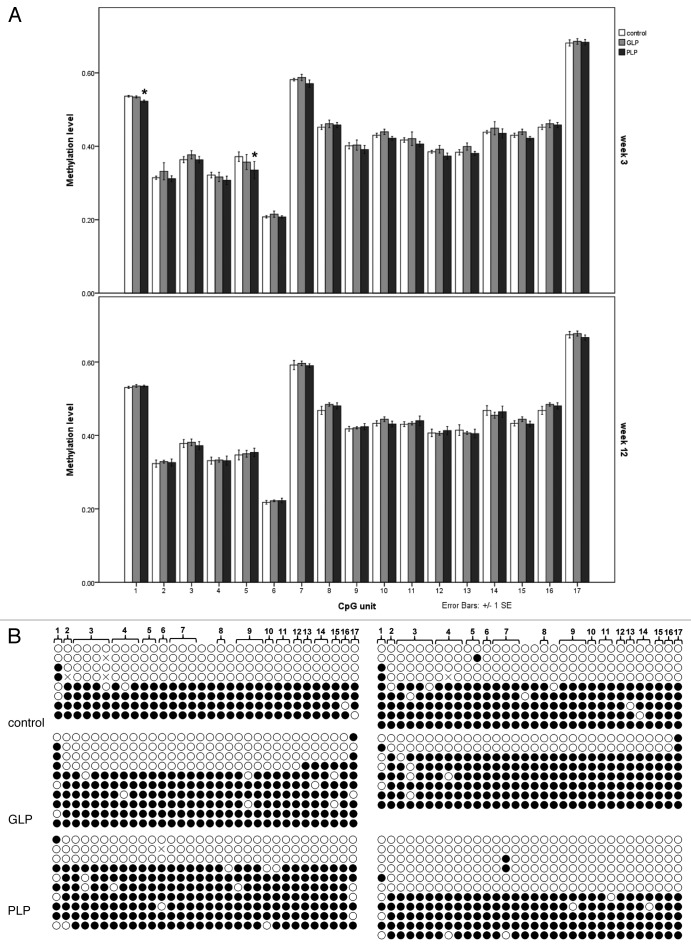
Figure 3. Methylation analysis of the Gnas exon 1A DMR. (A) Methylation analysis by EpiTYPER of the DMR in control, GLP and PLP liver samples at week 3 (above) and week 12 (below) after birth. Methylation values on a scale 0.0 to 1.0 for each CpG unit that can be resolved by EpiTYPER are given. Values expressed are means and bars represent standard errors; n = 7–9. Where individual CpG units exhibited a significant difference in methylation level in treated group compared with control, * p < 0.05. (B) Bisulphite sequencing analysis of two representative samples from each of the control, GLP and PLP groups (week 3). Each row of circles represents a single, non-redundant bisulphite sequence clone. Individual CpGs are represented by circles, with open circles indicating unmethylated and filled circles methylated CpGs. The numbering at the top refers to the CpG units identified by EpITYPER analysis; note that some CpG units contain multiple CpGs (bracketed), while other CpGs are not scored by EpiTYPER analysis.

An official website of the United States government
Here's how you know
Official websites use .gov
A
.gov website belongs to an official
government organization in the United States.
Secure .gov websites use HTTPS
A lock (
) or https:// means you've safely
connected to the .gov website. Share sensitive
information only on official, secure websites.
