

Abstract
Albuminuria is an important marker of nephropathy that increases the risk of progressive renal and chronic cardiovascular diseases. The genetic basis of kidney disease is well-established in humans and rodent models, but the causal genes remain to be identified. We applied several genetic strategies to map and refine genetic loci affecting albuminuria in mice and translated the findings to human kidney disease. First, we measured albuminuria in mice from 33 inbred strains, used the data for haplotype association mapping (HAM), and detected 10 genomic regions associated with albuminuria. Second, we performed eight F2 intercrosses between genetically diverse strains to identify six loci underlying albuminuria, each of which was concordant to kidney disease loci in humans. Third, we used the Oak Ridge National Laboratory incipient Collaborative Cross subpopulation to detect an additional novel quantitative trait loci (QTL) underlying albuminuria. We also performed a ninth intercross, between genetically similar strains, that substantially narrowed an albuminuria QTL on Chromosome 17 to a region containing four known genes. Finally, we measured renal gene expression in inbred mice to detect pathways highly correlated with albuminuria. Expression analysis also identified Glcci1, a gene known to affect podocyte structure and function in zebrafish, as a strong candidate gene for the albuminuria QTL on Chromosome 6. Overall, these findings greatly enhance our understanding of the genetic basis of albuminuria in mice and may guide future studies into the genetic basis of kidney disease in humans.
Keywords: haplotype association mapping, quantitative trait locus
diabetic nephropathy (DN) is a substantial medical burden worldwide and the leading cause of end-stage renal disease (ESRD). The cost of treating ESRD in the United States alone is estimated to exceed $30 billion annually (42), and DN contributes additional medical costs during earlier stages of kidney disease and by increasing the risk of myocardial infarction, stroke, atherosclerosis, heart failure, and all-cause mortality (26, 33, 38, 39, 43). Current therapies can slow the progression to ESRD associated with DN but not nearly to the rate of normal, age-related renal function decline.
Albuminuria is a clinical sign of nephropathy that significantly increases the risk of progressive kidney disease (13, 34), as well as cardiovascular disease and death (34), in diabetic patients. Moreover, pharmacological reduction of albuminuria lowers the risk of ESRD (16) and cardiovascular outcomes (12) in patients with DN. One estimate indicated that the lowered risk of ESRD alone with such treatment could reduce medical costs and increase survival of patients with DN (6). Therefore, identifying novel therapeutic targets to further reduce albuminuria in diabetic patients could provide substantial medical and economic benefits.
The genetic basis of DN in humans is well established and the causal genes underlying DN may represent novel drug targets. Many genomic regions containing genes affecting human DN [i.e., quantitative trait loci (QTL)] have been identified [see Bowden (3) for review], but it remains difficult to map and prove causal genes underlying polygenic diseases in humans. Because QTL identified in rodent models of kidney disease often correspond to human nephropathy QTL (27), rodents provide useful models to identify QTL that can predict or narrow kidney disease QTL in humans (19). Therefore, we applied the genetic resources available in mice to identify QTL underlying albuminuria using 2,900 mice derived from 9 intercross populations plus 190 mice from the Oak Ridge National Laboratory Collaborative Cross [pre-CC (10)].
METHODS
Phenotyping inbred mice for the strain survey of albuminuria.
Male mice from 33 inbred strains were obtained from The Jackson Laboratory (Bar Harbor, ME). Spot urine samples were collected from 10-wk-old mice daily in the morning for 1 wk. Urine samples from each mouse were pooled, and urinary albumin and creatinine concentrations were measured at The Jackson Laboratory using a Beckman Synchron CX5 Clinical Chemistry Autoanalyzer. A series of mouse albumin standards (Kamiya Biomedical, Seattle, WA) was quantified with each set of urine samples, and the final urinary albumin concentration in each sample was calculated by linear regression from the mouse albumin standard curve (20). These studies were approved by the Animal Care and Use Committee of The Jackson Laboratory.
Haplotype association mapping.
Haplotype association mapping (HAM) analysis was performed using a free efficient mixed-model association (EMMA) add-on package in R [http://mouse.cs.ucla.edu/emma (25)]; we chose EMMA because it accounts for population structure better than other methods to reduce false-positive rates. Strain mean albuminuria data for 32 classical inbred strains was log transformed and combined with genotype data for 623,124 single nucleotide polymorphisms (SNPs) derived using the Mouse Diversity Genotyping Array (see Ref. 44; available at http://cgd.jax.org//tools/diversityarray.shtml). The association of each SNP with albuminuria was individually calculated as log10(P value), and 1 × 10⁻⁶ was used as the significance threshold.
Breeding, phenotyping, and genotyping F2 populations.
Mice from 15 inbred strains were purchased from The Jackson Laboratory and bred at Novartis Pharmaceuticals to generate nine populations of male F2 mice for QTL analysis. Blood pressure was measured in F2 mice at 8 wk of age [QTL results for this phenotype are published (18)] and then spot urine samples were collected at 10 wk of age and analyzed with mouse albumin standards using a Roche Hitachi 917 Clinical Chemistry Autoanalyzer. DNA isolated from each F2 mouse was genotyped by KBiosciences (Herts, UK) as described previously (18). These studies were approved by the Novartis Animal Care and Use Committee.
QTL analyses using F2 populations.
Because the distribution of albuminuria was skewed in all F2 populations, main-effect QTL linked to urinary albumin concentrations were identified using nonparametric genomewide scans (5, 29). Logarithm of the odds ratio (LOD) scores were calculated at 2-cM steps across the genome and compared with significance thresholds computed by permutation analysis (see Ref. 11; genomewide adjusted P = 0.10, suggestive; P = 0.05, significant). Confidence intervals were calculated based on Bayesian probability.
Breeding, phenotyping, and genotyping collaborative cross mice.
Collaborative cross (CC) mice were bred at Oak Ridge National Laboratory as previously described (10). Spot urine samples were collected from 190 10-wk-old male mice, frozen, shipped to Novartis Pharmaceuticals, and analyzed with mouse albumin standards using a Roche Hitachi 917 Clinical Chemistry Autoanalyzer. Multiple generations of CC mice from G2:F5–F8 were included in the phenotype population, but only the G2:F7 generation was genotyped using 13,000 SNPs that differentiate the eight founder haplotypes at >1,200 loci (10). Therefore, genotypes for mice in the G2:F5, G2:F6, and G2:F8 generations were inferred from G2:F7 parents or siblings that were genotyped directly; because the population is 80% inbred, it is possible to determine haplotype of origin with certainty at most locations for most mice using this approach.
Mapping with the CC.
Urinary albumin concentrations were log transformed to account for the skewed distribution, and linkage analysis was performed by fitting a genomewide additive model to the trait data using R/Happy [version 2.1 (31)]. Genomewide significance thresholds were computed from 1,000 additive model permutations (P = 0.10, suggestive; P = 0.05, significant), and confidence intervals were calculated as the 1-LOD drop interval around the peak marker.
Gene expression and pathway analysis.
Total RNA was extracted using TRIzol reagent (Invitrogen, Carlsbad, CA) and purified with Qiagen RNeasy separation columns (Qiagen, Hilden, Germany). For microarray analysis, first-strand cDNA was synthesized and hybridized to Affymetrix GeneChip Mouse Genome 430v 2.0 arrays (Affymetrix, Santa Clara, CA). Statistical analysis of the microarray data was performed within the R statistical environment (36) using bioinformatics packages from Bioconductor (22). The raw signals from CEL files were normalized and summarized into probe-set level intensities using a Robust Multichip Average method (23). Affymetrix MAS5 present/absent calls were calculated, and probe sets with “present” calls in fewer than 50% of samples within all strains were removed from further statistical analyses. The moderated t-test, implemented in the limma package (40), was applied to determine if the differential expression of each probe set between any strain pair was significant. P values were further adjusted using the Benjamini and Hochberg (1) multiple-testing procedures for false discovery rate control.
The urine albumin concentration values were log2 transformed (constant number 1 was added before transformation) to ensure that the data fit an approximately normal distribution. Data from the entire collection of 26 strains (129S1/SvImJ, A/J, AKR/J, BALB/cByJ, BALB/cJ, BTBR-T+tf/J, BUB/BnJ, C3H/HeJ, C57BL/6J, C57BR/cdJ, C58/J, CBA/caJ, CBA/J, DBA/2J, FVB/NJ, I/LnJ, KK/HIJ, NOD/LtJ, NON/LtJ, NZO/HILtJ, NZW/LacJ, PL/J, RIIIS/J, SJL/J, SM/J, and SWR/J) were used to calculate Pearson correlations between the transformed urinary albumin level and all the probe sets that passed filtering. The functional enrichment of genes highly correlated with albuminuria (defined as >0.6 or ≤0.6) were performed using the Database for Annotation, Visualization, and Integrated Discovery website [DAVID; http://david.abcc.ncifcrf.gov/ (21)].
Statistics.
Tukey's Honestly Significant Differences test was used to test the significance of unplanned pairwise comparisons among the 33 inbred strains. Values for groups sorted by genotype are presented as means ± SE and were compared by ANOVA followed by Bonferroni posttest using SigmaStat. P < 0.05 was considered significant.
RESULTS
Survey of albuminuria in inbred mice.
To evaluate albuminuria among inbred mice and identify strains useful for QTL analysis, we measured urinary albumin and creatinine concentrations in mice from 33 inbred strains. We found a wide variation in albumin-to-creatinine ratios (ACR) between mice from different inbred strains, from BTBR T+ tf/J mice with no detectable albuminuria to KK/HIJ mice with ACR near 200 mg/g (Fig. 1).
Fig. 1.

Albuminuria in mice from 33 inbred strains. Bars represent urinary albumin-to-creatinine ratios in mice from each strain given as means ± SE (n = 6–24 mice/group). KK/HIJ, DBA/2J, and A/J mice are significantly different (P < 0.05 by Tukey's Honestly Significantly Differences test) from all other mice tested.
Haplotype association mapping.
The first approach we used to identify genomic loci affecting albuminuria in mice was HAM by EMMA. Genotype data collected with the Mouse Diversity Genotyping Array for many inbred mouse strains is freely available from the Center for Genome Dynamics at The Jackson Laboratory, so we combined this genotype data with the albuminuria data from the inbred strain survey for HAM analysis. Because HAM is dependent on conservation of ancestral alleles among inbred strains, we included only data from the 32 classical inbred strains (excluding PWK) in the HAM analysis. Using a threshold of 1 × 10⁻⁶, we identified 10 genomic regions on 8 chromosomes (Chr) that were associated with albuminuria across inbred mice (Fig. 2 and Table 1). Each HAM region was <1.5 Mb and contained only a few genes.
Fig. 2.

Haplotype association mapping (HAM) using classical inbred strains. Albuminuria data from 32 classical inbred strains were combined with genotype data at 623,124 single nucleotide polymorphisms (SNPs) for HAM analysis; Manhattan plot shows genomic regions associated with albuminuria. Score represents log10(P value).
Table 1.
HAM peaks for albuminuria
| Chr | SNP ID | HAM Peak, Mb | Interval, Mb | P Value |
|---|---|---|---|---|
| 2 | rs28320970 | 47.14 | 47.06–48.06 | 8.91 × 10⁻⁷ |
| 5 | rs38597735 | 64.72 | 58.28–58.35 | 2.87 × 10⁻⁷ |
| 63.97–65.05 | ||||
| 6 | rs30265037 | 138.44 | 138.42–139.19 | 2.87 × 10⁻⁷ |
| 9 | rs30223940 | 71.32 | 69.97–71.38 | 5.46 × 10⁻⁷ |
| 11 | rs26886616 | 36.20 | 27.28–28.71 | 1.77 × 10⁻⁸ |
| 35.99–36.45 | ||||
| 13 | rs29552670 | 69.86 | 69.86–70.01 | 2.87 × 10⁻⁷ |
| 18 | rs31600034 | 32.02 | 32.00–32.04 | 2.87 × 10⁻⁷ |
| 18 | rs38179874 | 86.76 | 86.73–86.76 | 2.87 × 10⁻⁷ |
Chr, chromosome; SNP, single nucleotide polymorphism; ID, identification; HAM, haplotype association mapping.
Mb positions are based on NCBI mouse genome build 37.
QTL analyses of albuminuria in F2 populations.
To further map the loci underlying the variation in albuminuria between inbred mice, we generated eight F2 populations derived from 12 inbred strains selected for genetic and phenotypic diversity; ACR was significantly different between seven of these eight strain pairs (Table 2). Because cross direction can substantially affect albuminuria, we generated all F1 mice for each cross in the same direction and intercrossed them to produce the F2 progeny, meaning that maternal, imprinting, and mitochondrial effects were fixed within each F2 population. Albuminuria was not normally distributed in any of the F2 populations (data not shown), so we used nonparametric QTL analyses to detect main-effect QTL underlying albuminuria (Fig. 3, A–H) because this method is not adversely affected by a skewed trait distribution. The (AKR × NZW)F2 and (FVB × RIIIS)F2 populations, which had the smallest ACR differences between the parental strains (Table 2), failed to identify any QTL significantly linked to albuminuria. Linkage analyses detected one significant main-effect QTL in each of the remaining F2 populations (peak locations, confidence intervals, allele effects, LOD scores, and modes of inheritance are summarized in Table 3).
Table 2.
Characteristics of F2 populations for albuminuria QTL analysis
| Grandmaternal Strain | Grandpaternal Strain | n | No. of Markers | ACR Difference* | P Value† |
|---|---|---|---|---|---|
| Genetically diverse strain pairs | |||||
| AKR/J (AKR) | NZW/LacJ (NZW) | 333 | 94 | 17 | <0.001 |
| FVB/NJ (FVB) | RIIIS/J (RIII) | 252 | 90 | 27 | 0.019 |
| SJL/J (SJL) | RIIIS/J (RIII) | 336 | 91 | 26 | 0.045 |
| BTBR T+ tf (BTBR) | SWR/J (SWR) | 328 | 93 | 47 | 0.001 |
| PL/J (PL) | CBA/J (CBA) | 324 | 90 | 37 | 0.024 |
| C3H/HeJ (C3H) | KK/HIJ (KK) | 335 | 91 | 167 | 0.006 |
| 129S1/SvImJ (129) | A/J (A) | 333 | 91 | 99 | 0.056 |
| 129S1/SvImJ (129) | DBA/2J (D2) | 319 | 90 | 141 | 0.034 |
| Genetically similar strain pair | |||||
| DBA/1J (D1) | DBA/2J (D2) | 340 | 33 | 133 | 0.003 |
n, No. of experments.
QTL, quantitative trait loci; ACR, albumin-to-creatinine ratio.
Strain abbreviations used throughout the manuscript are shown in parentheses.
Difference in ACR between the strains (mg/g).
P value for ACR difference between inbred strains.
Fig. 3.

Nonparametric genomewide scans for albuminuria quantitative trait loci (QTL) in 8 intercross populations. Suggestive (P < 0.10) and significant (P < 0.05) logarithm of the odds ratios (LOD) scores, as determined by permutation testing, are shown as dotted lines.
Table 3.
Summary of significant main-effect QTL linked to albuminuria
| Chr | QTL Name | Population | Peak, cM | 95% CI, cM | 95% CI, Mb | LOD | High Allele | ACR Effect* | Mode of Inheritance | Human QTL |
|---|---|---|---|---|---|---|---|---|---|---|
| 4 | Albq12 | SJL × RIIIS | 26.1 | 16.1–32.1 | 34.0–58.4 | 7.61 | RIIIS | 16.5 | Rec | 9q22 (32) |
| 6 | Albq13 | BTBR × SWR | 6.8 | 2.8–12.8 | 6.8–32.0 | 3.82 | SWR | 34.3 | Rec | 7q21 (24) |
| 7 | Albq14 | PL × CBA | 64.4 | 34.4–74.4 | 70.0–138.7 | 3.32 | PL | 48.3 | Rec | 16p12 (4) |
| 13 | Albq15 | C3H × KK | 36.7 | 14.7–44.7 | 37.4–84.8 | 3.86 | KK | 44.2 | Add | 9q22 (32), 5q14 (28) |
| 17 | Albq16 | 129 × A | 5.5 | 0–11.5 | 0–23.3 | 7.71 | A | 78.8 | Rec | 6p21 (32), 6q26 (7) |
| 18 | Albq17 | 129 × D2 | 9.7 | 0–17.7 | 0–30.9 | 4.51 | D2 | 20.2 | Rec | 18q12 (32) |
| 10 | Albq18 | preCC | 4.7 | 3.0–5.1 | 8.7–13.5 | 9.0 | WSB | n/a | n/a |
CI, confidence interval; cM, centimorgan; Mb, megabase; LOD, logarithm of the odds ratio; Rec, recessive; Add, additive; n/a, not availalbe.
Reference for each human QTL is indicated in parentheses.
ACR effect is the maximum ACR difference between the three genotypes at the QTL expressed as mg albumin/g creatinine.
Chromosome 4.
The (SJL × RIIIS)F2 population identified a significant albuminuria QTL on Chr 4 (Fig. 4A). At this locus, RIIIS mice contributed a recessive allele for albuminuria (Fig. 4B). The concordant region of the human genome, Chr 9q22, was previously linked to albuminuria in a study of >3,600 American Indians (32). This region of the human genome has also been linked to nephropathy in patients with type II diabetes (4).
Fig. 4.

Mapping of albuminuria QTL on Chromosomes (Chr) 4, 6, and 7. Mapping and allelic effect plots for albuminuria QTL in the (SJL × RIII)F2 (A and B), (BTBR × SWR)F2 (C and D), and (PL × CBA)F2 (E and F) populations. Albumin-to-creatinine ratios are expressed as means ± SE. The solid horizontal gray bars represent the Bayesian confidence intervals.
Chromosome 6.
Proximal Chr 6 was significantly linked to albuminuria in the (BTBR × SWR)F2 cross (Fig. 4C), where SWR mice contributed a recessive allele for albuminuria (Fig. 4D). This QTL in mice is concordant with an albuminuria QTL on human Chr 7q21 detected in European Americans as part of the Family Investigation of Nephropathy and Diabetes study (24).
Chromosome 7.
The (PL × CBA)F2 intercross detected a significant QTL underlying albuminuria in the middle of Chr 7 (Fig. 4E). F2 mice that inherited two PL alleles at this locus displayed higher ACR than heterozygotes or CBA homozygotes (Fig. 4F), indicating a recessive PL albuminuria allele at this QTL. The concordant region of the human genome on Chr 16p12 has been linked to ESRD, with proteinuria, in African American families (4). According to the rat genome database (www.rgd.mcw.edu), the corresponding region of rat Chr 1 has also been linked to urinary albumin excretion, with QTL detected in three separate populations: UAE1 in (MWF × LEW)F2 rats, UAE5 in (SS × SHR)F2 rats, and Rf2 in (FHH × ACI) × FHH N2 rats.
Chromosome 13.
The middle portion of Chr 13 was significantly linked to albuminuria in the (C3H × KK)F2 intercross (Fig. 5A). At this locus, KK mice contributed an additive allele for high albuminuria (Fig. 5B). This mouse QTL is concordant to two separate regions of the human genome that have been linked to albuminuria: Chr 5q14 is linked to albuminuria in families with type II diabetes (28) and Chr 9q22 is linked to albuminuria in American Indians (32).
Fig. 5.

Mapping of albuminuria QTL on Chromosomes 13, 17, and 18. Mapping and allelic effect plots for albuminuria QTL in the (C3H × KK)F2 (A and B), (129 × A)F2 (C and D), and (129 × D2)F2 (E and F) populations. Albumin-to-creatinine ratios are expressed as means ± SE. The solid horizontal gray bars represent the Bayesian confidence intervals.
Chromosome 17.
The strongest QTL linked to albuminuria in these eight intercrosses was detected on proximal Chr 17 in the (129 × A)F2 population (Fig. 5C). F2 mice that inherited two A alleles at this locus displayed higher ACR than heterozygotes or 129 homozygotes (Fig. 5D), indicating a recessive A allele for albuminuria at this locus. This region of the mouse genome corresponds to a rat Chr 17 interval that was linked to increased urinary albumin excretion in (MWF × LEW)F2 rats (UAE4; www.rgd.mcw.edu). Portions of this genomic region in mice are concordant to human Chr 6p21, which falls within the 1-LOD interval of the Chr 6p QTL linked to albuminuria in American Indians by Mottl et al. (32). Human Chr 6p21 is also modestly linked to albuminuria in an analysis of extended families by Krolewski et al. (28). The Chr 17 QTL is also concordant to human Chr 6q26, which is associated with estimated glomerular filtration rate (7).
Chromosome 18.
The final albuminuria QTL detected in our analyses of eight intercrosses between genetically diverse mouse strains was on Chr 18 (Fig. 5E). In the (129 × D2)F2 population, this QTL was inherited as a recessive albuminuria allele from D2 mice (Fig. 5F). This region of the mouse genome is concordant with human Chr 18q12, which is suggestively linked to albuminuria in American Indians (32).
QTL analysis of albuminuria in the CC.
In addition to the mouse intercross populations, we also examined the genetic basis of albuminuria in pre-CC mice. We detected a significant QTL underlying albuminuria on proximal Chr 10 in the pre-CC population (Fig. 6, A and B). Several trait values were censored because they were below the limits of detection; therefore, we confirmed the mapping result by applying proportional hazard regression to the six markers within the 1-LOD interval around the peak marker and detected two markers significantly linked to albuminuria in this population (Fig. 6C). Because the pre-CC population originated from eight wild-derived and classical inbred mouse strains, we used diagnostic haplotypes to determine which strains contributed albuminuria alleles at this QTL. Pre-CC mice carrying haplotypes from WSB/EiJ (WSB) and A at this locus displayed significantly higher albuminuria than mice carrying haplotypes from the other founder strains (Fig. 6C).
Fig. 6.

Mapping of albuminuria QTL in precollaborative cross mice (pre-CC). A: genomewide scan for albuminuria QTL. Suggestive (P < 0.10) and significant (P < 0.05) LOD scores, as determined by permutation testing, are shown as dotted lines. B: fine mapping plot of Chr 10 QTL in the pre-CC population. C: allelic effects for the Chr 10 QTL were calculated using haplotypes diagnostic for each of the 8 founder strains at the SNPs significantly linked to albuminuria in the pre-CC population.
Analysis of albuminuria linkage to Chr 17 in (D1 × D2)F2 mice.
Because D1 and D2 mice are nearly 95% genetically identical, QTL detected between these mice are likely to have narrow confidence intervals lying within the small regions of genetic diversity. D1 and D2 are identical by descent over most of the QTL intervals detected in the intercross and pre-CC populations, but they differ at two distinct regions on Chr 17, including the region on proximal Chr 17 harboring the albuminuria QTL detected in the (129 × A)F2 population. Thus, we generated an intercross population of 340 (D1 × D2)F2 mice, quantified urinary ACR, and genotyped the mice at three SNPs within these two regions on Chr 17. All three SNPs were significantly linked to albuminuria (Fig. 7, A–C), indicating the presence of two albuminuria QTL on Chr 17 in the (D1 × D2)F2 population. Whereas the proximal QTL in (129 × A)F2 mice extended from 0 to 23 Mb, the interval in (D1 × D2)F2 mice ranged from 0 to only 4.5 Mb, (Fig. 7D), a significant refinement of the QTL to an interval containing only a few genes.
Fig. 7.
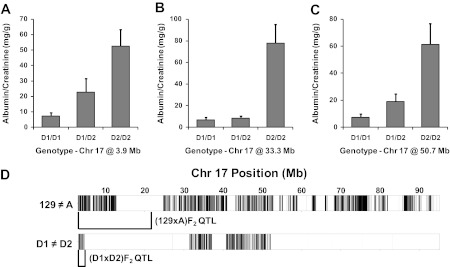
(D1 × D2)F2 population substantially narrows Albq16. Allelic effect plots for Chr 17 albuminuria QTL in the (D1 × D2)F2 population (A, B, and C) are shown; albumin-to-creatinine ratios are expressed as means ± SE. D: comparison of Chr 17 SNPs (represented by vertical black lines) in the (D1 × D2)F2 and (129 × A)F2 populations refined the proximal Chr 17 QTL to a small interval containing 4 genes.
Renal gene expression, pathway analysis, and candidate gene identification.
To better understand the molecular pathways underlying albuminuria in inbred mice and to identify candidate genes for further evaluation, we used microarray analysis to evaluate renal gene expression in kidneys from mice from 26 inbred strains. Renal gene expression and urinary albumin/creatinine data for mice from the 26 strains were used to calculate Pearson correlations. The subset of genes highly correlated with albuminuria (>0.6 or ≤0.6) were evaluated for functional enrichment using the DAVID website (http://david.abcc.ncifcrf.gov/). Pathways for cell adhesion and cell projection organization were among the top pathways negatively correlated with albuminuria, whereas pathways affecting mitochondrial structure and function were among the pathways positively correlated with albuminuria in mice from these 26 strains (Table 4).
Table 4.
Top pathways positively and negatively correlated with albuminuria in inbred mice
| Term | Count | Percent | Fold Enrichment | P Value | Benjamini Hochberg |
|---|---|---|---|---|---|
| Negatively correlated | |||||
| GO:0007155 (cell adhesion) | 8 | 11.94 | 4.40 | 1.74 × 10⁻³ | 0.44 |
| GO:0022610 (biological adhesion) | 8 | 11.94 | 4.40 | 1.76 × 10⁻³ | 0.25 |
| GO:0016337 (cell-cell adhesion) | 5 | 7.46 | 6.54 | 6.44 × 10⁻³ | 0.51 |
| GO:0030030 (cell projection organization) | 5 | 7.46 | 4.84 | 1.79 × 10⁻² | 0.77 |
| GO:0044421 (extracellular region part) | 7 | 10.45 | 2.41 | 6.27 × 10⁻² | 1.00 |
| Positively correlated | |||||
| GO:0006091 (generation of precursor metabolites and energy) | 12 | 17.91 | 14.20 | 3.55 × 10⁻¹⁰ | 1.38 × 10⁻⁷ |
| GO:0044429 (mitochondrial part) | 12 | 17.91 | 6.66 | 8.28 × 10⁻⁷ | 1.04 × 10⁻⁴ |
| GO:0006119 (oxidative phosphorylation) | 6 | 8.96 | 33.09 | 8.46 × 10⁻⁷ | 1.64 × 10⁻⁴ |
| GO:0005739 (mitochondrion) | 17 | 25.37 | 3.74 | 2.56 × 10⁻⁶ | 1.61 × 10⁻⁴ |
| GO:0031966 (mitochondrial membrane) | 10 | 14.93 | 7.90 | 2.84 × 10⁻⁶ | 1.19 × 10⁻⁴ |
| mmu00190 (oxidative phosphorylation) | 8 | 11.94 | 11.03 | 4.36 × 10⁻⁶ | 2.05 × 10⁻⁴ |
| GO:0005740 (mitochondrial envelope) | 10 | 14.93 | 7.44 | 4.66 × 10⁻⁶ | 1.47 × 10⁻⁴ |
| GO:0005743 (mitochondrial inner membrane) | 9 | 13.43 | 8.84 | 5.26 × 10⁻⁶ | 1.33 × 10⁻⁴ |
| GO:0015985 (energy-coupled proton transport, down electrochemical gradient) | 5 | 7.46 | 41.73 | 5.32 × 10⁻⁶ | 6.88 × 10⁻⁴ |
| GO:0015986 (ATP synthesis-coupled proton transport) | 5 | 7.46 | 41.73 | 5.32 × 10⁻⁶ | 6.88 × 10⁻⁴ |
We also evaluated whether genes located in each QTL interval exhibited expression differences between the mouse strains used to generate the F2 population that detected the QTL [full results in Supplemental Information (Supplemental data for this article may be found on the American Journal of Physiology Renal Physiology website)]. For example, we tested probe sets representing 77 genes within Albq13 on mouse Chr 6 and found that 11 genes showed significant expression differences between BTBR and SWR mice. One of these 11 genes, Glcci1 (glucocorticoid-induced transcript 1), is known to affect podocyte structure and proteinuria (35).
DISCUSSION
The overall goal of this study was to investigate the genetic basis of albuminuria in mice, and we employed several experimental strategies to accomplish this. First, we measured urinary ACR in mice from 33 inbred strains and used the strain survey data for HAM. Second, we designed eight experimental QTL crosses between genetically diverse mice to identify novel QTL underlying albuminuria; we also performed one cross with closely related DBA/1 and DBA/2 mice to refine some of the QTL intervals. Finally, we mapped albuminuria in pre-CC mice derived from inbreeding the progeny of an eight-way intercross of inbred mice. Each of these experimental strategies detected genomic regions that contribute to albuminuria, but we found surprisingly little overlap between the results from the different methods, which limited our power to narrow the intervals using bioinformatics methods (15).
All but one of the strain pairs used to produce the F2 populations had a significant difference in ACR (Table 2), although the two crosses with the smallest ACR differences failed to detect any significant QTL affecting albuminuria. Each of the remaining intercrosses identified one QTL underlying albuminuria, nearly all of which are novel QTL affecting this phenotype. None of these albuminuria QTL overlapped the blood pressure QTL detected within the same population (18), suggesting that the genetic factors regulating blood pressure are independent from those affecting albuminuria.
This study highlights the power of the CC for precisely mapping complex traits, even traits with highly skewed distributions like albuminuria. Whereas the F2 populations identified QTL with 20- to 70-Mb confidence intervals, the pre-CC population detected a 5-Mb QTL interval despite having only about half as many mice as the F2 populations. Additionally, the eight-way cross design used to produce pre-CC mice provides genetic diversity beyond that of common inbred laboratory strains (37), and the pre-CC population detected an albuminuria QTL on Chr 10 that was not identified in any of the F2 populations. Future studies using final CC strains or The Jackson Laboratory Diversity Outcross population derived by outcrossing CC mice should be well powered to detect narrow QTL affecting diverse phenotypes.
Linkage studies using rodent models can guide the genetic analysis of the corresponding disease in humans. For example, we previously identified a mouse blood pressure QTL on Chr 1 that was concordant to blood pressure QTL in both rats and humans (14). Chang et al. (8) further investigated this region using human linkage and association studies and found three genes significantly associated with blood pressure; these genetic associations were confirmed by Faruque et al. (17) using a separate human population. Similarly, albuminuria QTL identified in mice or rats are often concordant with human kidney disease QTL (19, 27), and we found that the region of the human genome corresponding to each albuminuria QTL identified in the intercross populations was linked to kidney disease in humans (Table 3). Albq15 on Chr 13 is concordant to human kidney disease QTL on Chr 9q22 (32) and 5q14 (28); AUH on Chr 9 is significantly associated with human DN (30), and SLC34A1 is significantly associated with incident kidney disease (2). On Chr 17, we identified an albuminuria QTL that is concordant with a locus on Chr 6p21 linked to albuminuria in humans (32). We separated this QTL (Albq16) interval into two loci using the (D1 × D2)F2 population; the distal QTL is concordant to a human region containing GRIK2, a gene associated with DN, and the proximal locus is concordant to a human locus linked to renal function (9). The proximal Chr 17 QTL contains only a few genes, including Nox3, which encodes NADPH oxidase 3. Nox3 represents a strong candidate gene for this albuminuria QTL because inhibition of NADPH oxidase can ameliorate albuminuria and renal morphological changes in diabetic animals (41). Finally, the albuminuria QTL detected on Chr 10 in the pre-CC population (Albq18) contains the mouse ortholog of human SASH1, which is significantly associated with DN in humans (30). These findings suggest evolutionary conservation of kidney disease genes between rodents and humans.
We also identified candidate genes for these QTL by evaluating renal gene expression in mice from 26 inbred strains. Using correlation and enrichment analysis, we found that downregulation of cell adhesion genes as well as upregulation of pathways affecting mitochondrial structure and function were highly correlated with albuminuria across the 26 mouse strains. In addition to uncovering these general pathways correlated with albuminuria in mice, we also identified specific genes within each QTL interval that exhibited significant differences in renal expression. One intriguing candidate gene with a renal expression difference between BTBR and SWR mice is Glcci1, which is expressed in mouse and zebrafish mesangial cells and podocytes, including foot processes (35). Morpholino knock down of Glcci1 expression in zebrafish induced podocyte effacement and proteinuria (35), indicating that reduced Glcci1 expression can be a causal factor affecting renal structure. The authors also observed decreased glomerular Glcci1 expression in mice with either adriamycin or lipopolysaccharide-induced nephropathy, as well as in db/db diabetic mice (35). These data implicate Glcci1 as a strong candidate gene for Albq13.
The findings from our studies represent a substantial advance in our understanding of the genetic basis of albuminuria. Nearly all of the QTL detected in these populations are novel albuminuria QTL that are concordant with loci affecting kidney disease in humans, suggesting that future crosses may detect other new albuminuria QTL. We also used an additional mouse cross between genetically similar strains to refine the QTL intervals, which substantially narrowed the proximal Chr 17 QTL to a small region. Gene expression analysis identified several molecular pathways and candidate genes that could underlie the development of albuminuria. Future studies to fine map the remaining albuminuria QTL and identify the causal genes may elucidate novel pathways affecting kidney disease in both mice and humans.
GRANTS
This work was supported by the Novartis Institutes for BioMedical Research and by National Institutes of Health Grants to G. A. Churchill (GM070683; GM076468).
DISCLOSURES
A portion of this research was supported by the U.S. Department of Energy, Office of Science, Biological and Environmental Research (BER) programs and performed at Oak Ridge National Laboratory (ORNL). ORNL is managed by UT-Battelle, LLC, for the U.S. Department of Energy under contract DE-AC05-00OR22725. The submitted manuscript has been co-authored by a contractor of the U.S. Government under contract DE-AC05-00OR22725. Accordingly, the U.S. Government retains a nonexclusive, royalty-free license to publish or reproduce the published form of this contribution, or allow others to do so, for U.S. Government purposes.
AUTHOR CONTRIBUTIONS
Author contributions: J.T., M.F., L.Y., S.S., L.X., and K.J.D. performed experiments; J.T., Y.Z., G.A.C., and K.J.D. approved final version of manuscript; S.-W.T., V.P., Y.Z., G.A.C., and K.J.D. analyzed data; Y.Z., E.J.C., G.A.C., and K.J.D. interpreted results of experiments; L.X., D.R.M., E.J.C., G.A.C., and K.J.D. edited and revised manuscript; D.R.M., B.P., E.J.C., G.A.C., and K.J.D. conception and design of research; K.J.D. prepared figures; K.J.D. drafted manuscript.
Supplementary Material
ACKNOWLEDGMENTS
We thank Harry Whitmore for expert technical assistance with phenotyping.
Current address for D. R. Miller: Department of Genetics, University of North Carolina, Chapel Hill, NC.
REFERENCES
- 1.Benjamini Y, Hochberg Y. Controlling the false discovery rate: a practical and powerful approach to multiple testing. J Royal Stat Soc Series B-Methodol 57: 289–300, 1995 [Google Scholar]
- 2.Boger CA, Gorski M, Li M, Hoffmann MM, Huang C, Yang Q, Teumer A, Krane V, O'Seaghdha CM, Kutalik Z, Wichmann H-E, Haak T, Boes E, Coassin S, Kollerits B, Haun M, Paulweber B, Kottgen A, Li G, Shlipak MG, Hwang S-J, Dehghan A, Rivadeneira F, Uitterlinden A, Hofman A, Kramer BK, Witteman J, Bochud M, Siscovick D, Rettig R, Wanner C, Thadhani RI, Heid IM, Fox CS, Kao WH. Association of eGFR-related loci identified by GWAS with incident CKD and ESRD. PLoS Genetics 7: e1002292, 2011 [DOI] [PMC free article] [PubMed] [Google Scholar]
- 3.Bowden DW. Genetics of kidney disease. Kidney Int Suppl 83: S8–S12, 2003 [DOI] [PubMed] [Google Scholar]
- 4.Bowden DW, Colicigno CJ, Langefeld CD, Sale MM, Williams A, Anderson PJ, Rich SS, Freedman BI. A genome scan for diabetic nephropathy in African Americans. Kidney Int 66: 1517–1526, 2004 [DOI] [PubMed] [Google Scholar]
- 5.Broman KW. Mapping quantitative trait loci in the case of a spike in the phenotype distribution. Genetics 163: 1169–1175, 2003 [DOI] [PMC free article] [PubMed] [Google Scholar]
- 6.Carides GW, Shahinfar S, Dasbach EJ, Keane WF, Gerth WC, Alexander CM, Herman WH, Brenner BM. The impact of losartan on the lifetime incidence of end-stage renal disease and costs in patients with type 2 diabetes and nephropathy. Pharmacoeconomics 24: 549–558, 2006 [DOI] [PubMed] [Google Scholar]
- 7.Chambers JC, Zhang W, Lord GM, van der Harst P, Lawlor DA, Sehmi JS, Gale DP, Wass MN, Ahmadi KR, Bakker SJ, Beckmann J, Bilo HJ, Bochud M, Brown MJ, Caulfield MJ, Connell JM, Cook HT, Cotlarciuc I, Davey SG, de SR, Deng G, Devuyst O, Dikkeschei LD, Dimkovic N, Dockrell M, Dominiczak A, Ebrahim S, Eggermann T, Farrall M, Ferrucci L, Floege J, Forouhi NG, Gansevoort RT, Han X, Hedblad B, Homan van der Heide JJ, Hepkema BG, Hernandez-Fuentes M, Hypponen E, Johnson T, de Jong PE, Kleefstra N, Lagou V, Lapsley M, Li Y, Loos RJ, Luan J, Luttropp K, Marechal C, Melander O, Munroe PB, Nordfors L, Parsa A, Peltonen L, Penninx BW, Perucha E, Pouta A, Prokopenko I, Roderick PJ, Ruokonen A, Samani NJ, Sanna S, Schalling M, Schlessinger D, Schlieper G, Seelen MA, Shuldiner AR, Sjogren M, Smit JH, Snieder H, Soranzo N, Spector TD, Stenvinkel P, Sternberg MJ, Swaminathan R, Tanaka T, Ubink-Veltmaat LJ, Uda M, Vollenweider P, Wallace C, Waterworth D, Zerres K, Waeber G, Wareham NJ, Maxwell PH, McCarthy MI, Jarvelin MR, Mooser V, Abecasis GR, Lightstone L, Scott J, Navis G, Elliott P, Kooner JS. Genetic loci influencing kidney function and chronic kidney disease. Nat Genet 42: 373–375, 2010 [DOI] [PMC free article] [PubMed] [Google Scholar]
- 8.Chang YPC, Liu X, Kim JDO, Ikeda MA, Layton MR, Weder AB, Cooper RS, Kardia SLR, Rao DC, Hunt SC, Luke A, Boerwinkle E, Chakravarti A. Multiple genes for essential-hypertension susceptibility on chromosome 1q. Am J Hum Genet 80: 253–264, 2007 [DOI] [PMC free article] [PubMed] [Google Scholar]
- 9.Chen G, Adeyemo AA, Zhou J, Chen Y, Doumatey A, Lashley K, Huang H, Agyenim-Boateng K, Eghan JBA, Okafor G, Acheampong J, Oli J, Johnson T, Rotimi C. a genome-wide search for linkage to renal function phenotypes in West Africans with type 2 diabetes. Am J Kidney Dis 49: 394–400, 2007 [DOI] [PubMed] [Google Scholar]
- 10.Chesler EJ, Miller DR, Branstetter LR, Galloway LD, Jackson BL, Philip VM, Voy BH, Culiat CT, Threadgill DW, Williams RW, Churchill GA, Johnson DK, Manly KF. The Collaborative Cross at Oak Ridge National Laboratory: developing a powerful resource for systems genetics. Mamm Genome 19: 382–389, 2008 [DOI] [PMC free article] [PubMed] [Google Scholar]
- 11.Churchill GA, Doerge RW. Empirical threshold values for quantitative trait mapping. Genetics 138: 963–971, 1994 [DOI] [PMC free article] [PubMed] [Google Scholar]
- 12.de Zeeuw D, Remuzzi G, Parving HH, Keane WF, Zhang Z, Shahinfar S, Snapinn S, Cooper ME, Mitch WE, Brenner BM. Albuminuria, a therapeutic target for cardiovascular protection in type 2 diabetic patients with nephropathy. Circulation 110: 921–927, 2004 [DOI] [PubMed] [Google Scholar]
- 13.de Zeeuw D, Remuzzi G, Parving HH, Keane WF, Zhang Z, Shahinfar S, Snapinn S, Cooper ME, Mitch WE, Brenner BM. Proteinuria, a target for renoprotection in patients with type 2 diabetic nephropathy: lessons from RENAAL. Kidney Int 65: 2309–2320, 2004 [DOI] [PubMed] [Google Scholar]
- 14.DiPetrillo K, Tsaih SW, Sheehan S, Johns C, Kelmenson P, Gavras H, Churchill GA, Paigen B. Genetic analysis of blood pressure in C3H/HeJ and SWR/J mice. Physiol Genom 17: 215–220, 2004 [DOI] [PubMed] [Google Scholar]
- 15.DiPetrillo K, Wang X, Stylianou IM, Paigen B. Bioinformatics toolbox for narrowing rodent quantitative trait loci. Trends Genet 21: 683–692, 2005 [DOI] [PubMed] [Google Scholar]
- 16.Eijkelkamp WB, Zhang Z, Remuzzi G, Parving HH, Cooper ME, Keane WF, Shahinfar S, Gleim GW, Weir MR, Brenner BM, de ZD. Albuminuria is a target for renoprotective therapy independent from blood pressure in patients with type 2 diabetic nephropathy: post hoc analysis from the Reduction of Endpoints in NIDDM with the Angiotensin II Antagonist Losartan (RENAAL) trial. J Am Soc Nephrol 18: 1540–1546, 2007 [DOI] [PubMed] [Google Scholar]
- 17.Faruque MU, Chen G, Doumatey A, Huang H, Zhou J, Dunston GM, Rotimi CN, Adeyemo AA. Association of ATP1B1, RGS5 and SELE polymorphisms with hypertension and blood pressure in African-Americans. J Hypertens 29: 1906–1912, 2011 [DOI] [PMC free article] [PubMed] [Google Scholar]
- 18.Feng M, Deerhake ME, Keating R, Thaisz J, Xu L, Tsaih SW, Smith R, Ishige T, Sugiyama F, Churchill GA, DiPetrillo K. Genetic analysis of blood pressure in 8 mouse intercross populations. Hypertension 54: 802–809, 2009 [DOI] [PMC free article] [PubMed] [Google Scholar]
- 19.Garrett MR, Pezzolesi MG, Korstanje R. Integrating human and rodent data to identify the genetic factors involved in chronic kidney disease. J Am Soc Nephrol 21: 398–405, 2010 [DOI] [PMC free article] [PubMed] [Google Scholar]
- 20.Grindle S, Garganta C, Sheehan S, Gile J, Lapierre A, Whitmore H, Paigen B, DiPetrillo K. validation of high-throughput methods for measuring blood urea nitrogen and urinary albumin concentrations in mice. Comp Med 56: 470–474, 2006 [PubMed] [Google Scholar]
- 21.Huang W, Sherman BT, Lempicki RA. Systematic and integrative analysis of large gene lists using DAVID bioinformatics resources. Nat Protocols 4: 44–57, 2009 [DOI] [PubMed] [Google Scholar]
- 22.Ihaka R, Gentleman RR. A language for data analysis and graphics. J Comp Graph Stat 5: 299–314, 1996 [Google Scholar]
- 23.Irizarry RA, Bolstad BM, Collin F, Cope LM, Hobbs B, Speed TP. Summaries of Affymetrix GeneChip probe level data. Nucleic Acids Res 31: e15, 2003 [DOI] [PMC free article] [PubMed] [Google Scholar]
- 24.Iyengar SK, Abboud HE, Goddard KA, Saad MF, Adler SG, Arar NH, Bowden DW, Duggirala R, Elston RC, Hanson RL, Ipp E, Kao WH, Kimmel PL, Klag MJ, Knowler WC, Meoni LA, Nelson RG, Nicholas SB, Pahl MV, Parekh RS, Quade SR, Rich SS, Rotter JI, Scavini M, Schelling JR, Sedor JR, Sehgal AR, Shah VO, Smith MW, Taylor KD, Winkler CA, Zager PG, Freedman BI. Genome-wide scans for diabetic nephropathy and albuminuria in multiethnic populations: the family investigation of nephropathy and diabetes (FIND). Diabetes 56: 1577–1585, 2007 [DOI] [PubMed] [Google Scholar]
- 25.Kang HM, Zaitlen NA, Wade CM, Kirby A, Heckerman D, Daly MJ, Eskin E. Efficient control of population structure in model organism association mapping. Genetics 178: 1709–1723, 2008 [DOI] [PMC free article] [PubMed] [Google Scholar]
- 26.Keane WF, Eknoyan G. Proteinuria, albuminuria, risk, assessment, detection, elimination (PARADE): a position paper of the National Kidney Foundation. Am J Kidney Dis 33: 1004–1010, 1999 [DOI] [PubMed] [Google Scholar]
- 27.Korstanje R, DiPetrillo K. Unraveling the genetics of chronic kidney disease using animal models. Am J Physiol Renal Physiol 287: F347–F352, 2004 [DOI] [PubMed] [Google Scholar]
- 28.Krolewski AS, Poznik GD, Placha G, Canani L, Dunn J, Walker W, Smiles A, Krolewski B, Fogarty DG, Moczulski D, Araki S, Makita Y, Ng DPK, Duggirala R, Rich SS, Warram JH. A genome-wide linkage scan for genes controlling variation in urinary albumin excretion in type II diabetes. Kidney Int 69: 129–136, 2006 [DOI] [PubMed] [Google Scholar]
- 29.Kruglyak L, Lander ES. A nonparametric approach for mapping quantitative trait loci. Genetics 139: 1421–1428, 1995 [DOI] [PMC free article] [PubMed] [Google Scholar]
- 30.McDonough CW, Palmer ND, Hicks PJ, Roh BH, An SS, Cooke JN, Hester JM, Wing MR, Bostrom MA, Rudock ME, Lewis JP, Talbert ME, Blevins RA, Lu L, Ng MCY, Sale MM, Divers J, Langefeld CD, Freedman BI. A genome-wide association study for diabetic nephropathy genes in African Americans. Kidney Int 79: 563–572, 2011 [DOI] [PMC free article] [PubMed] [Google Scholar]
- 31.Mott R, Talbot CJ, Turri MG, Collins AC, Flint J. A method for fine mapping quantitative trait loci in outbred animal stocks. Proc Natl Acad Sci USA 97: 12649–12654, 2000 [DOI] [PMC free article] [PubMed] [Google Scholar]
- 32.Mottl AK, Vupputuri S, Cole SA, Almasy L, Goring HH, Diego VP, Laston S, Shara N, Lee ET, Best LG, Fabsitz RR, MacCluer JW, Umans JG, North KE. Linkage analysis of albuminuria. J Am Soc Nephrol 20: 1597–1606, 2009 [DOI] [PMC free article] [PubMed] [Google Scholar]
- 33.National Kidney Foundation K/DOQI clinical practice guidelines for chronic kidney disease: evaluation, classification, and stratification. Am J Kidney Dis 39: S1–S246, 2002 [PubMed] [Google Scholar]
- 34.Ninomiya T, Perkovic V, de Galan BE, Zoungas S, Pillai A, Jardine M, Patel A, Cass A, Neal B, Poulter N, Mogensen CE, Cooper M, Marre M, Williams B, Hamet P, Mancia G, Woodward M, Macmahon S, Chalmers J. Albuminuria and kidney function independently predict cardiovascular and renal outcomes in diabetes. J Am Soc Nephrol 20: 1813–1821, 2009 [DOI] [PMC free article] [PubMed] [Google Scholar]
- 35.Nishibori Y, Katayama K, Parikka M, Oddsson A, Nukui M, Hultenby K, He B, Ebarasi L, Raschperger E, Norlin J, Uhlen M, Patrakka J, Betsholtz C, Tryggvason K. Glcci1 deficiency leads to proteinuria. J Am Soc Nephrol 22: 2037–2046, 2011 [DOI] [PMC free article] [PubMed] [Google Scholar]
- 36.R: Development Core Team R: A Language and Environment for Statistical Computing. Vienna, Austria: Foundation for Statistical Computing, 2004 [Google Scholar]
- 37.Roberts A, Pardo-Manuel d V, Wang W, McMillan L, Threadgill DW. The polymorphism architecture of mouse genetic resources elucidated using genome-wide resequencing data: implications for QTL discovery and systems genetics. Mamm Genome 18: 473–481, 2007 [DOI] [PMC free article] [PubMed] [Google Scholar]
- 38.Sarnak MJ, Levey AS, Schoolwerth AC, Coresh J, Culleton B, Hamm LL, McCullough PA, Kasiske BL, Kelepouris E, Klag MJ, Parfrey P, Pfeffer M, Raij L, Spinosa DJ, Wilson PW, American Heart Association Councils on Kidney in Cardiovascular Disease, High Blood Pressure Research CCaEa, and Prevention Kidney disease as a risk factor for development of cardiovascular disease: a statement from the American Heart Association Councils on Kidney in Cardiovascular Disease, High Blood Pressure Research, Clinical Cardiology, and Epidemiology and Prevention. Circulation 108: 2154–2169, 2003 [DOI] [PubMed] [Google Scholar]
- 39.Segura J, Campo C, Ruilope LM. Proteinuria: an underappreciated risk factor in cardiovascular disease. Curr Cardiol Reports 4: 458–462, 2002 [DOI] [PubMed] [Google Scholar]
- 40.Smyth GK. Linear models and empirical Bayes methods for assessing differential expression in microarray experiments. Stat Appl Genet Mol Biol 3: i-25, 2004 [DOI] [PubMed] [Google Scholar]
- 41.Thallas-Bonke V, Thorpe SR, Coughlan MT, Fukami K, Yap FYT, Sourris KC, Penfold SA, Bach LA, Cooper ME, Forbes JM. Inhibition of NADPH oxidase prevents advanced glycation end product-mediated damage in diabetic nephropathy through a protein kinase C-alpha-dependent pathway. Diabetes 57: 460–469, 2008 [DOI] [PubMed] [Google Scholar]
- 42.U.S. Renal Data System USRDS 2006 Annual Data Report: Atlas of End-Stage Renal Disease in the United States. Bethesda, MD: National Institutes of Health, National Institute of Diabetes and Digestive and Kidney Diseases, 2006 [Google Scholar]
- 43.Viazzi F, Leoncini G, Conti N, Tomolillo C, Giachero G, Vercelli M, Deferrari G, Pontremoli R. Combined effect of albuminuria and estimated glomerular filtration rate on cardiovascular events and all-cause mortality in uncomplicated hypertensive patients. J Hypertens 28: 848–855, 2010 [DOI] [PubMed] [Google Scholar]
- 44.Yang H, Ding Y, Hutchins LN, Szatkiewicz J, Bell TA, Paigen BJ, Graber JH, de Villena FP, Churchill GA. A customized and versatile high-density genotyping array for the mouse. Nat Methods 6: 663–666, 2009 [DOI] [PMC free article] [PubMed] [Google Scholar]
Associated Data
This section collects any data citations, data availability statements, or supplementary materials included in this article.