

Abstract
The progressive and latent nature of neurodegenerative diseases, such as Alzheimer’s disease (AD) indicates the role of epigenetic modification in disease susceptibility. Previous studies from our lab show that developmental exposure to lead (Pb) perturbs the expression of AD-associated proteins. In order to better understand the role of DNA methylation as an epigenetic modifications mechanism in gene expression regulation, an integrative study of global gene expression and methylation profiles is essential. Given the different formats of gene expression and methylation data, combining these data for integrative analysis can be challenging. In this paper we describe a method to integrate and analyze gene expression and methylation arrays. Methylation array raw data contain the signal intensities of each probe of CpG sites, whereas gene expression data measure the signal intensity values of genes. In order to combine these data, methylation data of CpG sites have to be associated with genes.
Keywords: Epigenetics, Gene Expression Arrays, Methylation Arrays, Bioinformatics, Lead (Pb)
1. INTRODUCTION
There are various studies indicating that global epigenetic modification, such as DNA methylation and chromatin modification, are directly influenced by the environment, and play an important role in the developmental origin of adult disease susceptibility (Aguilera et al. , 2010, Dolinoy et al. , 2007, Jirtle and Skinner, 2007). This is due to the fact that epigenetic alterations have an important effect on gene expression regulation (Movassagh et al. , 2010). The relationship between genetics, gene expression and DNA methylation has been mostly limited to studies focusing on specific genes and transcripts in individual cells or tissues (Li et al. , 2009, Movassagh, Choy, 2010). However, the recent development of genome-wide technologies provides unprecedented opportunities to expand our view of the relationship between the genome, transcriptome and methylome. Hence, the integration of genetic and epigenetic data promises to provide insight into the mechanisms affecting epigenetic alteration, and consequently gene expression and disease susceptibility. Studies from our lab on Alzheimer’s disease (AD), which is a progressive neurodegenerative disorder, appearing at old age, show that AD may have a developmental origin (Wu et al. , 2008, Zawia and Basha, 2005). Lead (Pb) exposure at an early age influences the expression and regulation of AD-related genes later in life. These studies focused on AD-related genes; however a genome-wide analysis of gene expression and DNA methylation is essential to assess the impact of time and environmental exposure of Pb on the genome and epigenome maps. In this paper we describe a method to integrate and analyze gene expression and methylation arrays. Given the different formats of gene expression and methylation data, combining these data for integrative analysis can be challenging. Methylation array raw data contain the signal intensities of each probe of CpG sites, whereas gene expression data measure the signal intensity values of genes. In order to combine these data, methylation data of CpG sites have to be associated with genes.
2. METHODS AND MATERIALS
2.1. Animal exposure
C57Bl6 mice were bred in-house at the University of Rhode Island. The experiment was designed as in previous studies (Basha et al. , 2005, Basha et al. , 2003). Twenty-four hours after the birth of a new mouse dam is Post-natal Day One (PND1). Male pups from the different dams were randomized, pooled and divided into the two following groups: 1) Control-no exposure to Pb and 2) Pb/E - in utero Exposure to Pb beginning on gestational day 13 until PND20. All the pups born from control dams are pooled and randomly reassigned to an unexposed mother. Once the pups are born from exposed dams, they are randomized and reassigned randomly to mothers in order to eliminate any litter effect. In the control conditions, the mice had freely accessible deionized drinking water. In the Pb/E exposure, 0.2% Pb-acetate (Sigma Chemical Company, St. Louis, MO) was added to the deionized drinking water of the pregnant female and the Pb/E dam group was exposed to the Pb drinking water through the mother’s milk. Food was freely accessible throughout the study. The selected time points of PND 20 and 700 represented early and late time points of the animal for microarray analysis. The animals were sacrificed following CO2 exposure at day twenty and at two years of age and the total frontal cortical brain regions were isolated and stored at −80°C until future use. All animal procedures were conducted in accordance to the protocol approved by the Institutional Animal Care and Use Committee of the University of Rhode Island.
2.2. NimbleGen cDNA microarray
RNA from the mouse neocortex, (three biological replicates/age/condition; 12 arrays total) was hybridized to the NimbleGen 12 × 135K array chip (Madison, WI). The samples were sent for array hybridization to the Keck Biotechnology Resource Laboratory at Yale University in New Haven, and the NimbleGen protocol was followed. The NimbleScan software normalized the raw expression data using quantile normalization methods and normalized gene calls were generated using the Robust Multichip Average (RMA) algorithm (Bolstad et al. , 2003, Irizarry et al. , 2003).
2.3. NimbleGen cDNA methylation array
DNA from the neocortex of three animals per age and condition was extracted from brain samples using standard procedures per the QIAamp kit. These data from these two groups was utilized for this analysis: C20 and E700. For preparation for the microarray, DNA was isolated and methylated according to the methlyated DNA immunopreciptation (MeDIP) protocol from the Weber group (Weber et al. , 2005). Nimblegen (Madison, WI) tilling arrays were used to scan 16,000 CpG islands in promoter regions. The samples were sent for array hybridization to the Keck Biotechnology Resource Laboratory at Yale University in New Haven, and the NimbleGen protocol was followed. The fluorescent images were imported to the NimbleScan software and images were extracted.
2.4. Bioinformatics
The R programming language and Bioconductor Library(Gentleman et al. , 2004) were used to manage and analyze the microarray data. In addition, custom written code using Perl was used for data preparation. We averaged the normalized data of the three samples for each age group. The gene expression data of age group control PND20(C20) was used as the base values to identify the two fold changes in other age groups. DNA methylation data of control PND 20 (C20) and exposed PND 700 (E700) were normalized to be correlated with gene expression data. We mapped the averaged normalized data of DNA methylation of CpG probes to the nearest gene using Perl scripts based on Ensembl gene annotation (Flicek et al. , 2011). We retained only the subset of probes associated with genes that were represented on the Nimblegen gene expression microarray. This resulted in the retention of 15,035 genes associated with the methylation data of CpG probs. Then, the methylation data were linearly transformed to the gene expression data range to allow for a proper correlation. Differential gene expression and differential methylation of C20 and E700 samples were scatter plotted using the “plot” function available in R. The correlation analysis were performed using the “cor.test” fucntion in R. Genes with ≥2 fold change between C20 and E700 in gene expression were identified which resulted in 563 genes that have associated methylation data. Gene expression and Methylation signal intensity values of these genes were drawn in a circular view using CIRCOS visualization software (Krzywinski et al. , 2009). Statistically significant genes in differential expression (down- or up-regulation) between C20 and E700 samples were determined using student t-test with p value ≤0.01. This resulted in 165 genes, however, only 50 genes have associated methylation data. Then the differential gene expression and differential methylation of these genes were line plotted.
3. RESULTS AND DISCUSSION
The results of two groups: control PND 20 (C20) and Pb-exposed PND 700 (E700), with three animals averaged for each group, are presented. C20 was not compared to E20 because our analysis showed little differences occurring at this early stage (Dosunmu et al., 2012). We determined the relationship between differential gene expression and the differential methylation of (E700 -C20) groups by creating scatter plot, as shown in Figure 1.Hypermethylated genes that were down-regulated clustered in the top left quadrant which is consistent with the hypothesis of the role of DNA methylation in gene silencing. Other quadrants, which consisted of much smaller sets of genes, did not exhibit a clear correlation between gene expression and methylation. These genomic and epigenomic reference maps suggest that the overall impact of early life exposure to Pb is to repress genes in old age; however, select sets of genes appear to have altered expression not directly related to DNA methylation and may involve other epigenetic pathways (See lower quadrants of Figure 1).
Figure 1. Differential Gene Expression and Methylation Correlation.
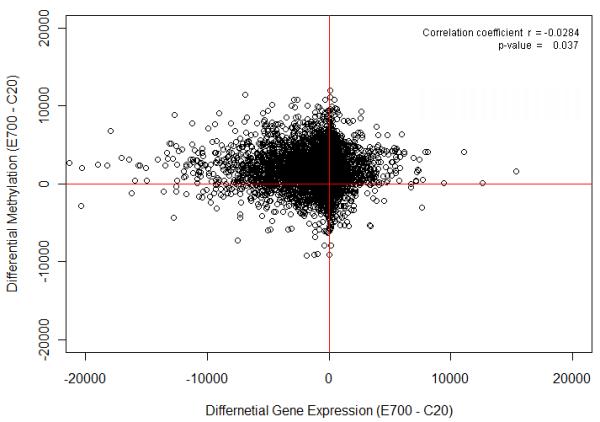
A scatter plot of differential gene expression of control PND20 and developmentally-exposed PND700 (E700 - C20) vs the differential methylation of control PND20 and developmentally-exposed PND700 (E700 - C20). Methylation signal intensity data were linearly transformed.
To visualize whole genome, transcriptome and methylome of genes with ≥2 fold change, we used CIRCOS software. The circular view of gene expression and DNA methylation of C20 and E700 in correspondence to genes and chromosome can be used to find a correlation in a certain region on the chromosome or to find a clear correlation for specific genes. This global view when amplified in view can help one appreciate the relationship between chromosomes, gene expression and DNA methylation and how it may change over time.
Finally, plotting gene expression and methylation profile of significant genes alongside each other in a line plot as shown in Figure 3, revealed a significant inverse-correlation between gene expression and methylation signals. We also found that the methylation pattern early in life is maintained in old age with minor changes related to reprogrammed developmental exposure. Consistent with gene expression profiling, the methylation profiles show that only a small percent of genes are affected by the developmental exposure to Pb. It is important to note here that this is a whole tissue analysis and that cell-type specificity in both gene expression and DNA methylation exists. However, the changes late in life compared to early life maybe attributed to neurons because they last the life of the animal, while glial cells have a lot of turnover during the lifespan.
Figure 3. Significant Genes Differential Profile.

A line plot of the differential gene expression and methylation of significant genes (50 genes). Differential gene expression of control PND20 and developmentally-exposed PND700 (E700 - C20) vs the differential methylation of control PND20 and developmentally-exposed PND700 (E700 - C20). Methylation data were linearly transferred and log2 was applied to gene expression and methylation signal intensity values.
4. CONCLUSION
Our data show that the gene expression changes are latent. However, the integration of genomic and epigenomic data reveals that the effects of early Pb exposure on the methylation of genes maybe persistent. DNA hypermethylation is shown to have a strong correlation with the down-regulation of gene expression suggesting that early life exposure to Pb interferes with the methylation pattern of genes, which is then sustained throughout life, and has an impact on an animal’s ability to respond in old age.
Figure 2. Gene Expression and Methylation Profile.

A circular representation of the genes with ≥2 fold change (563 genes) in gene expression of control PND20 and developmentally-exposed PND700. The tracks from the outside represent: (1) Genes, (2) Chromosomes, (3) Gene Expression of Control PND20, (4) Methylation of Control PND20, (5) Gene Expression of developmentally-exposedPND700, (6) Methylation of developmentally-exposed PND700.
ACKNOWLEDGEMENTS
This research was supported by the Intramural Research Program of the National Institutes of Health (NIH), National Institute of Environmental Health Sciences (NIEHS) and by grants (ES013022 and AG027246) from the NIH awarded to NHZ. The research core facility was funded (P20RR016457) by the National Center for Research Resources (NCRR), a component of NIH.
Footnotes
Publisher's Disclaimer: This is a PDF file of an unedited manuscript that has been accepted for publication. As a service to our customers we are providing this early version of the manuscript. The manuscript will undergo copyediting, typesetting, and review of the resulting proof before it is published in its final citable form. Please note that during the production process errors may be discovered which could affect the content, and all legal disclaimers that apply to the journal pertain.
REFERENCES
- Aguilera O, Fernandez AF, Munoz A, Fraga MF. Epigenetics and environment: a complex relationship. J Appl Physiol. 2010;109:243–51. doi: 10.1152/japplphysiol.00068.2010. [DOI] [PubMed] [Google Scholar]
- Basha MR, Murali M, Siddiqi HK, Ghosal K, Siddiqi OK, Lashuel HA, et al. Lead (Pb) exposure and its effect on APP proteolysis and Abeta aggregation. FASEB J. 2005;19:2083–4. doi: 10.1096/fj.05-4375fje. [DOI] [PubMed] [Google Scholar]
- Basha MR, Wei W, Brydie M, Razmiafshari M, Zawia NH. Lead-induced developmental perturbations in hippocampal Sp1 DNA-binding are prevented by zinc supplementation: in vivo evidence for Pb and Zn competition. Int J Dev Neurosci. 2003;21:1–12. doi: 10.1016/s0736-5748(02)00137-5. [DOI] [PubMed] [Google Scholar]
- Bolstad BM, Irizarry RA, Astrand M, Speed TP. A comparison of normalization methods for high density oligonucleotide array data based on variance and bias. Bioinformatics. 2003;19:185–93. doi: 10.1093/bioinformatics/19.2.185. [DOI] [PubMed] [Google Scholar]
- Dolinoy DC, Weidman JR, Jirtle RL. Epigenetic gene regulation: linking early developmental environment to adult disease. Reprod Toxicol. 2007;23:297–307. doi: 10.1016/j.reprotox.2006.08.012. [DOI] [PubMed] [Google Scholar]
- Dosunmu R, Alashwal H, Zawia NH. Genome-wide expression and methylation profiling in the aged rodent brain due to early-life Pb exposure and its relevance to aging. Mech Ageing Dev. 2012 doi: 10.1016/j.mad.2012.05.003. doi:10.1016/j.mad.2012.05.003. [DOI] [PMC free article] [PubMed] [Google Scholar]
- Flicek P, Amode MR, Barrell D, Beal K, Brent S, Chen Y, et al. Ensembl 2011. Nucleic Acids Res. 2011;39:D800–6. doi: 10.1093/nar/gkq1064. [DOI] [PMC free article] [PubMed] [Google Scholar]
- Gentleman RC, Carey VJ, Bates DM, Bolstad B, Dettling M, Dudoit S, et al. Bioconductor: open software development for computational biology and bioinformatics. Genome Biol. 2004;5:R80. doi: 10.1186/gb-2004-5-10-r80. [DOI] [PMC free article] [PubMed] [Google Scholar]
- Irizarry RA, Hobbs B, Collin F, Beazer-Barclay YD, Antonellis KJ, Scherf U, et al. Exploration, normalization, and summaries of high density oligonucleotide array probe level data. Biostatistics. 2003;4:249–64. doi: 10.1093/biostatistics/4.2.249. [DOI] [PubMed] [Google Scholar]
- Jirtle RL, Skinner MK. Environmental epigenomics and disease susceptibility. Nat Rev Genet. 2007;8:253–62. doi: 10.1038/nrg2045. [DOI] [PMC free article] [PubMed] [Google Scholar]
- Krzywinski M, Schein J, Birol I, Connors J, Gascoyne R, Horsman D, et al. Circos: an information aesthetic for comparative genomics. Genome Res. 2009;19:1639–45. doi: 10.1101/gr.092759.109. [DOI] [PMC free article] [PubMed] [Google Scholar]
- Li M, Balch C, Montgomery JS, Jeong M, Chung JH, Yan P, et al. Integrated analysis of DNA methylation and gene expression reveals specific signaling pathways associated with platinum resistance in ovarian cancer. BMC Med Genomics. 2009;2:34. doi: 10.1186/1755-8794-2-34. [DOI] [PMC free article] [PubMed] [Google Scholar]
- Movassagh M, Choy MK, Goddard M, Bennett MR, Down TA, Foo RS. Differential DNA methylation correlates with differential expression of angiogenic factors in human heart failure. PLoS One. 2010;5:e8564. doi: 10.1371/journal.pone.0008564. [DOI] [PMC free article] [PubMed] [Google Scholar]
- Weber M, Davies JJ, Wittig D, Oakeley EJ, Haase M, Lam WL, et al. Chromosome-wide and promoter-specific analyses identify sites of differential DNA methylation in normal and transformed human cells. Nat Genet. 2005;37:853–62. doi: 10.1038/ng1598. [DOI] [PubMed] [Google Scholar]
- Wu J, Basha MR, Brock B, Cox DP, Cardozo-Pelaez F, McPherson CA, et al. Alzheimer’s disease (AD)-like pathology in aged monkeys after infantile exposure to environmental metal lead (Pb): evidence for a developmental origin and environmental link for AD. J Neurosci. 2008;28:3–9. doi: 10.1523/JNEUROSCI.4405-07.2008. [DOI] [PMC free article] [PubMed] [Google Scholar]
- Zawia NH, Basha MR. Environmental risk factors and the developmental basis for Alzheimer’s disease. Rev Neurosci. 2005;16:325–37. doi: 10.1515/revneuro.2005.16.4.325. [DOI] [PubMed] [Google Scholar]