Abstract
Insulin resistance in skeletal muscle and liver may play a primary role in the development of type 2 diabetes mellitus, and the mechanism by which insulin resistance occurs may be related to alterations in fat metabolism. Transgenic mice with muscle- and liver-specific overexpression of lipoprotein lipase were studied during a 2-h hyperinsulinemic–euglycemic clamp to determine the effect of tissue-specific increase in fat on insulin action and signaling. Muscle–lipoprotein lipase mice had a 3-fold increase in muscle triglyceride content and were insulin resistant because of decreases in insulin-stimulated glucose uptake in skeletal muscle and insulin activation of insulin receptor substrate-1-associated phosphatidylinositol 3-kinase activity. In contrast, liver–lipoprotein lipase mice had a 2-fold increase in liver triglyceride content and were insulin resistant because of impaired ability of insulin to suppress endogenous glucose production associated with defects in insulin activation of insulin receptor substrate-2-associated phosphatidylinositol 3-kinase activity. These defects in insulin action and signaling were associated with increases in intracellular fatty acid-derived metabolites (i.e., diacylglycerol, fatty acyl CoA, ceramides). Our findings suggest a direct and causative relationship between the accumulation of intracellular fatty acid-derived metabolites and insulin resistance mediated via alterations in the insulin signaling pathway, independent of circulating adipocyte-derived hormones.
Keywords: skeletal muscle, liver
Type 2 diabetes mellitus is the most common metabolic disease in the world, afflicting more than 120 million people, and more than 220 million people are projected to have the disease by the year 2010 (1). Although the primary factors causing this disease are unknown, it is clear that insulin resistance is a major factor in its pathogenesis. Studies have suggested an important role of fat-derived circulating hormones such as tumor necrosis factor-α, leptin, adipsin, Acrp30/adipoQ (adipocyte complement-related protein of 30 kDa), and, most recently, resistin in causing whole-body insulin resistance related to obesity (2–11). Liver and skeletal muscle are the two most important insulin-responsive organs in the body (12), and it is also possible that accumulation of locally derived fat metabolites in these tissues may be important factors contributing to insulin resistance. To directly address this question, we examined mice with tissue- (muscle or liver) specific overexpression of lipoprotein lipase (LPL). Because LPL is the rate-controlling enzyme involved with triglyceride hydrolysis (13), we hypothesized that tissue-specific overexpression of LPL might represent a powerful tool to selectively increase fatty acid delivery to specific insulin-sensitive tissues and determine whether this in turn would affect insulin action. Using this approach, we examined the cause-and-effect relationship between fat and insulin resistance as well as the underlying mechanism.
Materials and Methods
Animals and Surgery.
To examine the effect of muscle-specific overexpression of LPL on insulin action and signaling, male muscle-LPL (low expression line; n = 7) and age-matched wild-type littermates (control; n = 6) were studied. To examine the effect of liver-specific overexpression of LPL on insulin action and signaling, male liver-LPL (low expression line; n = 7) and age-matched wild-type littermates (control; n = 3) were studied. Additionally, liver-specific LPL was overexpressed onto heterozygous whole-body LPL knockout mice (liver-LPL/het KO; n = 3) and studied with littermate controls (het KO; n = 6). At least 4 days before hyperinsulinemic–euglycemic clamp experiments, an indwelling catheter was inserted in the left internal jugular vein while the mice were anesthetized with ketamine and xylazine (14). Animals were housed under controlled temperature (23°C) and lighting (12 h light; 0600–1800 h, 12 h dark; 1800–0600 h) with free access to water and standard mouse chow.
Glucose Tolerance Tests.
Glucose tolerance tests with i.p. injection of 20% glucose (1 mg/g body weight) were performed in additional muscle-LPL, liver-LPL, and respective control mice (n = 4 for each group) after an overnight fast.
In Vivo Insulin Action.
A 120-min hyperinsulinemic– (15 pmol/kg/min) euglycemic clamp was conducted (14) after an overnight fast, with a prime-continuous infusion of human insulin (Humulin; Novo Nordisk, Dagsvaert, Denmark), and 20% glucose was infused at variable rates to maintain plasma glucose at basal concentrations. Basal and insulin-stimulated whole-body glucose flux was estimated by using a prime-continuous infusion of [3-3H]glucose (10 μCi bolus, 0.1 μCi/min; NEN) before and during the clamps, respectively, and 2-deoxy-d-[1-14C]glucose (2-[14C]DG; NEN) was administered as a bolus (10 μCi) at 75 min after the start of clamps to estimate insulin-stimulated glucose uptake and metabolism in individual tissues (14). At the end of clamps, animals were anesthetized with sodium pentobarbital injection (2 mg/kg body weight), and tissues were taken for analysis. Plasma concentrations of [3-3H]glucose, 2-[14C]DG, and 3H2O as well as tissue concentrations of 2-[14C]DG-6-phosphate, 3H in tissue glycogen, and triglyceride were determined as previously described (14).
Insulin Signaling.
Insulin receptor substrate (IRS)-1- and IRS-2-associated phosphatidylinositol (PI) 3-kinase activity in skeletal muscle (gastrocnemius) and liver, respectively, was measured by immunoprecipitating IRS-1 and IRS-2 (antibodies kindly provided by Morris White, Joslin Diabetes Center, Boston, MA), as described (14). Tyrosine phosphorylation of insulin receptor in skeletal muscle and liver was measured by using antiphosphotyrosine antibody (Upstate Biotechnology, Lake Placid, NY).
RNA Analysis for Transgene Expression.
RNA was prepared from gastrocnemius muscles of muscle-LPL and control mice by using a kit (TRIzol Reagent, GIBCO/BRL) (15). The level of LPL mRNA expression in the muscle of muscle-LPL mice was increased by 4-fold as compared with control mice (381 ± 28 vs. 98 ± 48 density in the control mice; P < 0.005), and LPL activity in the liver of liver-LPL mice was increased by 4-fold (P < 0.01) compared with control mice, as previously described (16).
Electron Microscopy Analysis.
Skeletal muscle (gastrocnemius) and liver specimens were freshly obtained, stained with uranyl acetate and lead citrate, and examined in a Philips 410 (Eindhoven, The Netherlands) electron microscope.
Mass Spectrometry.
Skeletal muscle (gastrocnemius) and liver of additional muscle-LPL (n = 6≈8), liver-LPL (n = 5), and control mice (n = 7≈10) were studied to determine the concentrations of intracellular fatty acid-derived metabolites (i.e., fatty acyl CoA, ceramide, and diacylglycerol) by using mass spectrometry and the modified method of Bligh and Dyer (17).
Statistical Analysis.
Data are expressed as means ± SE. The significance of the difference in mean values between muscle-LPL and control mice, liver-LPL and control mice, and liver-LPL/het KO and het KO mice was evaluated by using the unpaired Student's t test.
Results and Discussion
Plasma Profiles and i.p. Glucose Tolerance Tests.
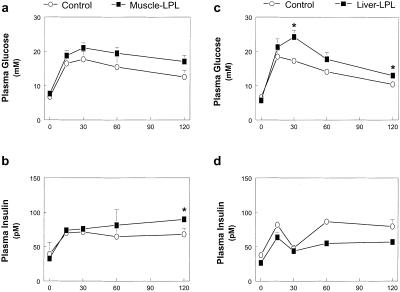
Fasting plasma glucose, insulin, free fatty acids, triglyceride, glucagon, and leptin concentrations were normal in mice with muscle-specific (muscle-LPL) and liver-specific (liver-LPL) overexpression of LPL as compared with their respective control littermates (Table 1). i.p. glucose tolerance tests revealed that muscle-LPL and liver-LPL mice had impairment in glucose tolerance (Fig. 1 a and c), whereas the insulin response to the glucose load was normal in these mice (Fig. 1 b and d).
Table 1.
Metabolic parameters during basal and hyperinsulinemic-euglycemic clamp periods in the control vs. muscle-LPL, liver-LPL, and liver-LPL/het KO groups at 12≈17 weeks of age
| n | Body weight, g | Basal period
|
Clamp period
|
|||||||
|---|---|---|---|---|---|---|---|---|---|---|
| Plasma glucose, mM | Plasma insulin, pM | Plasma FFA†, mM | Plasma TG†, mg/dl | Plasma glucagon†, pg/ml | Plasma leptin†, ng/ml | Plasma glucose, mM | Plasma insulin, pM | |||
| Wild type | 6 | 18 ± 1 | 7.1 ± 0.1 | 62 ± 5 | 0.9 ± 0.2 | 36 ± 5 | 86 ± 7 | 1.8 ± 0.2 | 6.1 ± 0.1 | 637 ± 12 |
| Muscle-LPL | 7 | 18 ± 1 | 7.0 ± 0.1 | 60 ± 7 | 0.9 ± 0.2 | 33 ± 10 | 76 ± 4 | 2.0 ± 0.4 | 6.5 ± 0.1 | 658 ± 16 |
| Wild type | 3 | 27 ± 1 | 7.1 ± 0.3 | 70 ± 5 | 1.3 ± 0.2 | 47 ± 7 | 89 ± 3 | 1.9 ± 0.1 | 6.7 ± 0.4 | 669 ± 45 |
| Liver-LPL | 7 | 30 ± 2 | 6.6 ± 0.6 | 80 ± 4 | 1.0 ± 0.4 | 64 ± 28 | 103 ± 13 | 1.7 ± 0.3 | 7.4 ± 0.9 | 734 ± 96 |
| Het KO | 6 | 26 ± 4 | 7.6 ± 0.3 | 56 ± 16 | ND | ND | ND | ND | 5.8 ± 0.4 | 738 ± 87 |
| Liver-LPL/Het KO | 3 | 28 ± 1 | 7.3 ± 0.7 | 73 ± 10 | ND | ND | ND | ND | 6.1 ± 0.2 | 717 ± 77 |
P < 0.05 vs. control group by the unpaired Student's t test.
Plasma free fatty acids (FFA), triglyceride (TG), glucagon, and leptin concentrations were measured from additional mice (n = 4 for each group) that underwent intraperitoneal glucose tolerance tests. ND, not determined. Het KO (heterozygous LPL knockout), Liver-LPL/Het KO (liver-LPL overexpressed onto het KO).
Figure 1.
i.p. glucose tolerance tests. (a) Plasma glucose concentrations in the control (○) and muscle-LPL (■) groups. (b) Plasma insulin concentrations in the control (○) and muscle-LPL (■) groups. (c) Plasma glucose concentrations in the control (○) and liver-LPL (■) groups. (d) Plasma insulin concentrations in the control (○) and liver-LPL (■) groups. Plasma insulin concentrations were taken from two liver-LPL and two corresponding control mice because of a difficulty in blood sampling during the i.p. glucose tolerance tests. Values are means ± SE for four experiments. *, P < 0.05 vs. control group.
In Vivo Glucose Flux in Muscle-LPL Mice.
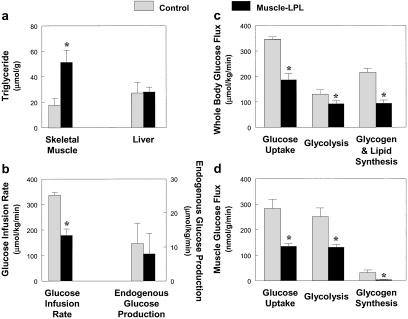
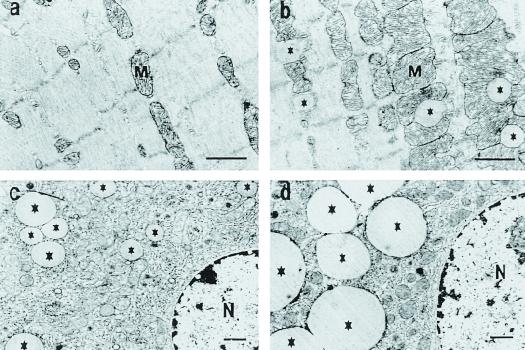
We performed a 2-h hyperinsulinemic–euglycemic clamp in awake mice to examine the effect of tissue-specific increase in fat delivery to muscle and liver on insulin action and signaling in these tissues. Muscle-LPL mice had a 3-fold increase in muscle triglyceride content without changes in liver triglyceride content as compared with control mice (Fig. 2a). Electron microscopic analysis of muscles from muscle-LPL mice also showed an increased number of lipid droplets around the mitochondrial region (Fig. 3 a and b). The glucose infusion rate required to maintain euglycemia increased rapidly in control mice and reached a steady-state level within 90 min. In contrast, steady-state glucose infusion rates were 47% lower in muscle-LPL mice, reflecting whole-body insulin resistance in these mice (Fig. 2b). Consistent with this finding, insulin-stimulated whole-body glucose uptake was decreased by 46% in muscle-LPL mice, whereas insulin-stimulated whole-body glycolysis and glycogen/lipid synthesis were decreased by 29 and 56%, respectively, in these mice (Fig. 2c). Moreover, insulin-stimulated glucose uptake in skeletal muscle (gastrocnemius) was decreased by 52% in muscle-LPL mice, and this decrease accounted for most of the whole-body insulin resistance in these mice (Fig. 2d). Insulin-stimulated glycolysis and glycogen synthesis in skeletal muscle were also decreased by 48 and 88%, respectively, in the muscle-LPL mice (Fig. 2d). Glucose transport is rate-controlling for glucose utilization in skeletal muscle (18), and it is likely that decreases in insulin-stimulated muscle glucose transport accounted for the parallel decreases in glycolysis and glycogen synthesis in muscle-LPL mice. In contrast to the decreases in whole-body and muscle glucose uptake, insulin's ability to suppress endogenous glucose production (EGP) was normal in muscle-LPL mice (Fig. 2b). These findings indicate that muscle-specific overexpression of LPL resulted in muscle-specific insulin resistance but did not affect insulin action in liver.
Figure 2.
Whole-body and skeletal muscle glucose flux in vivo in the control (open bars) and muscle-LPL (filled bars) mice. (a) Intracellular triglyceride concentration in skeletal muscle (Left) and liver (Right). (b) Steady-state glucose infusion rate (Left), obtained from averaged rates of 90–120 min of hyperinsulinemic–euglycemic clamps. Insulin-stimulated rates of EGP (Right). (c) Insulin-stimulated whole-body glucose uptake, glycolysis, and glycogen/lipid synthesis in vivo. (d) Insulin-stimulated glucose uptake, glycolysis, and glycogen synthesis in skeletal muscle in vivo. Values are means ± SE for 6≈7 experiments. *, P < 0.05 vs. control group.
Figure 3.
Electron microscopy of skeletal muscle and liver. Skeletal muscle of control (a) and muscle-LPL mice (b). Liver of control (c) and liver-LPL mice (d). (Bars, 1 μm.) *, lipid droplets, M, mitochondria, N, nucleus.
Insulin Signaling in Muscle-LPL Mice.
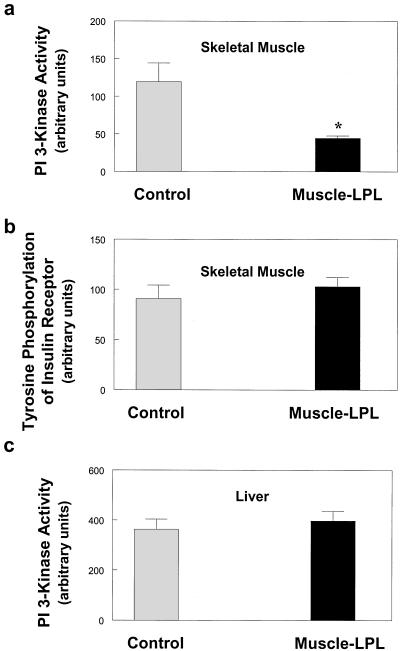
Decreases in muscle insulin action were associated with a 63% decrease in insulin-stimulated activation of IRS-1-associated PI 3-kinase (Fig. 4a). Recent studies have shown that IRS-1-associated PI 3-kinase is an important intracellular mediator of insulin signaling in skeletal muscle (19), and insulin stimulation of both glucose transport and glycogen synthase activity has been associated with activation of IRS-1-associated PI 3-kinase in skeletal muscle (20). These findings suggest that defects in muscle insulin action may be secondary to the observed defects in muscle insulin signaling in muscle-LPL mice. In contrast to decreases in insulin-stimulated activation of IRS-1-associated PI 3-kinase, insulin-stimulated tyrosine phosphorylation of the insulin receptor in the skeletal muscle of muscle-LPL mice was unaltered compared with control mice (Fig. 4b). This finding suggests that the defect in muscle insulin signaling of muscle-LPL mice was not because of an alteration in plasma membrane or membrane-associated insulin receptors (21). It further suggests that the mechanism of blunted insulin signaling with muscle-LPL overexpression occurs downstream of the insulin receptor possibly at the level of IRS-1 and IRS-2.
Figure 4.
Insulin signaling in the skeletal muscle and liver of control (open bars) and muscle-LPL (filled bars) mice. (a) IRS-1-associated PI 3-kinase activity in skeletal muscle. (b) Tyrosine phosphorylation of insulin receptor in skeletal muscle. (c) IRS-2-associated PI 3-kinase activity in liver. Values are means ± SE for 6≈7 experiments. *, P < 0.05 vs. control group.
Despite defects in insulin action and signaling in skeletal muscle, insulin's ability to activate IRS-2-associated PI 3-kinase in the liver (Fig. 4c) was unaltered in muscle-LPL mice. Recent studies in IRS-2 gene-disrupted mice have suggested that IRS-2 is important in mediating insulin activation of hepatic glucose metabolism (i.e., insulin's ability to suppress EGP) (19, 22). In this regard, a lack of effect of muscle-specific overexpression of LPL on insulin activation of IRS-2 associated PI 3-kinase in liver may explain why insulin suppresses EGP normally in these mice. Moreover, insulin-stimulated glucose uptake in epididymal white adipose tissue was not altered in the muscle-LPL mice (106 ± 18 vs. 105 ± 18 nmol/g/min in the control mice; P > 0.05). These results show that muscle-specific overexpression of LPL causes muscle-specific insulin resistance with normal insulin action in liver and white adipose tissue.
In Vivo Glucose Flux in Liver-LPL Mice.
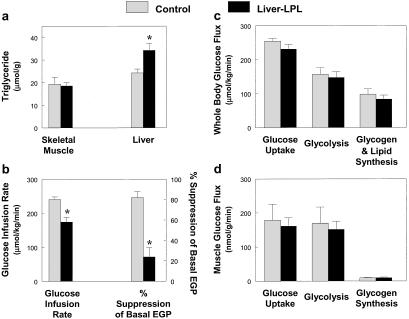
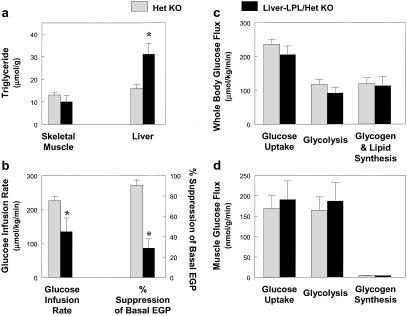
The effect of liver-specific increase in LPL expression on insulin action and signaling was also examined during a 2-h hyperinsulinemic–euglycemic clamp. Liver-LPL mice had a 2-fold increase in liver triglyceride content without changes in muscle triglyceride content as compared with the control mice (Fig. 5a). Electron microscopy analysis of liver from liver-LPL mice also revealed an increased number and size of lipid droplets around the perinuclear region (Fig. 3 c and d). The steady-state glucose infusion rate required to maintain euglycemia was decreased by 29% in the liver-LPL mice (Fig. 5b), suggesting that the liver-LPL mice were insulin resistant. Basal EGP was unaltered in the liver-LPL mice (P > 0.05); however, insulin's ability to suppress EGP was significantly impaired in the liver-LPL mice (Fig. 5b). To further amplify any effects that liver-specific overexpression of LPL might have on hepatic metabolism, liver-specific LPL was overexpressed onto heterozygous whole-body LPL knockout mice (liver-LPL/het KO). These mice were compared with the heterozygous whole-body LPL knockout mice (het KO) that served as a control group for this study. Liver-LPL/het KO mice showed similar increases in liver triglyceride content without changes in muscle triglyceride content as compared with the het KO mice (Fig. 6a). Liver-LPL/het KO mice were also insulin resistant, as reflected by decreases in steady-state glucose infusion rate and insulin-stimulated percent suppression of basal EGP (Fig. 6b).
Figure 5.
Whole-body and skeletal muscle glucose flux in vivo in the control (open bars) and liver-LPL (filled bars) mice. (a) Intracellular triglyceride concentration in skeletal muscle (Left) and liver (Right). (b) Steady-state glucose infusion rate (Left). Insulin-stimulated percent suppression of basal EGP (Right). (c) Insulin-stimulated whole-body glucose uptake, glycolysis, and glycogen/lipid synthesis in vivo. (d) Insulin-stimulated glucose uptake, glycolysis, and glycogen synthesis in skeletal muscle in vivo. Values are means ± SE for 3≈7 experiments. *, P < 0.05 vs. control group.
Figure 6.
Whole-body and skeletal muscle glucose flux in vivo in the het KO (open bars) and liver-LPL/het KO (filled bars) mice. (a) Intracellular triglyceride concentration in skeletal muscle (Left) and liver (Right). (b) Steady-state glucose infusion rate (Left). Insulin-stimulated percent suppression of basal EGP (Right). (c) Insulin-stimulated whole-body glucose uptake, glycolysis, and glycogen/lipid synthesis in vivo. (d) Insulin-stimulated glucose uptake, glycolysis, and glycogen synthesis in skeletal muscle in vivo. Values are means ± SE for 3≈6 experiments. *, P < 0.05 vs. control group.
Insulin suppresses EGP both by inhibiting glucose production and stimulating net hepatic glucose uptake. However, both of these processes are intimately linked in that activation of net glycogen synthesis is a key step in suppressing net EGP by diverting glucose 6-phosphate flux derived from gluconeogenesis into glycogen (by the indirect pathway), as opposed to its release into the circulation (23). To assess the impact of liver-specific LPL overexpression on insulin-stimulated hepatic glycogen synthesis, we assessed the rate of 3H-glucose incorporation into hepatic glycogen, an index of hepatic glycogen synthesis via the direct pathway, and found that the liver-LPL mice had a ≈73% reduction in the rate of hepatic glycogen synthesis as compared with control mice (4.2 ± 1.4 vs. 15.4 ± 4.1 nmol/g/min in controls; P < 0.05). These data suggest that accumulation of intrahepatic fatty acid-derived metabolites leads to a defect in insulin activation of glycogen synthase (20), leading to defects in insulin-stimulated liver glycogen synthesis and insulin's ability to suppress EGP in the liver-LPL mice.
Insulin Signaling in Liver-LPL Mice.
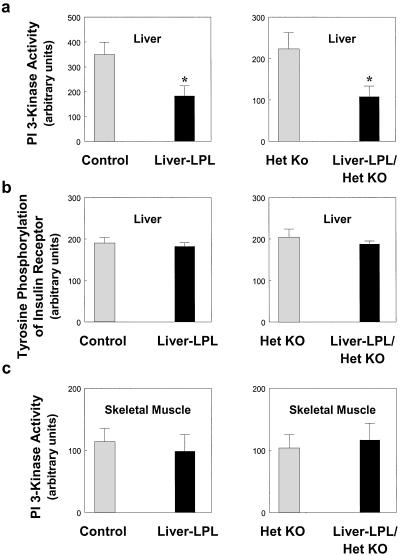
We found a 58% decrease in insulin-stimulated IRS-2-associated PI 3-kinase activity, which is a key step in the activation of glycogen synthase activity (24), in the liver of both liver-LPL and liver-LPL/het KO mice as compared with their respective control mice (Fig. 7a). This finding suggests that the defect in liver insulin action may be secondary to the observed defects in liver insulin signaling in the liver-LPL mice. In contrast to decreases in insulin-stimulated IRS-2-associated PI 3-kinase activity in liver, insulin-stimulated tyrosine phosphorylation of the insulin receptor in the liver of liver-LPL and liver-LPL/het KO mice was unaltered as compared with the control mice (Fig. 7b). This finding parallels the results in the muscle-LPL mice and suggests that the defect in liver insulin signaling in the liver-LPL mice may also be because of an alteration in insulin signaling at the level of the insulin receptor substrates.
Figure 7.
Insulin signaling in the skeletal muscle and liver of control (open bars) vs. liver-LPL (filled bars) (Left) and het KO (open bars) vs. liver-LPL/het KO (filled bars) (Right) mice. (a) IRS-2-associated PI 3-kinase activity in liver. (b) Tyrosine phosphorylation of insulin receptor in liver. (c) IRS-1-associated PI 3-kinase activity in skeletal muscle. Values are means ± SE for 3≈7 experiments. *, P < 0.05 vs. control group.
In addition, it is possible that accumulation of fatty acyl CoA, a known activator of pyruvate carboxylase (25), leads to a relative increase in hepatic gluconeogenesis without an increase in overall rates of EGP. Because glycogenolysis is more sensitive to insulin's action than gluconeogenesis (26), this would further contribute to hepatic unresponsiveness during the hyperinsulinemic–euglycemic clamp. Despite severe hepatic insulin resistance in liver-LPL mice, basal EGP rates were not altered in these mice. This finding is consistent with similar observations in many other insulin resistant states, such as obesity (27), that manifest decreased hepatic responsiveness to insulin suppression of EGP despite normal basal rates of EGP.
Despite defects in liver insulin action, insulin-stimulated whole-body and muscle glucose uptake, glycolysis, and glycogen synthesis were unaltered in both liver-LPL and liver-LPL/het KO mice (Figs. 5 c and d and 6 c and d). Consistent with this finding, we also found that insulin's ability to activate IRS-1-associated PI 3 kinase in muscle was unaltered in these mice (Fig. 7c). These findings demonstrate that liver-specific overexpression of LPL caused liver-specific insulin resistance while maintaining normal insulin action and signaling in skeletal muscle.
Role of Fatty Acid-Derived Metabolites in Insulin Resistance.
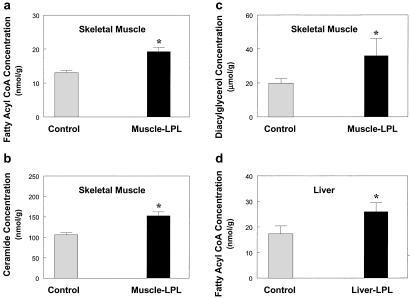
The mechanism by which tissue-specific increase in LPL causes tissue-specific insulin resistance may involve accumulation of intracellular fatty acid-derived metabolites (i.e., fatty acyl CoA, ceramide, diacylglycerol). Intracellular long-chain fatty acyl CoA, ceramide, and diacylglycerol concentrations in skeletal muscle were increased in the muscle-LPL mice (Fig. 8 a–c). Moreover, intracellular long-chain fatty acyl CoA in liver was increased in the liver-LPL mice (Fig. 8d). Increases in long-chain fatty acyl CoA concentration in muscle of muscle-LPL mice and in liver of liver-LPL mice reflect increased delivery of systemic fatty acids to these tissues, because fatty acyl CoA utilization in these tissues would not be expected to be lower in these mice. The mechanism by which accumulation of intracellular fatty acid-derived metabolites may cause insulin resistance in skeletal muscle remains unknown but may involve activation of protein kinase C-theta (PKC-θ), a serine kinase. Chalkley et al. (28) have reported that a 5-h lipid infusion increased muscle triglyceride and long-chain fatty acyl CoA contents, and this increase in fatty acyl CoA might lead to an increase in diacylglycerol, a known potent activator of PKC-θ (29). Moreover, recent studies by our group have shown that an acute elevation of plasma fatty acids for 5 h resulted in activation of PKC-θ, which was associated with decreased tyrosine phosphorylation of IRS-1 (30). In the present study, muscle-LPL mice with a muscle-specific increase in triglyceride content had significantly increased intracellular fatty acyl CoA and diacylglycerol concentrations in skeletal muscle, and this increased diacylglycerol concentration may activate PKC-θ in these mice. The activation of PKC-θ might induce a serine phosphorylation of IRS-1 in muscle and IRS-2 in liver, which in turn might interfere with IRS-1 and IRS-2 tyrosine phosphorylation by the insulin receptor, leading to decreased activation of PI 3-kinase in these tissues (29). Thus, accumulation of intracellular diacylglycerol, a known activator of PKC-θ (29), because of overexpression of LPL may be responsible for defects in insulin's ability to activate IRS-1- and IRS-2-associated PI 3-kinase activity in muscle and liver, respectively, and subsequent insulin action in these tissues.
Figure 8.
Intracellular fatty acid-derived metabolites in the skeletal muscle and liver. (a) Intracellular fatty acyl CoA concentration in skeletal muscle in the control (open bars) and muscle-LPL (filled bars) groups. (b) Intracellular ceramide concentration in skeletal muscle in the control (open bars) and muscle-LPL (filled bars) groups. (c) Intracellular diacylglycerol concentration in skeletal muscle in the control (open bars) and muscle-LPL (filled bars) groups. (d) Intracellular fatty acyl CoA concentration in liver in the control (open bars) and liver-LPL (filled bars) groups. Values are means ± SE for 5≈10 experiments. *, P < 0.05 vs. control group.
It is also possible that increased concentrations of other intracellular fatty acid derived metabolites (i.e., ceramide) may play a role in the development of insulin resistance in these mice. Summers et al. have shown that ceramide suppressed insulin-stimulated glucose transport in 3T3-L1 adipocytes by inhibiting phosphorylation and activation of Akt/protein kinase B, a serine/threonine protein kinase activated by insulin in a PI 3 kinase-dependent manner (31) and involved in the translocation of glucose transporter 4 (GLUT4) to the cell membrane (32). In this regard, increased concentrations of ceramide in skeletal muscle of muscle-LPL mice may be because of de novo synthesis of ceramide via activation of serine palmitoyltransferase (33).
In conclusion, we have shown that muscle-specific overexpression of LPL causes muscle-specific insulin resistance by causing defects in muscle insulin signaling and action. Similarly, liver-specific overexpression of LPL causes liver-specific insulin resistance by causing defects in liver insulin signaling and action. These defects in insulin signaling and action are associated with increased intracellular fatty acid-derived metabolites in muscle and liver. Our findings clearly demonstrate that increased fatty acid delivery to muscle and liver impair insulin's ability to metabolize glucose in these tissues, and that these defects are likely to be secondary to blunted insulin signaling caused by increased intracellular fatty acid-derived metabolites. Furthermore, the tissue-specific nature of these defects demonstrates that locally derived fatty acid metabolites are capable of inducing profound insulin resistance in liver and muscle, independent of any circulating adipocyte-derived hormone, and thus suggests a very different target for reversing this condition.
Acknowledgments
J.K.K. is a research associate and G.I.S. is an investigator of the Howard Hughes Medical Institute. We are grateful to Aida Groszmann, Kimberly A. Murphy, and Christine Castro for technical assistance. This study was supported by grants from the United States Public Health Service and was presented at the 2000 American Diabetes Association Annual Meeting in San Antonio, TX (34).
Abbreviations
- IRS
insulin receptor substrate
- LPL
lipoprotein lipase
- EGP
endogenous glucose production
- PI
phosphatidylinositol
- PKC-θ
protein kinase C-theta
References
- 1.Shaw J E, Zimmet P Z, McCarty D, Courten M D. Diabetes Care. 2000;23, Suppl. 2:B5–B10. [PubMed] [Google Scholar]
- 2.McGarry J D. Science. 1992;258:766–770. doi: 10.1126/science.1439783. [DOI] [PubMed] [Google Scholar]
- 3.Hotamisligil G S, Shargill N S, Spiegelman B M. Science. 1993;259:87–91. doi: 10.1126/science.7678183. [DOI] [PubMed] [Google Scholar]
- 4.Hotamisligil G S. J Int Med. 1999;245:621–625. doi: 10.1046/j.1365-2796.1999.00490.x. [DOI] [PubMed] [Google Scholar]
- 5.Kahn C R, Chen L, Cohen S E. J Clin Invest. 2000;106:1305–1307. doi: 10.1172/JCI11705. [DOI] [PMC free article] [PubMed] [Google Scholar]
- 6.Shimomura I, Hammer R E, Ikemoto S, Brown M S, Goldstein J L. Nature (London) 1999;401:73–76. doi: 10.1038/43448. [DOI] [PubMed] [Google Scholar]
- 7.Johnson P R, Spiegelman B, Rosen B, Turkenkopf I, Ree H, Greenwood M R. Am J Physiol. 1990;259:R184–R188. doi: 10.1152/ajpregu.1990.259.1.R184. [DOI] [PubMed] [Google Scholar]
- 8.Mohamed-Ali V, Pinkney J H, Coppack S W. Int J Obes Relat Metab Disord. 1998;22:1145–1158. doi: 10.1038/sj.ijo.0800770. [DOI] [PubMed] [Google Scholar]
- 9.Spiegelman B M, Flier J S. Cell. 1996;87:377–389. doi: 10.1016/s0092-8674(00)81359-8. [DOI] [PubMed] [Google Scholar]
- 10.Steppan C M, Bailey S T, Bhat S, Brown E J, Banerjee R R, Wright C M, Patel H R, Ahima R S, Lazar M A. Nature (London) 2001;409:307–312. doi: 10.1038/35053000. [DOI] [PubMed] [Google Scholar]
- 11.Abel E D, Peroni O, Kim J K, Kim Y-B, Boss O, Hadro E, Minnemann T, Shulman G I, Kahn B B. Nature (London) 2001;409:729–733. doi: 10.1038/35055575. [DOI] [PubMed] [Google Scholar]
- 12.Baron A D, Brechtel G, Wallace P, Edelman S V. Am J Physiol. 1988;255:E769–E774. doi: 10.1152/ajpendo.1988.255.6.E769. [DOI] [PubMed] [Google Scholar]
- 13.Goldberg I J. J Lipid Res. 1996;37:693–707. [PubMed] [Google Scholar]
- 14.Kim J K, Gavrilova O, Chen Y, Reitman M L, Shulman G I. J Biol Chem. 2000;275:8456–8460. doi: 10.1074/jbc.275.12.8456. [DOI] [PubMed] [Google Scholar]
- 15.Levak-Frank S, Radner H, Walsh A, Stollberger R, Knipping G, Hoefler G, Sattler W, Weinstock P H, Breslow J L, Zechner R. J Clin Invest. 1995;96:976–986. doi: 10.1172/JCI118145. [DOI] [PMC free article] [PubMed] [Google Scholar]
- 16.Merkel M, Weinstock P H, Chajek-Shaul T, Radner H, Yin, Baoyun, Breslow J L, Goldberg I J. J Clin Invest. 1998;102:893–901. doi: 10.1172/JCI2912. [DOI] [PMC free article] [PubMed] [Google Scholar]
- 17.Bligh E G, Dyer W J. Can J Biochem Physiol. 1959;37:911–917. doi: 10.1139/o59-099. [DOI] [PubMed] [Google Scholar]
- 18.Cline G W, Petersen K F, Krssak M, Shen J, Hundal R S, Trajanoski Z, Inzucchi S, Dresner A, Rothman D L, Shulman G I. N Engl J Med. 1999;341:240–246. doi: 10.1056/NEJM199907223410404. [DOI] [PubMed] [Google Scholar]
- 19.Yamauchi T, Tobe K, Tamemoto H, Ueki K, Kaburagi Y, Yamamoto-Honda R, Takahashi Y, Yoshizawa F, Aizawa S, Akanuma Y, et al. Mol Cell Biol. 1996;16:3074–3084. doi: 10.1128/mcb.16.6.3074. [DOI] [PMC free article] [PubMed] [Google Scholar]
- 20.Kahn C R. Diabetes. 1994;43:1066–1084. doi: 10.2337/diab.43.8.1066. [DOI] [PubMed] [Google Scholar]
- 21.Watarai T, Kobayashi M, Takata Y, Sasaoka T, Iwasaki M, Shigeta Y. Diabetes. 1995;37:1397–1404. doi: 10.2337/diab.37.10.1397. [DOI] [PubMed] [Google Scholar]
- 22.Previs S F, Withers D J, Ren J-M, White M F, Shulman G I. J Biol Chem. 2000;275:38990–38994. doi: 10.1074/jbc.M006490200. [DOI] [PubMed] [Google Scholar]
- 23.Petersen K F, Laurent D, Rothman D L, Cline G W, Shulman G I. J Clin Invest. 1998;101:1203–1209. doi: 10.1172/JCI579. [DOI] [PMC free article] [PubMed] [Google Scholar]
- 24.Cross D A, Alessi D R, Cohen P, Andjelkovich M, Hemmings B A. Nature (London) 1995;378:785–789. doi: 10.1038/378785a0. [DOI] [PubMed] [Google Scholar]
- 25.Myers D E, Tolbert B, Utter M F. Biochemistry. 1983;22:5090–5096. doi: 10.1021/bi00291a007. [DOI] [PubMed] [Google Scholar]
- 26.Chiasson J L, Liljenquist J E, Finger F E, Lacy W W. Diabetes. 1976;25:283–291. doi: 10.2337/diab.25.4.283. [DOI] [PubMed] [Google Scholar]
- 27.Kolterman O G, Gray R S, Griffin J, Burstein P, Insel J. J Clin Invest. 1981;68:957–969. doi: 10.1172/JCI110350. [DOI] [PMC free article] [PubMed] [Google Scholar]
- 28.Chalkley S M, Hettiarachchi M, Chisholm D J, Kraegen E W. Metabolism. 1998;47:1121–1126. doi: 10.1016/s0026-0495(98)90287-6. [DOI] [PubMed] [Google Scholar]
- 29.Schmitz-Peiffer C, Browne C L, Oakes N D, Watkinson A, Chisholm D J, Kraegen E W, Biden T J. Diabetes. 1997;46:169–178. doi: 10.2337/diab.46.2.169. [DOI] [PubMed] [Google Scholar]
- 30.Griffin M E, Marcucci M J, Cline G W, Bell K, Barucci N, Lee D, Goodyear L J, Kraegen E W, White M F, Shulman G I. Diabetes. 1999;48:1270–1274. doi: 10.2337/diabetes.48.6.1270. [DOI] [PubMed] [Google Scholar]
- 31.Summer S A, Garza L A, Zhou H, Birnbaum M J. Mol Cell Biol. 1998;18:5457–5464. doi: 10.1128/mcb.18.9.5457. [DOI] [PMC free article] [PubMed] [Google Scholar]
- 32.Calera M R, Martinez C, Liu H, Jack A K, Birnbaum M J, Pilch P F. J Biol Chem. 1998;273:7201–7204. doi: 10.1074/jbc.273.13.7201. [DOI] [PubMed] [Google Scholar]
- 33.Shimabukuro M, Higa M, Zhou Y T, Wang M Y, Newgard C B, Unger R H. J Biol Chem. 1998;273:32487–32490. doi: 10.1074/jbc.273.49.32487. [DOI] [PubMed] [Google Scholar]
- 34.Kim J K, Velez-Carrasco W, Kako Y, Fillmore J, Chen Y, Perret P, Goldberg I, Breslow J, Shulman G I. Diabetes. 2000;49, Suppl. 1:A13. [Google Scholar]


