Abstract
In this paper, we present a microfluidic chip that is capable of measuring electrical conductance through gap junction channels in a 2-dimensional cell sheet. The chip utilizes a tri-stream laminar flow to create a non-conductive sucrose gap between the two conducting solutions so that electrical current can pass across the sucrose gap only through the cells. Using the chip, we tested the effect of a gap junction inhibitor, 2-APB, on the electrical coupling of connexin 43 (Cx43) gap junction channels in NRK-49F cells. We found that 2-APB reversibly blocks the conductivity in a dose-dependent manner. The tri-stream chip further allows us to simultaneously follow the conductance changes and dye diffusion in real time. We show that 2-APB affects both conductance and diffusion, supporting the interpretation that both sets of data reflect the same gap junction activity. The chip provides a generic platform to investigate gap junction properties and to screen drugs that may inhibit or potentiate gap junction transmission.
INTRODUCTION
Cytosolic diffusional coupling between adjacent cells in tissues is mediated by gap junction channels. A gap junction channel is formed when connexin proteins assembled in the form of a hexameric hemichannel in one cell and join with a hemichannel of an adjacent cell. Clustered in plaques, the gap junction channels allow direct transport of ions, metabolites, and other small molecules between neighboring cells.1, 2 Since different connexins can interact to form homotypic (from same connexins) or heterotypic (from different connexins) channels, there is a variety of channel types that exhibit diverse biophysical properties in their voltage dependent gating, drug interactions and permeability.3, 4, 5 Dysfunction of gap junctions disrupts normal cell homeostasis, differentiation and growth, and modification of gap junction communication has been suggested as an avenue towards treatments of a variety of pathologies.6, 7
Assays for gap junction activity can be divided into two general categories: electrical conductivity and molecular diffusion. Electrical methods measure the current through these channels in response to a trans-junctional voltage gradient and are the most sensitive assays of channel activity, capable of single channel resolution. The method requires gaining electrical access to two or more connected cells and measuring the conductance between them.8, 9, 10, 11, 12, 13, 14 Although highly sensitive, these methods can be difficult and tedious because they require the successful formation of high resistance electrical seals on two adjoining cells. An alternative technique for measuring electrical coupling utilizes three isolated chambers with the tissue passing across them. The middle chamber contains a non-conductive isosmotic sucrose solution forming a non-conductive extracellular gap, called a “sucrose-gap,” whereas the two side chambers contain a conductive saline, typically high potassium solutions to lower the access resistance to the cell interiors.15, 16, 17 This technique measures the resistance between the two side chambers, eliminating the requirement for intracellular electrodes as well as providing a response that is averaged across many cells. However, the conventional sucrose-gap technique requires three physical compartments that can only be used to measure the resistance in tissues or axons.
The use of microfluidics allows the construction of repeatable and precisely defined regions (chambers) and is scalable for the purpose of developing high throughput screens.18, 19, 20, 21 With laminar flow in the chamber one can maintain sharp interfaces between different fluids perfused in parallel, creating “micro-chambers” defined by the fluid flow boundaries instead of material boundaries. Different solutions can be applied sequentially in each region, enabling the application of different reagents; and the electrodes used for measuring the gap resistance can be fabricated on the chip, making the chamber performance reproducible and versatile. Various impedance-based microfluidic devices have been developed to study membrane properties of cells.22, 23, 24 Such microfluidic chip provides an ideal platform to create a sucrose-gap and perform the electrical assays with high resolution, precision, and repeatability.
We have previously demonstrated that the multi-stream laminar flow can be used to selectively expose subsets of cells within the same population to different extracellular solutions. This approach allows observation of dye loading and diffusion between different regions.25, 26 Here, we show that the tri-stream chip can be used to measure electrical coupling across gap junctions. The chip is designed in a generic form so that it can be used to measure both electrical conductance and molecular diffusion in real time. To validate the functionality of this platform, we demonstrate that the reversible inhibition of Cx43 gap junction channels in NRK cells by the known gap junction inhibitor 2-APB can be studied by diffusion and electrical conduction simultaneously.
EXPERIMENTAL SECTION
Chip design and fabrication
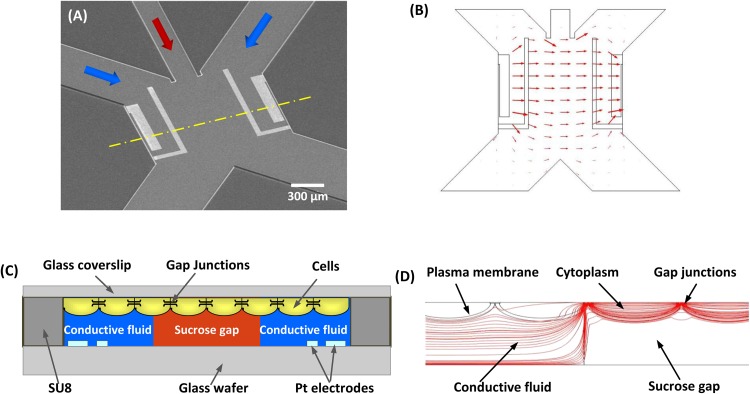
The chip consists of a main flow channel connected with three upstream inlets and two downstream outlets (Fig. 1a). The main fluid channel is 1300 μm wide and 1258 μm long. The middle inlet is 200 μm wide and is flanked by 500 μm wide side inlets that are angled at 45° relative to the middle inlet. The two outlets are 642 μm wide, angled 90° with respect to each other (Fig. 1a). A non-conductive stream from the middle inlet is used to separate two conductive solutions being perfused through the two side inlets. The two conductive streams remain separated at the downstream end by splitting the non-conducting center stream to the two outlet channels, thus eliminating any possibility of electrical shunting due to mixing at the downstream reservoirs. Two pairs of electrodes are patterned on the glass substrate within each conducting region, forming a four-electrode resistance measurement system. Numerical simulations of the flow chamber show that the electrical field lines are confined between the opposite set of electrodes, Fig. 1b. The sensing principle of the chip is illustrated in cross-section (Fig. 1c) that follows the dashed line across the main channel in Fig. 1a. The non-conductive sucrose gap forms an electrical barrier at the middle channel. Cells are grown on a glass slide that is inverted and clamped on top of the chip, Fig. 1c. When a voltage is applied across the non-conductive sucrose, current can only pass through the cells across the gap junction channels. This principle is validated by numerical simulations of the flow chamber containing a layer of confluent cells, showing that the electrical field lines are concentrated within the cell layer in the non-conductive region (Fig. 1d).
Figure 1.
(a) SEM of the sucrose-gap chip. Three inlet channels are connected to a sensing channel that is defined by two pair of electrodes on either side. Downstream two outlet channels split the solution into separate reservoirs. (b) Numerical simulation of current distribution, showing that the electrical field is confined in the sensing chamber (comsol/multiphysics). (c) A cross-section view of the sensing channel along the dashed line in (a), showing how a non-conductive sucrose gap is created by the middle stream so the electrical pathway is only through the confluent cells. (d) Cross-section view of current distribution in the flow chamber containing confluent cells. The conductivity of cytoplasm, cell membrane, and gap junction was 0.1, 0.2 × 10⁻⁶, and 1 × 10⁻⁴ S/m, respectively. The parameters are from Refs. 38, 39. It shows that the current lines are concentrated through the cell sheet in the gap region.
The chip was fabricated using SU8, an epoxy-based photoresist, on a Pyrex glass wafer. Platinum electrodes (170 nm thick) were deposited using e-beam deposition and lift-off technique. The (outer) current electrodes were 100 μm wide and the (inner) voltage sensing electrodes were 50 μm wide, and these were 670 μm apart (Fig. 1a). A 24 μm thick layer of SU-8was then fabricated to form the flow channels as described previously.27 The chip was mounted on a Plexiglas stage to mate with the external fluid connections and each inlet was connected to a two-way fluid switch to enable solution exchange. Cultured cells on a coverslip were placed on the top of the channel with cells facing the solution; the coverslip was clamped to the chip with a metal frame. The solutions were perfused by a constant gravity feed at a flow rate of 1.2 μl/min. This optimal value maintained a sharp interface and also minimized shear stress on the cells. These optimal chamber and flow parameters were explored using computational fluid dynamics method as described previously.25
Electrical measurement
For electrical measurements an active current source provided 1 μA, 50 Hz sinusoid to the two outer electrodes. The application of low current eliminated the possibility of electrochemical reaction on the surface of the electrodes.28 The voltage drop between the two inner electrodes was measured using a lock-in amplifier (Princeton Applied Research, Oak Ridge, TN) that provided rectification and filtering.
Fluorescence measurement
Fluorescence images were captured using a Zeiss upright microscope (AxioImager M1, Zeiss) equipped with a CCD camera (AxioCam MRm, Zeiss). We used two filter sets: Cy3 filter (Ex: 550 ± 25 nm, Em: 605 ± 70 nm) and a GFP filter (Ex: 470 ± 40 nm, Em: 525 ± 50 nm) for different dyes. The images were collected using two-channel time-lapse imaging controlled by Zeiss software (AxioVision, Zeiss). Two fluorescent dyes were used for loading and monitoring the flow profile. A membrane permeant dye, 5 -(6)-carboxyfluorescein diacetate (CFDA) (MW: 460.4) (Molecular Probes, Eugene, OR) was dissolved in dimethyl sulfoxide (DMSO) to a concentration of 5 mM and stored at −5 °C. The stock solution was further diluted to 5 μM in working solutions prior to the experiments. The membrane-impermeant fluorescent dye, 5 -(6)-carboxytetramethylrhodamine (rhodamine, Molecular Probes), was dissolved in DMSO to a 20 mM concentration and stored at −5 °C. Rhodamine stock was mixed with isotonic solution to 2.3 μM before experiments.
Chemicals and reagents
The non-conductive solution was prepared by adding sucrose (Sigma-Aldrich, St. Louis, MO) to deionized water to 300 mOsm. The conductivity was 4 μS/m as measured by a conductivity meter (Jenway, NJ). The conductive solutions contained 75 mM NaCl, 15 mM KCl, 2 mM MgCl2, 1 mM CaCl2, 10 mM HEPES, at pH 7.4. The osmolarity was adjusted to 300 mOsm with additional mannitol. A higher KCl concentration was used to enhance membrane conductance and facilitate electrical access to the interior of the cells in the conducting regions. The gap junction inhibitor 2 aminoethyl diphenylborinate (2-APB) was prepared to 0.4 M in DMSO as stock and then diluted in the sucrose solution to 50 μM, 100 μM, 200 μM, and 400 μM.
Cell culture
Normal Rat Kidney (NRK-49 F) cells, purchased from ATCC, were cultured in high glucose Dulbecco's Modified Eagle Medium containing 5% bovine calf serum, 1.5% sodium bicarbonate, and 1% penicillin and streptomycin. Cells were cultured to confluence on glass slides that had been cut to fit the microfluidic chip. Each slide was rinsed with an isotonic saline before being placed on the sensing chamber.
RESULTS
Sensor calibration
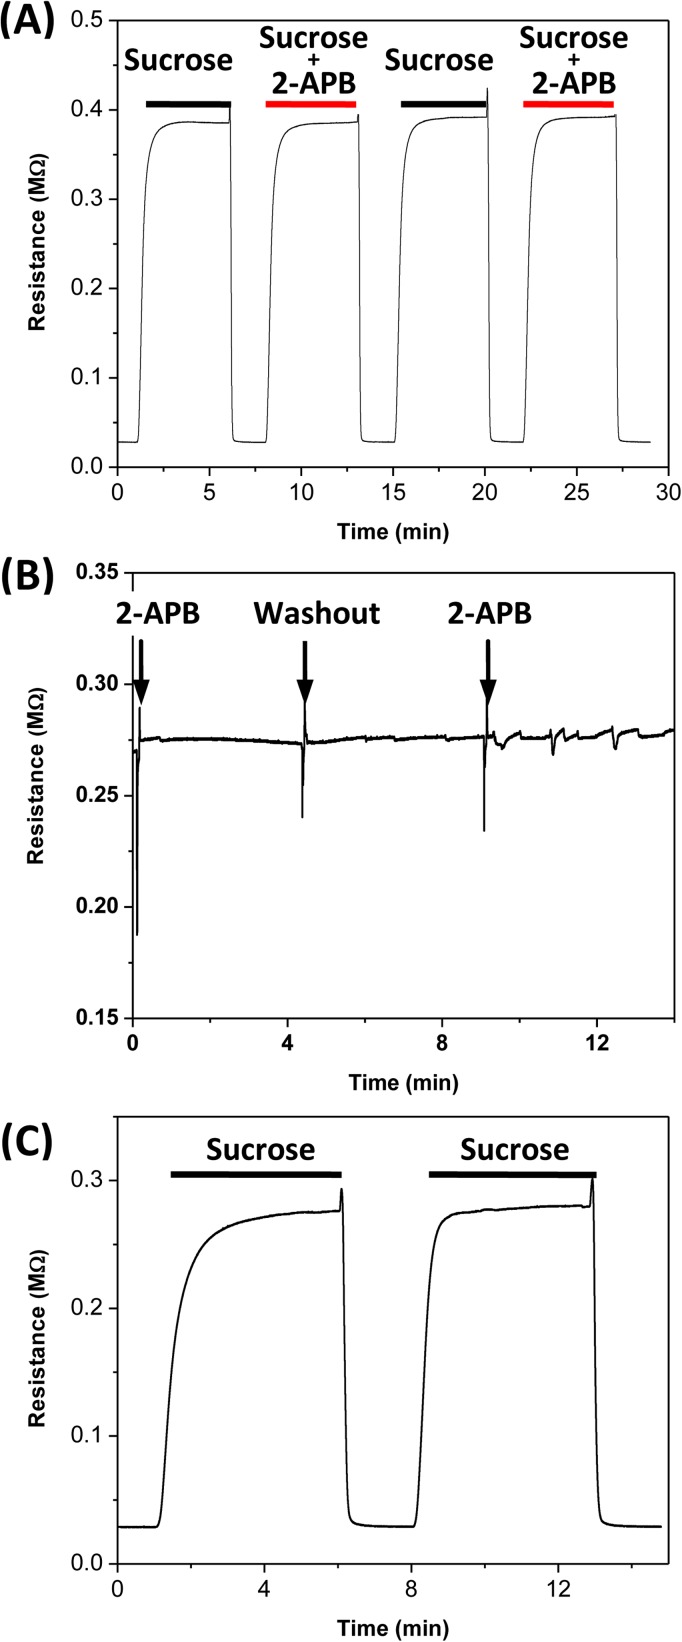
The sensitivity and reliability of the electrical measurements rely on creating a well-defined electrical barrier and stable fluid interface between conducting and non-conducting regions. We have previously characterized the flow stability and the boundary width of the central stream using fluorescence tracers and finite element simulations in a cell-free chamber.25 Figure 2a shows a control trace of the electrical resistance across the sensing chamber (without cells) when the sucrose solution, with and without the gap junction blocker (2-APB), was perfused intermittently in the middle stream of the chip. It shows that a stable sucrose gap can be created repeatedly. Moreover, addition of 200 μM 2-APB does not alter the gap resistance. To evaluate the efficacy of repeated application of different drugs, we followed the resistance as we exchanged the solution in the central stream from sucrose to sucrose-containing drugs. The central stream was first perfused with the sucrose solution to establish the baseline resistance across it. Then, it was switched to the solution containing 2-APB. Figure 2b shows that the solution exchange does not affect the gap resistance other than the spike at the instant of fluid exchange. The gap resistance remains constant for a given flow rate (gap width). The stability of different streams during solution exchanges was visualized by adding rhodamine dye (2.3 μM) to the side streams, and the streams were quite stable during solution exchange (see supplementary material Fig. S1).29 Complete isolation of two conducting streams (by splitting the non-conducting central stream downstream to separate outlets) is the key to stability of the electrical measurements and we monitored it at all times during the experiments using fluorescence imaging. To verify that the sucrose gap can be generated in the presence of cells, we followed the resistance as we perfused the sucrose solution in the central stream in the presence of confluent cell sheet in the chamber (Fig. 2c). The gap resistance can be achieved in the presence of cells but with a ∼25% reduction in peak resistance value.
Figure 2.
Calibration of microfluidic chip. (a) Changes in resistance across the gap in empty chamber when the central channel was repeatedly perfused with sucrose solution with and without 2-APB (200 μM), showing that a repeatable gap resistance can be attained with multiple perfusions and that the addition of drug does not alter the gap resistance. (b) A stable gap resistance is maintained during solution exchange in central stream. (c) Changes in resistance across the gap when the central channel was perfused with sucrose solution in the presence of confluent cells. The ground resistance in (a) and (c) is the chamber resistance without sucrose gap.
Conductance measurement across gap junctions
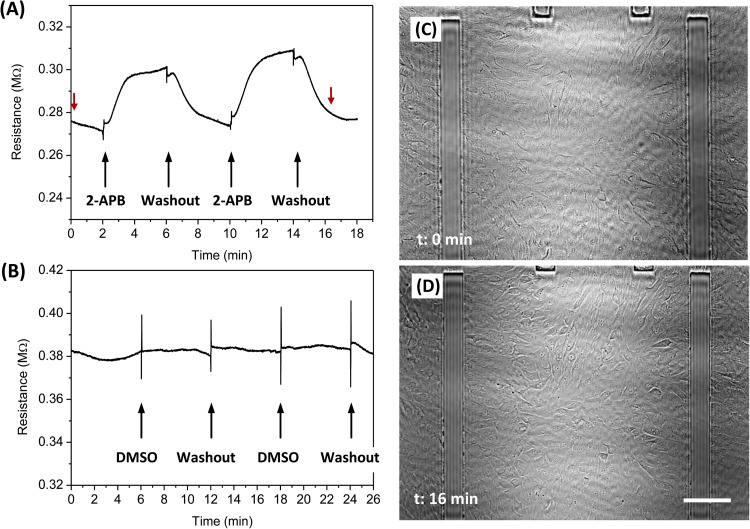
We followed the resistance change across NRK cell sheet in the presence of 2-APB (200 μM), a reagent known to block Cx43 channels.30 Tri-stream fluids were perfused at a constant flow rate of ∼1.2 μl/min (0.3 dyn/cm2), with the central stream containing sucrose solution, and the two side streams containing isotonic solution with rhodamine (2.3 μM). After a stable gap was established, the fluid in the central stream was switched to sucrose with 2-APB. Figure 3a shows the time course of the change in resistance when the central stream was switched repeatedly between 2-APB and washout solution, as indicated by arrows in Fig. 3a. The results show that 200 μM 2-APB reversibly inhibits gap junctions in NRK cells. Repeated application of the drug showed similar kinetics with a biphasic increase in resistance during application and washout of the drug. By fitting the curves with Boltzmann equation, the time constant of resistance increase and decrease was found to be 0.40 ± 0.03 min and 0.36 ± 0.035 min, respectively (over repeated experiments, n = 4). There was a latency of ∼50 s during solution exchange due to the dead volume in the supply tubing. Since NRK cells endogenously express Cx43, the effect of drug on these channels was compared and found to be similar to those reported previously.30 As a control for effect of DMSO, the drug vehicle, we added same amount of DMSO to the sucrose stream and it did not affect the resistance (Fig. 3b). The cell population was constant during the experiment as shown in phase contrast images in Figs. 3c, 3d, which were taken at the beginning and the end of the experiment, as indicated by red arrows in Fig. 3a. The stability of different streams during the course of the experiments was monitored with rhodamine dye in the side streams and ensured that the two side streams were well separated at the downstream outlets (see supplementary material Fig. S1).29
Figure 3.
Effect of 2-APB on electrical coupling of gap junction channels in NRK cells. (a) The central stream was switched between sucrose and sucrose with 2-APB (200 μM) repeatedly (indicated by arrows), showing that the drug reversibly blocks the channels. (b) A control experiment for the effect of DMSO used as the 2-APB vehicle, showing that the vehicle did not block the channels. The central stream was perfused alternately with sucrose + DMSO and sucrose. (c) and (d) Images of the cells before and after the experiment at the times indicated by the red arrows in (a), showing that the cells remain attached during the measurement. The scale bar represents 100 μm.
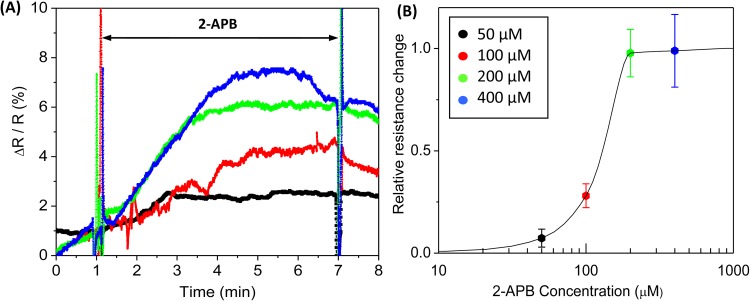
Following the same protocol, we also measured the dose response to 2-APB concentrations of 50, 100, 200, and 400 μM. As expected, 2-APB blocked conductance through gap junction channels in a dose dependent fashion (Fig. 4a) up to 200 μM. A slight change with dose was observed for concentration above 200 μM. The effect of 2-APB on resistance as a function of concentration is shown in Fig. 4b, where the maximum changes in resistance at each concentration are normalized with the peak resistance change at 400 μM, and the data are averaged over repeated experiments (n = 5 or more). The sucrose gap width was ∼290 μm for all runs. Note that the mean resistance change at 400 μM is only slightly higher than 200 μM in Fig. 4b, thus the apparent larger effect in Fig. 4a (blue trace) is due to variation between individual experiments.
Figure 4.
Dose dependent 2-APB inhibition. (a) Representative changes in resistance measured in the presence of 50 μM (black), 100 μM (red), 200 μM (green), and 400 μM (blue) 2-APB. The change in resistance (ΔR) was normalized to the baseline resistance (R) with a stable gap. (b) Concentration dependence of normalized maximum resistance change showing the saturation of 2-APB inhibition at 200 μM (50 μM (n = 5), 100 μM (n = 6), 200 μM (n = 8), and 400 μM (n = 9)). The error bars are the standard errors.
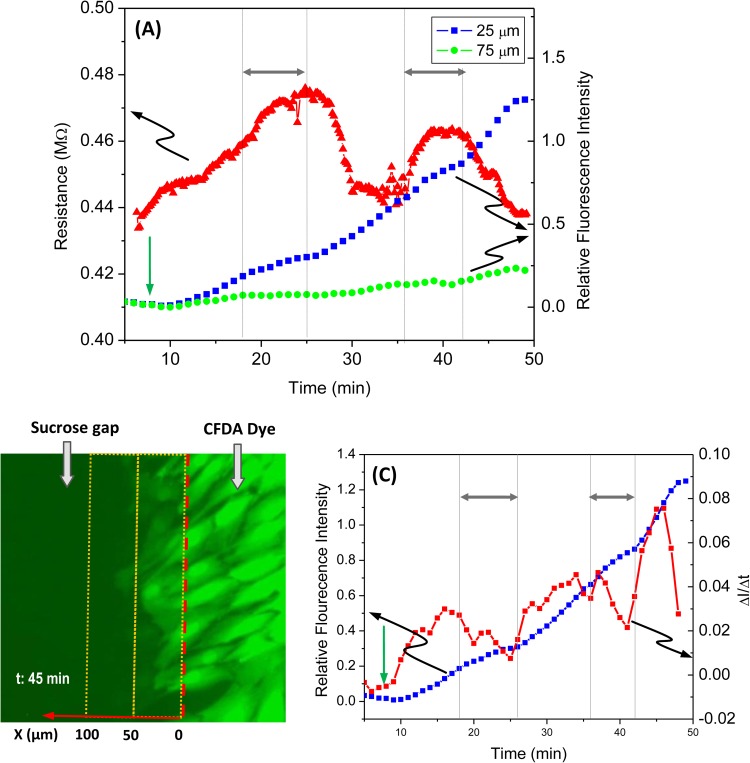
To demonstrate the unique capability of the chip to measure both the electrical coupling and dye coupling simultaneously, we concurrently followed both responses with repeated applications of 2-APB. After a stable sucrose gap was created in a tri-stream flow, membrane permeable CFDA (5 μM) was added to the right stream at the time indicated by the green arrow in Fig. 5a. The mean fluorescence intensity in central region was measured in the two windows centered at 25 and 75 μm from the boundary of the central stream as shown in Fig. 5b and is plotted in Fig. 5a (right axis). The diffusion of the dye into the cells through the sucrose interface can be clearly seen in Fig. 5b. The blue and green traces in Fig. 5a (right axis) show the time course of average fluorescence intensity measured in the two windows under the sucrose flow (Fig. 5b).25 2-APB (400 μM) was applied for the durations indicated by double headed arrows in Figs. 5a, 5c; the change in resistance was measured simultaneously and is plotted in Fig. 5a (left axis), showing similar result as in Fig. 3a. Concurrently, 2-APB also inhibits diffusion that is evidenced by the reduced increase in fluorescence intensity in the presence of blocker, and the recovery after the drug washout (Fig. 5a). While the data from the window centered at 75 μm (Fig. 5, green trace) show a total saturation under the drug, a slight increase in intensity is observed from the window adjacent to the boundary (Fig. 5, blue trace). Since NRK cells exhibit irregular shapes in the culture, the protrusion of few loading cells in the measuring window could have contributed to the slow elevation of intensity. The derivative of diffusion at 25 μm is shown in Fig. 5c (right axis), indicating a drastic decrease in diffusion in the presence of blocker. The results are consistent with our previous studies using one dimensional cell arrays.26 As expected, electrical coupling and molecular diffusion processes are correlated but, the electrical measurement is more sensitive and faster.
Figure 5.
Simultaneous measurement of the electrical coupling and dye diffusion in response to application of 400 μM 2-APB. (a) Time course of changes in resistance (red triangle, left axis) and the fluorescence intensity (blue square and green dots, right axis), showing that both conductance and dye diffusion was inhibited by 2-APB. The drug (400 μM 2-APB) was applied to the central stream during the periods indicated by double headed arrows in (a). For diffusion, CFDA (5 μM) was loaded to the right side solution at the time indicated by green arrow in (a). (b) Fluorescent image showing the boundary (red dashed line) between the dye loading stream (right side) and the central stream (left side). The fluorescence intensity was measured from two windows (yellow outlined in b) centered at 25 and 75 μm from the boundary in the gap region. (c) Derivative of the fluorescence intensity at 25 μm with respect to time (red square, right axis), showing that 2-APB diminished the changes in dye intensity. The change in fluorescence intensity at 25 μm (blue squares) is also plotted for comparison. The data show higher sensitivity of the electrical measurement compared to the diffusion measurement.
DISCUSSION
The sucrose gap technique has long been used in electrophysiology and has been utilized for measuring gap junction communication.15, 16, 17 We have applied the technique in a microfluidic chip making the technique fast and generally accessible for studying physiology and pharmacology of gap junction channels. The chip permits simultaneous observation of molecular and electrical transmission, thus permitting multiple assays in a single run. Different dyes can be added to the three fluid paths to make different diffusion measurements simultaneously with the electrical measurements.
Using this sensor, we report an averaged ∼30 kΩ change of overall resistance in the presence of blocker (Figs. 35). The measured resistance shows fair agreement with reported data in the literature. Single-channel conductance of Cx43 channel has been reported in the range of 100 to 220 pS with patch recording.3, 31, 32 Moreover, it has been reported that Cx43 cluster into plaques (300 to 2000 channels per plaque) at locations of cell-cell contact, and the coupling is enhanced for plaques exceeding several hundred channels.33 In our microfluidic chip, the cross-section of sensing region defined by the two electrodes is approximately 40 cells width. Based on an approximated ∼25 plaques per cell,34 the change of conductance is estimated to be in the range of 30 to 300 μS, or resistance of 3 to 30 kΩ.
The drug 2-APB was initially shown to be an inhibitor for IP3 receptors and TRP channels and recent studies show that it also inhibits gap junctions, including Cx43, Cx36, Cx50, Cx45, and Cx46.30, 35 While the mechanism of inhibition is yet unclear, the present hypothesis is that the drug interacts with gap junction channels at the extracellular side because intracellular 2-APB is ineffective.30 Our data show a roughly symmetrical time course for the application and washout of the blocker (Fig. 3a) suggesting a single rate limiting site, likely at the extracellular side.
Reported results in the literature on the effectiveness of 2-APB to inhibit electrical coupling of Cx43 vary. Harks et al.30 claimed that 50 μM 2-APB completely blocks electrical coupling via Cx43 channels with half-maximal inhibition (IC50) at ∼5.7 μM, but another group has reported that several hundred μM of 2-APB is required to completely block Cx43 channels, a 10-fold higher IC50.35 Our data show a clear dose dependent response up to 200 μM 2-APB. Different techniques used in different published studies may be partially responsible for the discrepancy. In the microfluidic device, averaging across many cells in the chip may provide a higher resolution data set.
We have concurrently measured the effect of 2-APB on electrical coupling and dye diffusion through Cx43 gap junction channels and found the results to be consistent with these measurements made separately (Fig. 5). It has been reported that intracellular dyes can modulate electrical coupling using a dual-patch clamp measurement.36, 37 We found that CFDA does not have a noticeable effect on the resistance measurement and the high resolution obtained by averaging across many cells in parallel provides a more reliable measurement. The chip can be extended to have many parallel measurement chambers for higher throughput drug screening and the stability of the recording shows that multiple drugs can also be screened sequentially. We now have a tool to explore drugs capable of affecting gap junction coupling in any type of cultured cell.
ACKNOWLEDGMENTS
This work was supported by National Science Foundation Grant No. CMMI-0825707 and National Institute of Health Grant No. NS062657. This work was performed in part at the Cornell NanoScale Facility, a member of the National Nanotechnology Infrastructure Network, which is supported by the National Science Foundation (Grant No. ECS-0335765).
References
- Evans W. H. and Martin P. E., Mol. Membr. Biol. 19, 121 (2002). 10.1080/09687680210139839 [DOI] [PubMed] [Google Scholar]
- Spray D. C. and Bennett M. V., Annu. Rev. Physiol. 47, 281 (1985). 10.1146/annurev.ph.47.030185.001433 [DOI] [PubMed] [Google Scholar]
- Harris A. L., Q. Rev. Biophys. 34, 325 (2001). [DOI] [PubMed] [Google Scholar]
- Qu Y. and Dahl G., Proc. Natl. Acad. Sci. U. S. A. 99, 697 (2002). 10.1073/pnas.022324499 [DOI] [PMC free article] [PubMed] [Google Scholar]
- Goldberg G. S., Valiunas V., and Brink P. R., Biochim. Biophys. Acta 1662, 96 (2004). 10.1016/j.bbamem.2003.11.022 [DOI] [PubMed] [Google Scholar]
- Azzam E. I., de Toledo S. M., and Little J. B., Proc. Natl. Acad. Sci. U. S. A. 98, 473 (2001). 10.1073/pnas.98.2.473 [DOI] [PMC free article] [PubMed] [Google Scholar]
- Salameh A. and Dhein S., Biochim. Biophys. Acta 1719, 36 (2005). 10.1016/j.bbamem.2005.09.007 [DOI] [PubMed] [Google Scholar]
- Harris A. L., Spray D. C., and Bennett M. V., J. Gen. Physiol. 77, 95 (1981). 10.1085/jgp.77.1.95 [DOI] [PMC free article] [PubMed] [Google Scholar]
- Dahl G., Miller T., Paul D., Voellmy R., and Werner R., Science 236, 1290 (1987). 10.1126/science.3035715 [DOI] [PubMed] [Google Scholar]
- Rook M. B., Jongsma H. J., and van Ginneken A. C., Am. J. Physiol. 255, H770 (1988). [DOI] [PubMed] [Google Scholar]
- Wilders R. and Jongsma H. J., Biophys. J. 63, 942 (1992). 10.1016/S0006-3495(92)81664-8 [DOI] [PMC free article] [PubMed] [Google Scholar]
- Suchyna T. M., Nitsche J. M., Chilton M., Harris A. L., Veenstra R. D., and Nicholson B. J., Biophys. J. 77, 2968 (1999). 10.1016/S0006-3495(99)77129-8 [DOI] [PMC free article] [PubMed] [Google Scholar]
- Kumari S. S., Varadaraj K., Valiunas V., Ramanan S. V., Christensen E. A., Beyer E. C., and Brink P. R., Biochem. Biophys. Res. Commun. 274, 216 (2000). 10.1006/bbrc.2000.3054 [DOI] [PubMed] [Google Scholar]
- Spray D. C., Harris A. L., and Bennett M. V., Science 204, 432 (1979). 10.1126/science.312530 [DOI] [PubMed] [Google Scholar]
- Daleau P. and Deleze J., Can. J. Physiol. Pharmacol. 76, 630 (1998). 10.1139/cjpp-76-6-630 [DOI] [PubMed] [Google Scholar]
- Cole W. C., Picone J. B., and Sperelakis N., Biophys. J. 53, 809 (1988). 10.1016/S0006-3495(88)83160-6 [DOI] [PMC free article] [PubMed] [Google Scholar]
- Pereira Ferreira R. and Salomao L. C., J. Exp. Mar. Bio. Ecol. 249, 1 (2000). 10.1016/S0022-0981(00)00165-9 [DOI] [PubMed] [Google Scholar]
- Dittrich P. S. and Manz A., Nat. Rev. Drug Discovery 5, 210 (2006). 10.1038/nrd1985 [DOI] [PubMed] [Google Scholar]
- Kim J., Hwang I., Britain D., Chung T. D., Sun Y., and Kim D. H., Lab Chip 11, 3941 (2011). 10.1039/c1lc20766k [DOI] [PubMed] [Google Scholar]
- Phillips K. S., Lai H. H., Johnson E., Sims C. E., and Allbritton N. L., Lab Chip 11, 1333 (2011). 10.1039/c0lc00370k [DOI] [PMC free article] [PubMed] [Google Scholar]
- Pamme N., Lab Chip 7, 1644 (2007). 10.1039/b712784g [DOI] [PubMed] [Google Scholar]
- Tan Q., Ferrier G. A., Chen B. K., Wang C., and Sun Y., Biomicrofluidics 6, 034112 (2012). 10.1063/1.4746249 [DOI] [PMC free article] [PubMed] [Google Scholar]
- Sabuncu A. C., Zhuang J., Kolb J. F., and Beskok A., Biomicrofluidics 6, 034103 (2012). 10.1063/1.4737121 [DOI] [PMC free article] [PubMed] [Google Scholar]
- Abdalla S., Al-ameer S. S., and Al-Magaishi S. H., Biomicrofluidics 4, 034101 (2010). 10.1063/1.3458908 [DOI] [PMC free article] [PubMed] [Google Scholar]
- Bathany C., Beahm D., Felske J. D., Sachs F., and Hua S. Z., Anal. Chem. 83, 933 (2011). 10.1021/ac102658h [DOI] [PMC free article] [PubMed] [Google Scholar]
- Ye N., Bathany C., and Hua S. Z., Lab Chip 11, 1096 (2011). 10.1039/c0lc00350f [DOI] [PubMed] [Google Scholar]
- Pennell T., Suchyna T., Wang J., Heo J., Felske J. D., Sachs F., and Hua S. Z., Anal. Chem. 80, 2447 (2008). 10.1021/ac702169t [DOI] [PubMed] [Google Scholar]
- Gencoglu A. and Minerick A., Lab Chip 9, 1866 (2009). 10.1039/b820126a [DOI] [PubMed] [Google Scholar]
- See supplementary material at http://dx.doi.org/10.1063/1.4754599 for the flow profile at various times during the experiment.
- Harks E. G., Camina J. P., Peters P. H., Ypey D. L., Scheenen W. J., van Zoelen E. J., and Theuvenet A. P., FASEB J. 17, 941 (2003). [DOI] [PubMed] [Google Scholar]
- Traub O., Eckert R., Lichtenberg-Frate H., Elfgang C., Bastide B., Scheidtmann K. H., Hulser D. F., and Willecke K., Eur. J. Cell Biol. 64, 101 (1994). [PubMed] [Google Scholar]
- Carnarius C., Kreir M., Krick M., Methfessel C., Moehrle V., Valerius O., Bruggemann A., Steinem C., and Fertig N., J. Biol. Chem. 287, 2877 (2012). 10.1074/jbc.M111.319871 [DOI] [PMC free article] [PubMed] [Google Scholar]
- Bukauskas F. F., Jordan K., Bukauskiene A., Bennett M. V., Lampe P. D., Laird D. W., and Verselis V. K., Proc. Natl. Acad. Sci. U. S. A. 97, 2556 (2000). 10.1073/pnas.050588497 [DOI] [PMC free article] [PubMed] [Google Scholar]
- Li A. F., Sato T., Haimovici R., Okamoto T., and Roy S., Invest. Ophthalmol. Visual Sci. 44, 5376 (2003). 10.1167/iovs.03-0360 [DOI] [PubMed] [Google Scholar]
- Bai D., del Corsso C., Srinivas M., and Spray D. C., J. Pharmacol. Exp. Ther. 319, 1452 (2006). 10.1124/jpet.106.112045 [DOI] [PubMed] [Google Scholar]
- Cao F., Eckert R., Elfgang C., Nitsche J. M., Snyder S. A., DF H. u., Willecke K., and Nicholson B. J., J. Cell Sci. 111(Pt 1 ), 31 (1998). [DOI] [PubMed] [Google Scholar]
- Steinberg T. H., Civitelli R., Geist S. T., Robertson A. J., Hick E., Veenstra R. D., Wang H. Z., Warlow P. M., Westphale E. M., Laing J. G. et al. , EMBO J. 13, 744 (1994). [DOI] [PMC free article] [PubMed] [Google Scholar]
- Fear E. C. and Stuchly M. A., IEEE Trans. Biomed. Eng. 45, 856 (1998). 10.1109/10.686793 [DOI] [PubMed] [Google Scholar]
- Hu Q., Joshi R. P., and Beskok A., J. Appl. Phys. 106, 024701 (2009). 10.1063/1.3173344 [DOI] [Google Scholar]


