

Abstract
Purpose: To develop a method that allows a commercial treatment planning system (TPS) to perform accurate dose reconstruction for rigidly moving targets and to validate the method in phantom measurements for a range of treatments including intensity modulated radiation therapy (IMRT), volumetric arc therapy (VMAT), and dynamic multileaf collimator (DMLC) tracking.
Methods: An in-house computer program was developed to manipulate Dicom treatment plans exported from a TPS (Eclipse, Varian Medical Systems) such that target motion during treatment delivery was incorporated into the plans. For each treatment, a motion including plan was generated by dividing the intratreatment target motion into 1 mm position bins and construct sub-beams that represented the parts of the treatment that were delivered, while the target was located within each position bin. For each sub-beam, the target shift was modeled by a corresponding isocenter shift. The motion incorporating Dicom plans were reimported into the TPS, where dose calculation resulted in motion including target dose distributions. For experimental validation of the dose reconstruction a thorax phantom with a moveable lung equivalent rod with a tumor insert of solid water was first CT scanned. The tumor insert was delineated as a gross tumor volume (GTV), and a planning target volume (PTV) was formed by adding margins. A conformal plan, two IMRT plans (step-and-shoot and sliding windows), and a VMAT plan were generated giving minimum target doses of 95% (GTV) and 67% (PTV) of the prescription dose (3 Gy). Two conformal fields with MLC leaves perpendicular and parallel to the tumor motion, respectively, were generated for DMLC tracking. All treatment plans were delivered to the thorax phantom without tumor motion and with a sinusoidal tumor motion. The two conformal fields were delivered with and without portal image guided DMLC tracking based on an embedded gold marker. The target dose distribution was measured with a radiochromic film in the moving rod and compared with the reconstructed doses using gamma tests.
Results: Considerable interplay effects between machine motion and target motion were observed for the treatments without tracking. For nontracking experiments, the mean 2 mm/2% gamma pass rate over all investigated scenarios was 99.6% between calculated and measured doses. For tracking experiments, the mean gamma pass rate was 99.4%.
Conclusions: A method for accurate dose reconstruction for moving targets with dynamic treatments was developed and experimentally validated in a variety of delivery scenarios. The method is suitable for integration into TPSs, e.g., for reconstruction of the dose delivered to moving tumors or calculation of target doses delivered with DMLC tracking.
Keywords: organ motion, dose reconstruction, interplay effects, dynamic MLC tracking
INTRODUCTION
Organ motion during treatment delivery may lead to target dose distributions that differ markedly from the planned dose to a static target. In general, random and systematic tumor motion will lead to blurring and shifts of the planned target dose distribution, respectively. For dynamic treatments, where the beam shape and possibly the gantry angle change during beam delivery, these effects will be overlaid with interplay effects, i.e., target dose redistributions caused by the mutual motion of target and treatment machine.1, 2 The dosimetric effects of intrafraction motion is further complicated in tumor tracking treatments where not only the target motion, but also the treatment machine motion, is unknown in beforehand as it depends on the actual target motion (and treatment machine response) during beam delivery. On the other hand, dose reconstruction seems very suitable for tumor tracking treatments since the required knowledge of intratreatment tumor motion is available, by definition, as it is a requirement for the tracking.
Several methods have been proposed to estimate the impact of rigid tumor motion with commercial treatment planning systems (TPS). Utilizing the TPS allows use of institutionally validated dose calculation algorithms and evaluation of the reconstructed dose in the same environment and with the same tools (such as dose volume histograms, DVH) as used in the clinical treatment planning workflow. One calculation approach is to convolve the probability density function (PDF) of the target position with either the static 3D dose distribution3, 4, 5, 6, 7 or the incident 2D photon fluence of each treatment beam.8, 9, 10 An advantage of fluence convolution over dose convolution is that it can model the 3D dose distribution modifications that occur with treatment beam shifts because of tissue inhomogeneities and surface curvature.4 Dose convolution11 and fluence convolution10, 12 can both account for interplay effects in step-and-shoot intensity modulated radiation therapy (IMRT) treatments by using segment specific PDFs that describe the target motion during the delivery of each individual IMRT segment. However, the convolution methods cannot account for interplay effects in dynamic treatments, such as sliding windows IMRT, volumetric arc therapy (VMAT), or dynamic multileaf collimator (DMLC) tracking, where MLC motion takes place during beam-on periods.
An alternative method is to model target motion by isocenter shifts.13, 14 Using this approach, Berbeco et al. created a sub-beam for each target position observed by continuous portal imaging during conformal stereotactic body radiotherapy treatments and applied the observed shifts to the sub-beam isocenters.14 However, the procedure had processing times of several hours per fraction9 and the method was not applicable to dynamic treatments since the MLC aperture of the sub-beams was identical to the aperture of the original planned conformal beam.
In this paper, we present a simple and automatic method that allows a commercial TPS to perform accurate dose reconstruction for rigid moving targets with any treatment type on a linear accelerator. The target motion is modeled by constructing a multitude of dynamic sub-beams with individual isocenter shifts. The dose reconstruction is validated with film dosimetry in a thorax motion phantom for conformal treatments, IMRT, VMAT, and DMLC tracking treatments.
METHODS AND MATERIALS
Section 2A describes the proposed dose reconstruction method in general. Section 2B describes phantom experiments for film dosimetric validation of the reconstruction method for a range of treatment plans.
Dose reconstruction method
Figure 1 summarizes the dose reconstruction method. The basic scheme was to generate a Dicom treatment plan that mimicked the intratreatment target motion, import this plan into a clinical TPS (Eclipse 10.0.28, Varian Medical Systems, Palo Alto, CA), and use the TPS to calculate the dose delivered to the moving target. The motion mimicking treatment plan was generated by an in-house made computer program (developed in MATLAB R2011a, Mathworks, Natick, MA) based on the intratreatment target motion synchronized with the treatment delivery. The computer program divided the target motion into 1 mm position bins and constructed sub-beams that represented the parts of the treatment that were delivered while the target was located within each position bin. For each sub-beam, the target shift was modeled by a corresponding isocenter shift. As shown in Fig. 2, this corresponds to a shift of the entire patient volume rather than a shift of only the target. All sub-beams were incorporated into a single motion mimicking Dicom plan that was imported into the TPS for dose calculation.
Figure 1.
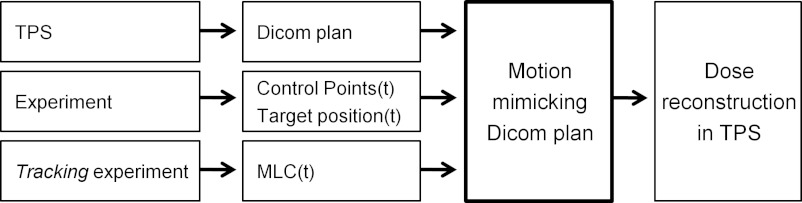
Overview of dose reconstruction method. The central step is generation of a motion mimicking Dicom plan, which was imported into the treatment planning system (TPS) for dose reconstruction. For tracking experiments, the actual MLC positions from the experiment were used instead of the originally planned MLC positions.
Figure 2.

Sub-beam isocenter shifts. A target shift, indicated by the arrow in (a), was modeled by shifting the sub-beam isocenter in the opposite direction. This is equivalent to performing a rigid shift of the entire patient volume relative to the sub-beam (b).
The sub-beam construction is shown in more detail in Fig. 3. In general, a treatment plan specifies a number of static and time dependent treatment machine parameters for each beam. The static parameters include collimator angle, jaw positions, and gantry angle (for static gantry beams). In the sub-beam construction, these static parameters were taken from the original Dicom treatment plan exported from the TPS (Fig. 1, upper left). The time dependent treatment machine parameters include the delivered fraction of monitor units (MU) (or the dose fraction), the MLC leaf positions for dynamic beams, and the gantry angle for arc beams. For each beam in a treatment plan, the values of these parameters are specified for a number of discrete control points and linear interpolation is used between the control points. The experiments in this study involved recordings of both the target position and the control points as function of treatment delivery time (Fig. 1, middle row). The details of these recordings are given in Sec. 2B4 below. As indicated by the gray areas in Fig. 3, the synchronized target motion and treatment delivery (control points as function of time) were used to determine the time dependent treatment machine parameters (i.e., the control points) for each target position bin. The control points of the sub-beams consisted of the originally planned control points that were reached within the position bin and new control points (created by interpolation) each time the target entered into or exited from the position bin (Fig. 3, bottom). Since the dose fraction of a beam must span a range from 0 to 1, the dose fraction values of each sub-beam were rescaled to fulfill this requirement [compare the dose fraction of the original beam (Fig. 3, middle) with that of the sub-beam (Fig. 3, bottom)]. When the target moved temporarily outside a given position bin, the same dose fraction was ascribed to the two sub-beam control points that marked the exit from the position bin and the re-entrance into the position bin (Fig. 3, bottom, dashed part of dose fraction curve). It means that no dose was delivered by the sub-beam, while the target was outside the position bin. Each sub-beam was ascribed a total number of MU equal to the MUs delivered to the target, while located within the position bin.
Figure 3.

Sub-beam construction. The time intervals spent by the target in position bin number n were determined from the experiment (upper). The treatment delivered in these time intervals was determined as an excerpt from the entire beam delivery (middle) and used to create a sub-beam that represented the treatment that was delivered, while the target was within position bin n (bottom). Note that the sub-beam does not deliver any dose between its control points 3 and 4, since the dose fraction does not increase between these control points.
For DMLC tracking, the MLC motion is unknown prior to treatment as it depends on the target motion. Therefore, the actual MLC positions as recorded in Dynalog files15, 16 were used instead of the plan MLC positions in the sub-beam construction as indicated for tracking experiments in Fig. 1 (bottom left). Since the Dynalog files record the MLC position, gantry angle, and beam-on status every 50 ms, the files were used to generate new control points for sub-beam construction for each 50 ms (rather than the much less frequent control points indicated in Fig. 3). Although control points based on Dynalog files were only used for the tracking experiments in this study, the Dynalog control points can be used generally for all treatment types to investigate the dosimetric effects of MLC motion that differs from the planned motion.
Figure 3 illustrates the control points for a VMAT beam where dose fraction, MLC positions, and gantry angle are all specified. Note that the number of control points will typically be much higher than in Fig. 3. An IMRT beam is similar except that the gantry is not specified for each control point. For a step-and-shoot IMRT plan, the dose fraction and MLC positions are staircase shaped as function of control point number, but shifted relative to each other such that the MLC positions remain static when the dose fraction increases, while the dose fraction remains constant when the MLC positions change between beam segments. While conformal beams can be described by a single control point, they were ascribed two control points with identical MLC positions and dose fractions of 0 and 1 in this study in order to use the same formalism for all treatment types.
The motion mimicking Dicom plan was generated automatically by the MATLAB program including all sub-beams and isocenter shifts. The Dicom plan was then imported into the TPS, where calculation of the plan dose by the TPS resulted in the motion including target dose distribution. This dose calculation accounted for the effects of dynamic MLC motion, rigid 3D target translations, and changes in the physical path length. As illustrated in Fig. 2, the dose calculation did not account for changes in the radiological path length caused by changes in the amount or density of tissue along the beam entrance path. Possible target deformations or rotations were also not accounted for.
Film dosimetric validation of the dose reconstruction method
This section describes film dosimetric validation of the dose reconstruction method of Sec. 2A for a range of treatment plans delivered to a thorax phantom.
Motion phantom
Experimental dosimetric validation of the dose reconstruction method was performed using a 008A Dynamic Thorax Phantom (Computerized Imaging Reference Systems, Inc. (CIRS), Norfolk, VA) with a moveable lung equivalent rod with an embedded homemade cylindrical solid water tumor insert (24 mm high, 25 mm diameter). A dosimetry film was mounted in the moveable rod sandwiched between the two halves of the tumor insert (Fig. 4).
Figure 4.
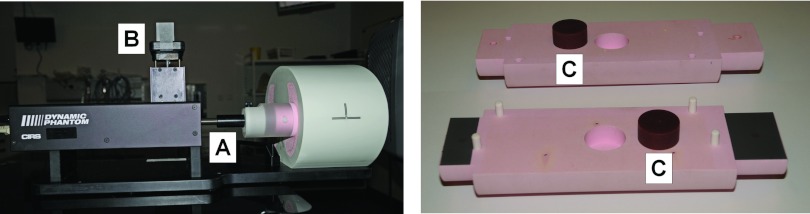
(Left) Dynamic thorax phantom with moving rod (A) and marker block for optical monitoring (B). (Right) The disassembled tumor insert (C) and moveable rod. A radiochromic film was sandwiched between the two halves of the rod during treatments.
Treatment planning
A CT scan with 0.75 mm slice thickness was acquired of the thorax phantom with the moving rod in its midposition and used for treatment planning. The tumor insert was delineated as a gross tumor volume (GTV), and a planning target volume (PTV) was constructed by adding margins of 5 mm in the axial directions and 10 mm in the cranio-caudal (CC) directions. The lungs and spinal cord of the phantom were delineated as organs at risk (OAR) along with fictitious esophagus and heart volumes. Margins of 5 mm were added to the spinal cord and esophagus delineations to form planning organs at risk volumes (PRV).
For motion experiments without tracking, a five-field conformal plan, a five-field dynamic (sliding windows) IMRT plan, a five-field step-and-shoot IMRT plan, and a two-arc VMAT plan were generated giving minimum target doses of 95% (GTV) and 67% (PTV) of the prescription dose17 (3 Gy). All four plans met the standard target and OAR dose constrains for stereotactic body radiotherapy (SBRT) treatments in our institution when scaled to the usual SBRT prescription dose of 3 × 22.5 Gy. The lower fraction dose of 3 Gy was used in the experiments to obtain doses suitable for film dosimetry. In addition, two left-lateral fields with collimator angles of 0° and 90° were generated to investigate DMLC tracking parallel and perpendicular to the MLC leaves, respectively. The nominal dose rate was 600 MU/minute and the energy was 6 MV for all fields.
Treatment delivery
All treatment plans were delivered to the thorax phantom by a Trilogy linear accelerator equipped with a 120 leaf Millennium MLC (Varian Medical Systems) without tumor motion and with a sinusoidal motion in the CC direction (20 mm peak-to-peak amplitude, 4 s period). The treatments with motion were started at random times relative to the phase of the phantom motion. For each treatment, the target dose distribution was measured with a 63 mm × 130 mm radiochromic EBT2 film mounted vertically in the moving rod. For a more thorough investigation of interplay effects, film measurements were also performed for single left-lateral beams taken from the two IMRT plans. The relatively low dose of these film exposures (approximately 0.6 Gy maximum dose) resulted in lower signal to noise ratios in the dose measurements. Therefore, these single-field exposures were also repeated with an increase by a factor of 5 of both the number of MUs and the phantom motion period in order to obtain improved signal to noise ratio with unaltered interplay effects. The two lateral conformal fields were delivered to the moving phantom both with and without DMLC tracking by an integrated prototype DMLC tracking system. The DMLC tracking was guided by continuous portal images that were acquired at 7.5 Hz and showed a gold marker, which was embedded in the tumor insert for these specific treatments.18 Each tracking treatment delivery took approximately 35 s. The latency of the tracking system (300 ms) was compensated by position prediction that started 8 s into the treatment when sufficient training data for the prediction algorithm had been acquired.18 All film dosimetry experiments were performed twice. Dynalog files were recorded during all treatments.
Synchronization of target motion and treatment delivery
The dose reconstruction method requires the target position and the control point evolution as function of treatment delivery time. For the lateral fields for DMLC tracking, the target position during treatment was obtained from the gold marker position in the portal images (both for tracking and nontracking experiments). This was not possible for the other treatments where no marker was used (and the intensity modulation would hinder marker visibility in portal images). Except for VMAT treatments, the target position during treatment was obtained by optical monitoring of a marker block (RPM, Varian Medical Systems) mounted on a platform of the thorax phantom that moved synchronously with the moveable rod (position B in Fig. 4). The motion recorded by the RPM system was linked to the onset of the treatment delivery via a gating enable indicator flag that was set in the RPM position log file with a known delay relative to the treatment onset. This gating system based synchronization of target motion and treatment was not possible for the VMAT treatments because gating is not commissioned for VMAT in our institution. Instead, the synchronization was based on x-ray images of a tungsten ball bearing mounted on the shaft that held the moveable rod (at position A in Fig. 4) as follows: Prior to and during treatment delivery, a series of kV fluoroscopic images were acquired with an On-Board Imager system showing the position of the ball bearing and hence the target. The target position as function of treatment delivery time was then obtained by comparing the gantry angles recorded for the kV images with the gantry angles that were recorded in the Dynalog files along with the beam-on status. The radiochromic film for dosimetric measurement was not irradiated by the kV beam.
The control point evolution as function of treatment delivery time was either obtained by assuming a constant dose rate of 600 MU/min (conformal treatments, dynamic IMRT) or from the gantry angle in the Dynalog files (VMAT) or the beam-on status in the Dynalog files (step-and-shoot IMRT). For tracking treatments, the plan control points were replaced by control points created with 50 ms intervals from the MLC and beam-on status recordings in the Dynalog files.
Construction of motion mimicking treatment plans
For each motion experiment, the synchronized target motion and control point evolution was used to construct a motion mimicking treatment plan as described in Sec. 2A. Since the investigated motion was 1D with a 20 mm range, each field in the original treatment plan resulted in 21 different sub-beams with 21 different isocenters in the motion mimicking plan (we used 1 mm bin size). The motion mimicking treatment plan was imported into the Eclipse TPS, where dose calculation was performed with a 2 mm grid size using both the AAA algorithm19 and the Acuros algorithm20 of Eclipse. The resulting dose matrix in the sagittal plane of the film was exported from the TPS along with the corresponding dose matrix of the original static treatment plans.
Film analysis
The exposed EBT2 films were scanned with a resolution of 150 pixels per inch by an Epson Dual Lens perfection V700 desktop scanner using the transmission mode and 48 bit color mode. Each film was placed in the same position in the scanner and the film scanning protocol of Huet et al.21 was followed including scanner warm-up procedure and pauses between scans. The film scanning and film analysis were performed using the software packages FilmScan 2.8, FilmCal 2.4, and VeriSoft 4.1 (PTW, Freiburg, Germany). After background subtraction, the optical density of the red color component was extracted and converted to a dose scale based on five calibration films (depth doses in a homogenous phantom with five different doses). The measured 2D dose distribution was compared with the reference dose from the TPS using a gamma analysis with pass criteria of 2% dose difference and 2 mm distance to agreement. The percentage dose difference was calculated relative to the maximum dose and doses below 5% or 0.1 Gy were ignored. Here, the 0.1 Gy exclusion criterion was only relevant for the experiments with a single IMRT field taken from a five-field IMRT plan. The measured dose was aligned with the calculated reference dose by using three pinholes in the film followed by fine adjustments of up to 1 mm.
RESULTS
Figure 5 shows the reconstructed and the measured dose distributions for the single sliding windows IMRT field [Fig. 5a], the five-field step-and-shoot IMRT plan [Fig. 5b], and the two-arc VMAT plan [Fig. 5c]. In each case, the figure presents the dose distributions of one treatment with static target and two treatments with moving target and different timing between target motion and treatment delivery. The target motion was in the vertical direction of the images in the figure. As seen in Fig. 5a, the dose distributions in the motion experiments with a single IMRT field differed markedly from each other and from the static target dose due to interplay effects. This is also seen in the dose profiles in Fig. 6. The interplay effects were less pronounced for the complete treatment plans in Figs. 5b, 5c. Both the interplay effects and the dose blurring were reproduced well in the dose reconstruction, and this was a general result for all treatment plans as seen by the high gamma pass rates in Table 1. This table shows the 2 mm/2% gamma pass rate between the measured and reconstructed 2D dose distributions for all investigated plans except the two conformal fields for DMLC tracking. Each number in Table 1 is the mean result of two experiments. The mean pass rates were 99.3% (AAA) and 99.5% (Acuros) for the static experiments and 99.8% (AAA and Acuros) for motion experiments. The higher pass rates with motion probably reflect that the gamma test is more forgiving for the blurred dose distributions with less steep gradients. We ascribe the higher pass rates with Acuros to the higher accuracy of this algorithm in lung equivalent tissue where AAA tended to give too broad penumbra.22
Figure 5.

Examples of calculated (left side of each pair) and measured (right side) 2D dose distributions for dynamic treatments. Row (a) shows results for a single lateral field while rows (b) and (c) show results for entire treatment plans. The calculations used the AAA algorithm.
Figure 6.

Calculated (dotted curves) and measured (solid) dose profiles in the (a) cranio-caudal and (b) anterior-posterior directions from the three experiments with a single sliding windows IMRT field in Fig. 5a. The calculations used the AAA algorithm.
Table 1.
Comparison of measured and reconstructed dose distributions for dynamic treatments. 2 mm/2% gamma pass rates.
| Static target |
Moving target |
|||
|---|---|---|---|---|
| Treatment | AAA | Acuros | AAA | Acuros |
| Five-field conformal plan | 98.1% | 99.6% | 100% | 100% |
| Five-field dynamic IMRT plan | 98.9% | 99.7% | 100% | 100% |
| Single field from above plan | 99.4% | 99.4% | 99.7% | 99.6% |
| As above with five times higher MU [Fig. 5a] | 99.7% | 99.7% | 99.7% | 99.8% |
| Five-field step-and-shoot IMRT plan [Fig. 5b] | 99.6% | 99.5% | 99.9% | 100% |
| Single field from above plan | 99.5% | 99.5% | 99.3% | 99.2% |
| As above with five times higher MU | 99.5% | 99.3% | 99.7% | 99.9% |
| Two-arc VMAT plan [Fig. 5c] | 99.3% | 99.4% | 99.9% | 99.8% |
Figure 7 shows an example of the reconstructed and measured dose distributions for the experiments with lateral conformal fields for DMLC tracking. The experiments were made for the static target and for the moving target with and without DMLC tracking. As seen in Fig. 7, the dose reconstruction accurately modeled the dose blurring caused by target motion and the ability of the tracking to mitigate this effect. This is also seen in the cranio-caudal dose profiles, which are presented for these experiments in Fig. 8 and in the high gamma pass rates, which are reported in Table 2 as the mean values of two repeated experiments. The dose distributions were very similar in repeated experiments because the fields were conformal and the delivery spanned several motion cycles.
Figure 7.

Calculated (left side of each pair) and measured (right side) 2D dose distributions for a conformal field delivered to a static target and to a moving target with and without DMLC tracking. The calculations used the AAA algorithm.
Figure 8.

Calculated (dotted curves) and measured (solid) cranio-caudal dose profiles from the six experiments with conformal fields in Fig. 7. The target motion was (a) parallel and (b) perpendicular to the MLC leaves. The calculations used the AAA algorithm.
Table 2.
Comparison of calculated and measured dose distributions for conformal fields delivered with and without DMLC tracking. 2 mm/2% gamma pass rates.
| Static |
Motion without tracking |
Motion with tracking |
||||
|---|---|---|---|---|---|---|
| Target motion direction | AAA | Acuros | AAA | Acuros | AAA | Acuros |
| Parallel to MLC leaves | 99.6% | 99.8% | 99.9% | 99.9% | 99.5% | 99.4% |
| Perpendicular to MLC leaves | 99.4% | 99.3% | 99.8% | 99.6% | 99.4% | 99.2% |
The dose distributions in Fig. 7 illustrate a characteristic difference between DMLC tracking of target motion parallel and perpendicular to the MLC leaves. Because DMLC tracking of motion parallel to the MLC leaves only involved translation of the original MLC aperture the resulting dose distribution [Fig. 7a, right] was very similar to the static dose distribution [Fig. 7a, left]. On the other hand, DMLC tracking of perpendicular motion involved reshaping of the MLC aperture to accommodate to the changing target position. It resulted in a more distorted dose distribution with DMLC tracking as seen in Fig. 7b (right). Since the dose reconstruction was done in the clinical TPS the standard dose evaluation tools of the TPS were available. As an example, Fig. 9 shows the DVH for the GTV for the conformal fields with and without target motion and DMLC tracking. It illustrates how the GTV dose was compromised by target motion and how DMLC tracking was able to restore the planned GTV dose. Note that even small intrafraction motion may compromise the GTV dose since 67% dose was prescribed to the periphery of the PTV in accordance with Baumann et al.17
Figure 9.

Dose volume histograms for the GTV without target motion and with target motion with and without dynamic MLC tracking. Results are shown for target motion (a) parallel and (b) perpendicular to the MLC leaves. The calculations used the AAA algorithm.
DISCUSSION
In this study, a simple but versatile method to calculate the dose delivered to rigidly moving targets in dynamic treatments was developed. Film dosimetry in a thorax motion phantom demonstrated very high accuracy of the reconstructed dose for a wide range of dynamic treatments in the challenging case of a moving water equivalent tumor embedded in lung density material. The method utilizes the dose algorithms of a clinical TPS and is suitable for integration into a clinical workflow, e.g., for quality control of the actually delivered dose to a moving target or to test the robustness of a given treatment plan against target motion. Unlike previous dose reconstruction methods based on commercial TPSs, the current method can account for interplay effects in all treatment types including dynamic IMRT, VMAT, and DMLC tracking. For conformal treatments, the dose reconstruction reduces to the method of Berbeco et al.,14 but long processing times are avoided since the motion mimicking treatment plan is generated automatically by a computer program. Unlike dose convolution methods (but similar to fluence convolution methods), the current method does not assume shift invariance of the dose distribution.4 This is the reason for the high accuracy obtained for the thorax phantom where the shift invariance assumption is invalid.
The current work presented a relatively simple application of the reconstruction method as it focused on the accumulated fraction dose for a target with sinusoidal motion. The method, however, has much wider use. Instead of the accumulated fraction dose, the method can be used to calculate the time resolved dose as it accumulates during the treatment delivery or to calculate the accumulated dose over several treatment fractions, e.g., for margin assessment, adaptive replanning, or better comparison with treatment outcome in dose response studies. Instead of a 1D sinusoidal motion an arbitrary real or assumed 3D target motion could be used, e.g., from a tumor motion database in order to assess the possible impact of tumor motion on a given treatment plan. Finally, instead of real treatments the method could be used for simulated treatments, which could be relevant for DMLC tracking where the MLC motion during treatment will depend on the target motion. Combining the dose reconstruction with simulated DMLC tracking delivery would be a strong tool to investigate the potential dosimetric gain of DMLC tracking or the robustness of a given DMLC tracking plan against different types of target motion. Besides these generalizations, the method is directly applicable to gating.
In a conventional clinical workflow, the TPS is used to construct a treatment plan which is then transferred to the treatment machine where it is delivered. The current work suggests that a reversal of this process could also be relevant, namely, construction of a treatment plan that reflects the treatment delivery (including the target motion) and is transferred back to the TPS for dose reconstruction. This scheme would be very relevant for DMLC tracking, where the motion and thus the treatment varies from day to day and where the required knowledge of the intratreatment motion is available. As tracking becomes clinically available such capability should be an integrated part of a TPS for treatment fraction specific quality assurance.
Ideally, for dose reconstruction the entire patient anatomy with time would be known during the treatment delivery which would give sufficient information for accurate dose estimation. As these data are not available, approximations need to be made. In the presented dose reconstruction, the target motion was modeled by sub-beam isocenter shifts. While this approach allows the use of a single 3D CT scan to reconstruct the target dose for arbitrary target motion it has two main limitations, which also apply to most other dose reconstruction methods based on clinical TPSs.2, 3, 4, 5, 6, 7, 8, 9, 10, 11, 12, 13, 14 First, the isocenter shifts only account for rigid target translations, while target rotations and deformations are neglected. Second, as illustrated in Fig. 2, the method assumes that the entire surrounding body performs the same rigid translations as the target. It means that changes in the radiological path length (i.e., changes in the amount of damping material along the beam entrance) are neglected, while only changes in the physical path length are accounted for. Furthermore, the reconstructed dose to normal tissue that moves differently from the target is incorrect. It should be noted that the experiments in this study did not explore situations where these limitations affect the dose since only rigid target motion perpendicular to the beam axis was investigated. For 3D motion with an in-depth motion component along the beam axis, the lack of radiological path length change modeling would result in an error in the calculated target dose level of, for example, approximately 3.5% if the mean radiological path length for a beam differed by 1 cm water equivalent tissue from the planning CT scan (assuming a typical tissue phantom ratio fall off of 3.5% per cm for 6 MV). For a treatment plan with several treatment beams, this error would tend to average out when the contributions from all beams are added. As an alternative to isocenter shifts in a 3D CT scan, target motion could be modeled by creating sub-beams for each phase of a 4D CT scan and perform phase-specific dose calculations for each breathing phase.23 Although this approach can be done with the proposed method, it restricts the possible target motion to the discrete positions observed in the 4D CT scan, which is often insufficient to cover the entire motion range during treatment.
CONCLUSION
A method for accurate dose reconstruction for moving targets with dynamic treatments was developed and validated in experiments. The method is suitable for integration into TPSs, e.g., for reconstruction of the dose delivered to moving tumors or calculation of target doses delivered with DMLC tracking.
ACKNOWLEDGMENTS
The authors gratefully thank Marko Rusanen, Varian Medical Systems, for valuable advises regarding the Eclipse dose calculations. This work was supported by research grants from National Institutes of Health (NIH) NIH/NCI P01 CA116602, Varian Medical Systems, Inc., Palo Alto, CA, The Danish Cancer Society, the National Health and Medical Research Council (NHMRC) Australia Fellowship, and Center for Interventional Research in Radiation Oncology (CIRRO)—The Lundbeck Foundation CIRRO.
References
- Bortfeld T., Jiang S. B., and Rietzel E., “Effects of motion on the total dose distribution,” Semin. Radiat. Oncol. 14, 41–51 (2004). 10.1053/j.semradonc.2003.10.011 [DOI] [PubMed] [Google Scholar]
- Yu C. X., Jaffray D. A., and Wong J. W., “The effects of intra-fraction organ motion on the delivery of dynamic intensity modulation,” Phys. Med. Biol. 43, 91–104 (1998). 10.1088/0031-9155/43/1/006 [DOI] [PubMed] [Google Scholar]
- Lujan A. E., Larsen E. W., Balter J. M., and Ten Haken R. K., “A method for incorporating organ motion due to breathing into 3D dose calculations,” Med. Phys. 26, 715–720 (1999). 10.1118/1.598577 [DOI] [PubMed] [Google Scholar]
- Craig T., Battista J., and Van Dyk J., “Limitations of a convolution method for modeling geometric uncertainties in radiation therapy. I. The effect of shift invariance,” Med. Phys. 30, 2001–2011 (2003). 10.1118/1.1589492 [DOI] [PubMed] [Google Scholar]
- Li H. S., Chetty I. J., Enke C. A., Foster R. D., Willoughby T. R., Kupellian P. A., and Solberg T. D., “Dosimetric consequences of intrafraction prostate motion,” Int. J. Radiat. Oncol., Biol., Phys. 71, 801–812 (2008). 10.1016/j.ijrobp.2007.10.049 [DOI] [PubMed] [Google Scholar]
- Adamson J., Wu Q., and Yan D., “Dosimetric effect of intrafraction motion and residual setup error for hypofractionated prostate intensity-modulated radiotherapy with online cone beam computed tomography image guidance,” Int. J. Radiat. Oncol., Biol., Phys. 80, 453–461 (2011). 10.1016/j.ijrobp.2010.02.033 [DOI] [PMC free article] [PubMed] [Google Scholar]
- Bharat S., Parikh P., Noel C., Meltsner M., Bzdusek K., and Kaus M., “Motion-compensated estimation of delivered dose during external beam radiation therapy: Implementation in Philips' Pinnacle(3) treatment planning system,” Med. Phys. 39, 437–443 (2012). 10.1118/1.3670374 [DOI] [PMC free article] [PubMed] [Google Scholar]
- Chetty I. J., Rosu M., Tyagi N., Marsh L. H., McShan D. L., Balter J. M., Fraass B. A., and Ten Haken R. K., “A fluence convolution method to account for respiratory motion in three-dimensional dose calculations of the liver: A Monte Carlo study,” Med. Phys. 30, 1776–1780 (2003). 10.1118/1.1581412 [DOI] [PubMed] [Google Scholar]
- Aristophanous M., Rottmann J., Court L. E., and Berbeco R. I., “EPID-guided 3D dose verification of lung SBRT,” Med. Phys. 38, 495–503 (2011). 10.1118/1.3532821 [DOI] [PubMed] [Google Scholar]
- Waghorn B. J., Shah A. P., Ngwa W., Meeks S. L., Moore J. A., Siebers J. V., and Langen K. M., “A computational method for estimating the dosimetric effect of intra-fraction motion on step-and-shoot IMRT and compensator plans,” Phys. Med. Biol. 55, 4187–4202 (2010). 10.1088/0031-9155/55/14/015 [DOI] [PubMed] [Google Scholar]
- Li H. S., Chetty I. J., and Solberg T. D., “Quantifying the interplay effect in prostate IMRT delivery using a convolution-based method,” Med. Phys. 35, 1703–1710 (2008). 10.1118/1.2897972 [DOI] [PMC free article] [PubMed] [Google Scholar]
- Langen K. M., Chauhan B., Siebers J. V., Moore J., and Kupelian P. A., “The dosimetric effect of intrafraction prostate motion on step-and-shoot intensity-modulated radiation therapy plans: Magnitude, correlation with motion parameters, and comparison with helical tomotherapy plans,” Int. J. Radiat. Oncol., Biol., Phys. (to be published). [DOI] [PMC free article] [PubMed]
- Naqvi S. A. and D'Souza W. D., “A stochastic convolution/superposition method with isocenter sampling to evaluate intrafraction motion effects in IMRT,” Med. Phys. 32, 1156–1163 (2005). 10.1118/1.1881832 [DOI] [PubMed] [Google Scholar]
- Berbeco R. I., Hacker F., Zatwarnicki C., Park S. J., Ionascu D., O'Farrell D., and Mamon H. J., “A novel method for estimating SBRT delivered dose with beam's-eye-view images,” Med. Phys. 35, 3225–3231 (2008). 10.1118/1.2938514 [DOI] [PubMed] [Google Scholar]
- Li J. G., Dempsey J. F., Ding L., Liu C., and Palta J. R., “Validation of dynamic MLC-controller log files using a two-dimensional diode array,” Med. Phys. 30, 799–805 (2003). 10.1118/1.1567951 [DOI] [PubMed] [Google Scholar]
- Litzenberg D. W., Moran J. M., and Fraass B. A., “Verification of dynamic and segmental IMRT delivery by dynamic log file analysis,” J. Appl. Clin. Med. Phys. 3, 63–72 (2002). 10.1120/1.1449362 [DOI] [PMC free article] [PubMed] [Google Scholar]
- Baumann P., Nyman J., Hoyer M., Wennberg B., Gagliardi G., Lax I., Drugge N., Ekberg L., Friesland S., Johansson K. A., Lund J. A., Morhed E., Nilsson K., Levin N., Paludan M., Sederholm C., Traberg A., Wittgren L., and Lewensohn R., “Outcome in a prospective phase II trial of medically inoperable stage I non-small-cell lung cancer patients treated with stereotactic body radiotherapy,” J. Clin. Oncol. 27, 3290–3296 (2009). 10.1200/JCO.2008.21.5681 [DOI] [PubMed] [Google Scholar]
- Poulsen P. R., Carl J., Nielsen J., Nielsen M. S., Thomsen J. B., Jensen H. K., Kjaergaard B., Zepernick P. R., Worm E., Fledelius W., Cho B., Sawant A., Ruan D., and Keall P. J., “Megavoltage image-based dynamic multileaf collimator tracking of a NiTi stent in porcine lungs on a linear accelerator,” Int. J. Radiat. Oncol., Biol., Phys. 82, e321–e327 (2012). 10.1016/j.ijrobp.2011.03.023 [DOI] [PMC free article] [PubMed] [Google Scholar]
- Fogliata A., Nicolini G., Vanetti E., Clivio A., and Cozzi L., “Dosimetric validation of the anisotropic analytical algorithm for photon dose calculation: Fundamental characterization in water,” Phys. Med. Biol. 51, 1421–1438 (2006). 10.1088/0031-9155/51/6/004 [DOI] [PubMed] [Google Scholar]
- Fogliata A., Nicolini G., Clivio A., Vanetti E., Mancosu P., and Cozzi L., “Dosimetric validation of the Acuros XB advanced dose calculation algorithm: Fundamental characterization in water,” Phys. Med. Biol. 56, 1879–1904 (2011). 10.1088/0031-9155/56/6/022 [DOI] [PubMed] [Google Scholar]
- Huet C., Dagois S., Derreumaux S., Trompier F., Chenaf C., and Robbes I., “Characterization and optimization of EBT2 radiochromic films dosimetry system for precise measurements of output factors in small fields used in radiotherapy,” Radiat. Meas. 47, 40–49 (2012). 10.1016/j.radmeas.2011.10.020 [DOI] [Google Scholar]
- Bush K., Gagne I. M., Zavgorodni S., Ansbacher W., and Beckham W., “Dosimetric validation of Acuros XB with Monte Carlo methods for photon dose calculations,” Med. Phys. 38, 2208–2221 (2011). 10.1118/1.3567146 [DOI] [PubMed] [Google Scholar]
- Rao M., Wu J., Cao D., Wong T., Mehta V., Shepard D., and Ye J., “Dosimetric impact of breathing motion in lung stereotactic body radiotherapy treatment using image-modulated radiotherapy and volumetric modulated arc therapy,” Int. J. Radiat. Oncol., Biol., Phys. 83, e251–e256 (2012). 10.1016/j.ijrobp.2011.12.001 [DOI] [PubMed] [Google Scholar]