

Abstract
This study used magnetoencephalography to record oscillatory activity in a group of 17 patients with chronic tinnitus. Two methods, residual inhibition and residual excitation, were used to bring about transient changes in spontaneous tinnitus intensity in order to measure dynamic tinnitus correlates in individual patients. In residual inhibition, a positive correlation was seen between tinnitus intensity and both delta/theta (6/14 patients) and gamma band (8/14 patients) oscillations in auditory cortex, suggesting an increased thalamocortical input and cortical gamma response, respectively, associated with higher tinnitus states. Conversely, 4/4 patients exhibiting residual excitation demonstrated an inverse correlation between perceived tinnitus intensity and auditory cortex gamma oscillations (with no delta/theta changes) that cannot be explained by existing models. Significant oscillatory power changes were also identified in a variety of cortical regions, most commonly midline lobar regions in the default mode network, cerebellum, insula and anterior temporal lobe. These were highly variable across patients in terms of areas and frequency bands involved, and in direction of power change. We suggest a model based on a local circuit function of cortical gamma-band oscillations as a process of mutual inhibition that might suppress abnormal cortical activity in tinnitus. The work implicates auditory cortex gamma-band oscillations as a fundamental intrinsic mechanism for attenuating phantom auditory perception.
Keywords: tinnitus, gamma oscillations, mutual inhibition, auditory cortex, magnetoencephalography
Introduction
Tinnitus is the perception of pitch or noise in the absence of a corresponding auditory stimulus, experienced as one or more acute episodes by 25% of the adult population and daily or permanently by 8% (Shargorodsky et al., 2010). It is a symptom rather than a diagnosis and the existence of a universal substrate is controversial. Deafferentation of the central auditory system, identifiable as an abnormality on the pure-tone audiogram or more subtle tests of cochlear function (Weisz et al., 2006; Schaette and McAlpine, 2011), has been proposed as one initiating event. A prevalent model for the neural correlate of tinnitus is based on thalamocortical dysrhythmia (Llinás et al., 1999). The thalamocortical dysrhythmia model proposes that tinnitus is driven by low-frequency delta (∼2 Hz) and theta (∼6 Hz) activity projecting from auditory thalamus to auditory cortex. This low-frequency activity represents a mode of spontaneous thalamic activity that occurs when normal thalamic input is lost due to deafferentation. The low-frequency thalamocortical input in turn induces high-frequency gamma oscillations in auditory cortex, putatively resulting from an imbalance in lateral inhibition. Gamma oscillations have been proposed as bases for the perception of tinnitus (Weisz et al., 2007) or, more specifically, for intensity coding (van der Loo et al., 2009; de Ridder et al., 2011a). Increased delta, theta and gamma oscillations in auditory cortex have been reported in several studies of resting-state activity in tinnitus (Weisz et al., 2005, 2007; Ashton et al., 2007; van der Loo et al., 2009; Moazami-Goudarzi et al., 2010; de Ridder et al., 2011b). However, reports of oscillatory changes are controversial in several respects. Firstly, the frequency bands labelled ‘gamma’ in these studies vary hugely from low gamma frequencies under 45 Hz (van der Loo et al., 2009), through narrow ranges such as 50–55 Hz (Weisz et al., 2007) to much wider ranges and higher frequencies (de Ridder et al., 2011b; Ortmann et al., 2011). Outside the field of tinnitus, gamma oscillations in auditory cortex recorded with magnetoencephalography (MEG) can extend to at least 150 Hz (Sedley et al., 2012). Secondly, where auditory gamma oscillations in tinnitus have been identified, they have correlated with tinnitus perceptual features such as laterality in some studies (van der Loo et al., 2009). In Ortmann et al. (2011), however, the correlation appeared to be with hearing loss rather than tinnitus perception. Thirdly, existing evidence is derived from resting-state measurements of tinnitus, which do not permit examination of the dynamic relationship between observed abnormalities and tinnitus perception. Finally, while gamma oscillations have been observed in positive association with tinnitus, and with other types of percept (Tallon-Baudry and Bertrand, 1999), evidence from primary visual cortex shows that they are inversely related to neuronal firing rate and selective attention (Gieselmann and Thiele, 2008; Chalk et al., 2010). At a local circuit level, they are best modelled as having their basis in lateral inhibitory processes and acting to mediate stimulus selectivity (Bathellier et al., 2006; Börgers et al., 2008). Considered alone, these findings raise the possibility that gamma oscillations might even act to suppress tinnitus. We present evidence here that this might be the case.
An additional issue that is largely unaddressed by the existing literature concerns heterogeneity of the neural substrate for tinnitus across patients. Recent group-level EEG work on tinnitus has demonstrated differences between the substrates of high versus low distress groups, tonal versus narrow-band noise tinnitus, unilateral versus bilateral tinnitus, responders versus non-responders to prefrontal transcranial direct current stimulation in tinnitus, and recent versus chronic tinnitus (Vanneste et al., 2010a, b, 2011a, b, d). It is therefore known that there is a certain amount of heterogeneity in the substrate for tinnitus, but the full extent of this remains unknown. We have therefore developed single-patient measures of the substrates for tinnitus, both to gain a better understanding of the extent of heterogeneity and to identify subtypes and variable-associated phenomena that might be masked by group analysis.
We used MEG to examine dynamic correlates of tinnitus during short-term variations in tinnitus intensity in individual patients that were associated with the two phenomena that are illustrated in Fig. 1. Residual inhibition is a transient decrease in tinnitus intensity following the presentation of a specific external stimulus, persisting beyond the duration of that sound (Feldmann, 1971; Roberts, 2007). The phenomenon is well reported in the literature, and results from stimulation of deafferented parts of the tonotopic axis in the lower auditory pathways, reducing spontaneous low-frequency activity projecting to auditory cortex. Consistent with this model, the only previous study using residual inhibition with MEG (Kahlbrock and Weisz, 2008) found a decrease in low-frequency delta (∼2 Hz) oscillations in auditory cortex during residual inhibition, suggesting a reduced thalamocortical input. A perceptually opposite phenomenon to residual inhibition has been observed whereby patients experience a transient increase in tinnitus intensity following the presentation of an external sound that persists beyond the duration of that sound. In a study of residual inhibition, in a subset of patients, external sound caused tinnitus to become louder (Roberts et al., 2006). Despite being quite common (numerous patients have reported it both in person and in online tinnitus forums), this phenomenon has received relatively little attention in the scientific literature on tinnitus, and presently lacks a name or a proposed mechanism. We have applied the term ‘residual excitation’ to this phenomenon. As its mechanism is unknown, it does not necessarily involve modification of low-frequency activity in the lower auditory pathways, as in residual inhibition.
Figure 1.

Example schematic of residual inhibition and residual excitation paradigms. In each half, the upper section shows the active (masker) condition and the lower section the control condition. The horizontal axis represents time, the shaded rectangles the auditory stimuli, the numbered brackets the data segments potentially used for analysis, the continuous black lines the intensity of tinnitus and the short vertical lines the instances where the patient rates their tinnitus intensity. The arrowed lines indicate the data segments used for further analysis in these examples and the categories to which they are assigned. Note that the ‘high’ and ‘low’ categories are relative, and paradigm-dependent, such that baseline tinnitus intensity is designated high and low in residual inhibition and residual excitation, respectively.
We studied tinnitus correlates in individual patients, rather than at group level, to disambiguate neural activity common to all patients (reflecting universal mechanisms) from that which was heterogeneous across patients (reflecting individual mechanisms), and to allow tolerance to subtle differences in anatomical location or precise frequency of observed activity that might be lost at group level. We used a validated 4D (three spatial dimensions and a frequency dimension), non-parametric, permutation-based cluster identification method to identify areas of brain-frequency space showing oscillatory power changes significant at the individual level after correction for multiple comparisons (Hipp et al., 2011). This method removes constraint or bias from previous hypotheses.
Materials and methods
We aimed to study a range of ‘typical’ tinnitus patients rather than any specific subtype. Thirty patients with chronic tinnitus (>6 months duration) were recruited through a local tinnitus clinic and public advertisement at University College London. We recruited through both methods to find a range of patients with tinnitus in terms of severity and distress. Patients were selected irrespective of their specific tinnitus phenomenology, except that we preferentially invited patients who stated they had normal hearing or unilateral tinnitus. The reason for this selectivity was that only a minority of tinnitus patients fall into these categories, and we wanted to be able to assess whether observed correlates could be explained by hearing loss, and whether or not they would be observed contralaterally to the side of perceived tinnitus as might be expected from previous research (van der Loo et al., 2009). Only the following exclusion criteria were applied: wider neurological illness, tinnitus of vascular origin, profound deafness and the use of sedative medications or contraindications to MRI. All patients provided informed written consent, and the study was approved by the North London Research Ethics Committee 1, UK.
Audiometric assessment
Patients had pure-tone audiograms performed (from 0.125 to 8 kHz in octave steps) at a neuro-otology clinic separately from the main study, with the exception of two patients who were lost to follow-up before this could be arranged. Most patients also underwent recording of transient evoked otoacoustic emissions in the 1–4 kHz response range. We used 20 dB as the threshold for identifying areas of hearing loss on pure-tone audiogram, and for transient evoked otoacoustic emissions we defined frequency regions of reduced emissions as those with a signal-to-noise ratio of <7 dB, based on age-stable population normative data (Glattke and Robinette, 1997).
Tinnitus phenomenological and psychophysical assessment
Patients completed a questionnaire outlining the phenomenology of their tinnitus (including character, loudness, duration and laterality) and the Tinnitus Handicap Inventory (Newman et al., 1996). Each patient used a customized computer program to create and modify the centre frequency and bandwidth of a white noise stimulus to cause maximal suppression of their tinnitus (masker), and another signal physically similar to the masker but that caused minimal or no suppression (control). As an alternative to creating a stimulus causing transient suppression of tinnitus (residual inhibition), patients were also given the option of finding a stimulus that caused a transient increase in tinnitus, or residual excitation. The paradigm for residual excitation was identical to that for residual inhibition. Patients achieving residual inhibition or residual excitation based on the psychophysical assessment were selected to participate in the MEG experiment, and undergo structural MRI, irrespective of the degree or duration of the tinnitus modification; again, we aimed to study typical tinnitus patients by being as unbiased as possible. Patients unable to achieve either phenomenon were not studied further. See Supplementary material for further details of the psychophysical assessment and its quantification.
Data collection
MEG data were acquired for 20 min, with patients in an upright position, using a CTF Systems whole-head configuration with 274 axial gradiometers. Patients fixated on the centre of a screen in front of them for the duration of the experiment. Auditory stimuli consisted of the masker and control stimuli created during the psychophysics session, which were delivered diotically via a pneumatic system with Etymotic earmolds, and adjusted to a comfortable volume for the patient of ∼70 dBA. The masker and control stimuli were matched in terms of the root–mean–square intensity and duration, and differed in centre frequency (and sometimes bandwidth). The recording session consisted of the largest even number of blocks that could be fitted into 20 min. Each block contained the same order of events as in the psychophysics: (i) presentation of masker or control stimulus for specified duration (range 6–30 s); (ii) immediate rating of tinnitus intensity after cessation of stimulus; and (iii) a specified number of passive, silent periods (range 1–12 periods) of specified length (range 5–15 s), where data were collected and used for analysis. These periods were each followed by a further rating of tinnitus intensity, which was rated using the same 5-point scale as in the psychophysics session; the current tinnitus rating was displayed on the screen (starting at ‘normal’ for the first rating and updated thereafter) and patients used a three-button keypad to decrease, increase or accept this rating. The experiment did not proceed until a rating was given, so there were no instances of missed ratings. Patients’ mean times taken to give ratings ranged from 0.90 to 3.55 s [mean 1.74, standard deviation (SD) 0.66]. Patients’ mean intervals between the end of one stimulus and the start of the next (i.e. the sum of all passive silent periods and active rating periods) ranged from 13 to 138 s (mean 66, SD 32). Figure 1 illustrates the experimental design for both residual inhibition and residual excitation paradigms.
After MEG, a T1-weighted structural MRI scan (Deichmann et al., 2004) was acquired for each patient at 3 T. Vitamin E capsules were placed over the MEG fiducial points to allow accurate co-registration. Due to claustrophobia and/or hyperacusis, six patients could not tolerate the structural MRI scan, and a template T1 brain image (from the SPM8 toolbox for MEG/EEG; Litvak et al., 2011) was used for their analysis instead.
Data sorting
MEG data were separated into segments corresponding to the passive, silent periods used in the experiment. Only data acquired during these epochs were used for analysis, and all data acquired during the presentation of auditory stimuli or the active rating process (defined as from the start of the rating prompt until the rating was given) were discarded. Segments were sorted into ‘high’ and ‘low’ conditions based on the intra-experimental ratings of tinnitus intensity that immediately preceded and followed them. For the purposes of the analysis of dynamic fluctuation in intensity within subjects, the absolute ratings corresponding to ‘high’ and ‘low’ could differ between subjects to allow a similar number of segments corresponding to each condition and the maximum power to demonstrate brain changes when the tinnitus changed. There was no requirement that data assigned to the ‘low’ category had to follow the masker rather than control stimulus, or vice versa, although this was usually the case in practice. Some strict rules were applied to prevent any bias or confounds from influencing the results: (i) data were sorted into categories only once, prior to analysis, and this process was not repeated; (ii) the same total length of data had to be included in each condition; and (iii) data segments in each category were matched in terms of how long after the most recent auditory stimulus they occurred (to exclude a main effect of time).
Data processing and statistical analysis
Data segments were fragmented into trials of 2.5 s and analysed using FieldTrip (Oostenveld et al., 2011) and custom written analysis routines in MATLAB (Mathworks Inc.). To examine oscillatory power changes at all frequencies and all cortical locations while correcting for multiple comparisons, we employed a non-parametric 4D Monte Carlo cluster analysis technique, with cluster significance determined by a permutation statistic. Our methods were based on recently published methods (Hipp et al., 2011), with minor differences, as described in the Supplementary material. In essence, this method reconstructs power changes, using a beamformer algorithm, at each frequency on a 16 point logarithmic scale (1.5–150 Hz) in each brain location on a 3D grid with 10-mm spacing, and uses a non-parametric analysis to identify significant clusters within this 4D brain frequency space. Significant clusters are projected into the 3D spatial and 1D frequency domains for display.
As a conservative post hoc analysis, we sought to confirm the dichotomous trend in auditory cortex gamma oscillations at group level. To do this, we treated each hemisphere in each patient as a single subject. Power in each of 16 logarithmically-spaced frequency bands from 1.5 to 150 Hz was calculated, using the dynamic imaging of coherent sources beamformer (dynamic imaging of coherent sources; Gross et al., 2001), at the single dipole closest to the posterior border of mid-Heschl’s gyrus (approximating the centre of auditory cortex) and averaged to a single value for each frequency in each subject. Power values were calculated as (Phigh − Plow)/(Phigh + Plow), with P representing the mean raw power value for each condition. At each of the 16 frequencies, a two-tailed independent samples t-test was performed to test for significant differences between the residual inhibition and residual excitation groups (P < 0.05, uncorrected).
Results
Patients and psychophysics
Thirty patients participated in the study; seven of these could not achieve residual inhibition or excitation, one could not tolerate the psychophysical experiment, one had a complex psychophysical response to the masker stimulus that could not be quantified, two required masking stimulus frequencies of >10 kHz that could not be reproduced on the pneumatic sound delivery system used for MEG, one could not remove an item of religious headgear that was incompatible with MEG and the data from one patient were lost due to an acquisition error. Of the remaining 17 patients completing the study, 14 exhibited residual inhibition and four exhibited residual excitation. One patient exhibited both residual inhibition and residual excitation, and was analysed as a separate subject for each phenomenon. Table 1 summarizes the patients’ demographics, tinnitus phenomenology and experimental psychophysics. Three patients were female, and ages ranged from 21 to 52 years. Eight patients did not have any hearing loss on pure tone audiogram up to 8 kHz, defined as hearing level >20 dB. Nine patients underwent measurement of transient evoked otoacoustic emissions (including four with normal pure-tone audiograms); all of these patients had reduced emissions in the 4-kHz region, with some also having decreases in lower frequencies. Tinnitus duration varied from 7 months to 15 years. Tinnitus Handicap Inventory scores varied from 8 to 56 out of 100. Nine patients had symmetrical bilateral tinnitus, four had asymmetrical bilateral tinnitus and four had unilateral tinnitus. Masker centre frequencies were all >1 kHz but highly variable (range 1.2–7 kHz), as were the bandwidths (range 0.025–0.525 kHz with an outlier at 4 kHz). Fourteen out of 18 masker stimuli (in both residual inhibition and residual excitation conditions) were of higher centre frequency than their respective controls. Of the remaining stimuli, one was of equal centre frequency to its control (differing in bandwidth), one was identical (serving as its own control) and two had consistency indices at or near zero (denoting equal masking efficacy of masker and control stimuli). These findings raise the possibility that observed power changes might represent responses to systematic differences in the preceding stimuli rather than changes in tinnitus properties; however, we present arguments against this possibility in the Supplementary material. In the majority of patients with hearing loss, there was no consistent relationship between frequency of hearing loss and masker or control stimulus frequencies; masker frequencies fell inside and outside of regions of hearing loss, and in one case, the masker fell outside of the hearing loss range while the control stimulus was within it. Consistency indices were highly variable for residual inhibition, occupying the full 0–1 range. Three patients showing residual inhibition had consistency indices of 1.0; they all had hearing loss on pure-tone audiogram and masker frequencies that fell within their region of hearing loss or (in one case) within their region of reduced transient evoked otoacoustic emissions. For patients showing residual excitation, the consistency index range was 0.87–1.0 and, unlike in residual inhibition, high consistency indices were found in patients with normal pure-tone audiograms. No consistency index values were negative, indicating that all stimuli performed as expected. Standard deviations of duration of tinnitus modification following the masker stimuli were highly variable for both residual inhibition and residual excitation groups (0.00–1.63), and were not dependent on masker or pure-tone audiogram characteristics. Our findings suggest that residual inhibition is a highly variable phenomenon in its efficacy and consistency, and is most consistent where maskers are applied to regions of hearing loss, and are in keeping with prior research on residual inhibition (Roberts et al., 2008).
Table 1.
Patient and tinnitus characteristics
| No | Age | Sex | Aetiology | Dur | THI | Character | Lat | M Freq | M BW | C Freq | C BW | Length | Mod | M dur | Con Ind | STD | Data | PTA | TEOAEs | sMRI |
|---|---|---|---|---|---|---|---|---|---|---|---|---|---|---|---|---|---|---|---|---|
| 1 | 41 | M | Ear syringing | 14 | 14 | Noise/ Tonal | B | 5.000 | 4.000 | 2.000 | 1.000 | 20 | RI | 25.0 | 1.00 | 0.24 | 155 | 20 dB,4k,R | 1-4 k,L&2-4 k,R | Y |
| 2 | 32 | M | Idiopathic | 2 | 44 | Tonal | B | 1.750 | 0.076 | 0.750 | 0.076 | 20 | RI | 33.0 | 0.29 | 1.30 | 150 | Normal | x | Y |
| 3 | 50 | F | Idiopathic | 2 | 10 | Tonal | B | 2.175 | 0.025 | 2.075 | 0.025 | 10 | RI | 12.8 | 0.48 | 0.86 | 90 | Normal | 4 k,L&1-4 k,R | Y |
| 4 | 34 | M | Vestibular schwannoma (left) | 15 | 24 | Buzzing | L > R | 3.226 | 0.575 | 1.675 | 1.650 | 20 | RI | 2.9 | 1.00 | 1.52 | 35 | 50 dB,≥1.5 k,B | x | N |
| 5 | 52 | M | Cervical spine problems | 10 | 20 | Tonal | B | 5.900 | 0.025 | 4.700 | 0.025 | 30 | RI | 22.5 | 0.24 | 0.80 | 90 | 30 dB,4k,B and 35 dB,8k,L | 1-4 k,B | Y |
| 6 | 32 | M | Idiopathic | 2,5 | 36 | Tonal | R | 4.025 | 0.126 | 3.750 | 0.126 | 30 | RI | 9.0 | 0.27 | 1.63 | 225 | 36 dB,4k,R and 25-32 dB, 0.5,1,4 k,L | 4 k,L&2.8-4 k,R | Y |
| 7 | 21 | M | Noise trauma | 6 | 10 | Noise | L > R | 4.275 | 0.075 | 0.500 | 0.050 | 20 | RI | 33.1 | 0.45 | 0.14 | 120 | Normal | 1,2.8-4 k, L&2-4 k,R | Y |
| 8 | 51 | M | Idiopathic | 10 | 56 | Buzzing | L > R | 1.200 | 0.050 | 2.000 | 0.050 | 30 | RI | 20.0 | 0.00 | 0.70 | 165 | Normal | x | Y |
| 9 | 21 | M | Noise trauma | 1 | 26 | Buzzing | B | 3.000 | 0.150 | 1.000 | 0.700 | 20 | RI | 40.0 | 0.77 | 0.21 | 150 | Normal | 4 k,B | N |
| 10 | 23 | F | Sensorineural hearing loss | 14 | 46 | Noise | B | 1.425 | 0.525 | 1.050 | 0.525 | 20 | RI | 35.0 | 0.21 | 0.68 | 230 | Total,L and ≤66 dB, ≥2 k,R | x | N |
| 11 | 52 | M | Head/neck trauma | 1,6 | 8 | Buzzing | L | 5.700 | 0.176 | 4.725 | 0.226 | 30 | RI | 18.8 | 0.48 | 0.86 | 150 | Normal | x | Y |
| 12 | 41 | M | Idiopathic | 5 | 28 | Tonal | R | 5.175 | 0.050 | 3.875 | 0.050 | 20 | RI | 9.4 | 0.50 | 1.17 | 100 | No known hearing loss (no PTA) | x | Y |
| 13 | 25 | M | Idiopathic | >10 | 20 | Noise | B | 5.175 | 1.248 | 5.175 | 0.050 | 20 | RI | 31.3 | 1.00 | 0.48 | 190 | 24 dB,1k,L | 1,4 k,L | Y |
| 5.175 | 0.050 | 5.175 | 0.050 | 20 | RE | 6.9 | 1.00 | 0.73 | 85 | |||||||||||
| 14 | 29 | M | NSAIDS + noise trauma | 4 | 18 | Tonal | B | 7.000 | 0.076 | 5.000 | 0.076 | 20 | RE | 20.6 | 0.87 | 0.91 | 125 | Normal | 1-4 k,B | N |
| 15 | 26 | F | Possibly genetic | >10 | 8 | Tonal | B | 1.800 | 0.076 | 1.393 | 0.729 | 20 | RE | 36.3 | 1.00 | 0.11 | 105 | Normal | x | Y |
| 16 | 32 | M | Idiopathic | 6 | 54 | Noise/Tonal/ Music/Other | R > L | 2.500 | 0.500 | 0.600 | 0.500 | 6 | RE | 5.0 | 1.00 | 0.00 | 50 | Bilateral SNHL (no PTA) | x | N |
| 17 | 27 | M | Noise trauma | 0,7 | 54 | Tonal | R | 1.725 | 0.050 | 4.125 | 0.672 | 20 | RI | 10.0 | 0.05 | 0.67 | 110 | 30 dB,4k,B | 4 k,L&2.8-4 k,R | N |
No = patient number for reference to figures; Dur = tinnitus duration (years, months); M Freq = centre frequency of masker (active) stimulus (kHz); B = bilateral; BW = bandwidth; C = control; Freq = centre frequency of stimulus; Lat = laterality; M = masker; THI = tinnitus handicap inventory score (/100); Length = duration of masker and control stimuli (s); Mod = type of tinnitus modification achieved (RI = residual inhibition; RE = residual excitation); M dur = mean duration (s) in which tinnitus rating is non-zero (i.e. modified) following each masker stimulus (including following maskers where no tinnitus modification occurred); Con. Ind. = consistency index, a measure of how much of the total tinnitus modification was due to the masker (not control) stimulus (1 = all modifications due to masker stimulus, 0 = tinnitus modified equally by masker and control stimuli), negative values, indicating greater efficacy of control than masker stimulus, are possible but did not occur; STD = standard deviation of duration of tinnitus modification by the masker stimulus (normalized to mean duration of modification, i.e. mean = 1); Data = total data length per condition used for final analysis (s); PTA = abnormal frequencies on pure tone audiometry (threshold, frequency, ear); TEOAEs = frequency bands exhibiting reduced transient evoked otoacoustic emissions (frequencies, ear); ‘x’ indicates where transient evoked otoacoustic emission data were not available. sMRI inhibition = whether subject’s own (Y) or template (N) structural image was used for analysis. SNHL = sensorineural hearing loss; NSAIDS = non-steroidal anti-inflammatory drugs.
Significant clusters
Of the 18 effective subjects, 17 showed at least one significant cluster of altered oscillatory power associated with altered tinnitus intensity, with three clusters being the maximum per subject and a total of 30 clusters identified. All clusters identified, whether consistent between subjects or not, were significant at individual level for P < 0.05 with correction for multiple comparisons, such that across all subjects only one false positive cluster would be expected. The following paragraphs outline the activity in the observed clusters, which is described in the direction of increased tinnitus (i.e. masker versus control in the residual inhibition condition, and control versus masker for residual excitation).
Auditory cortex and insula
Fifteen subjects showed clusters including power changes in auditory cortex (defined here as Heschl’s gyrus and planum temporale), with a total of 16 such clusters identified. These clusters are summarized in Fig. 2, with each cluster displayed on a single axial structural MRI slice alongside its frequency spectrum. Twelve clusters covering auditory cortex also appeared to include the insula (all of which were gamma-range clusters, i.e. >30 Hz), although due to spatial limitations, we cannot be confident whether this represents true insula activity or spillover from auditory cortex. Twelve auditory cortex clusters featured power changes in the gamma range, three of which also showed power changes in lower delta/theta frequency ranges, and three clusters were predominantly in the delta/theta range and did not include gamma changes. Frequency spectra within the gamma range varied between broad and relatively narrow bands, the latter also varying between higher and low gamma frequencies. Clusters varied in terms of laterality, being left or right lateralized, or bilateral, and cluster laterality appeared unrelated to tinnitus laterality. Some clusters were limited to auditory cortex, while others encompassed power changes in other cortical regions (largely midline cortical structures). Most strikingly, eight out of the nine auditory cortex gamma clusters in the subjects showing residual inhibition showed power increases with increased tinnitus intensity (constituting a significant group-level increase; binomial P = 0.0195), while all four of the gamma clusters in the residual excitation subjects showed power decreases with increased tinnitus intensity. This dichotomy was also seen in Subject 13, who exhibited both residual inhibition and residual excitation phenomena. Delta and theta range power changes were only found in association with residual inhibition, and only showed a positive correlation with tinnitus intensity.
Figure 2.

Clusters including power changes in auditory cortex. Each cluster’s spatial representation is displayed by showing a single representative axial slice at the level of the superior temporal plane. Each cluster is accompanied by the patient’s number (upper left) and tinnitus laterality (lower left), and its frequency spectrum is shown below the axial brain image. Red and yellow colours indicate power increases as a function of increased tinnitus intensity, and blue colours indicate power decreases as a function of increased tinnitus intensity. The upper 12 clusters represent residual inhibition, and the lower four clusters residual excitation. Bottom left: Plot showing one cluster’s frequency spectrum in greater detail to illustrate the frequency axis and highlight that the vertical axis indicates power change at each frequency (positive/red for power increases, negative/blue for decreases). The colour scales (bottom right) correspond to the power increases and decreases shown on the axial brain slices.
Our post hoc conservative analysis of auditory cortex power changes at group level confirmed the dichotomous trend in auditory cortex gamma described above. Figure 3 shows the results of this analysis with each frequency being represented by the group mean and standard error, for the residual inhibition and residual excitation groups separately. We found that there were few changes at group level for frequencies <∼20 Hz for either group, while above this there were increases for the residual inhibition group >80 Hz and dramatic decreases for the residual excitation group >20 Hz, both associated with increased tinnitus intensity.
Figure 3.

Power changes in auditory cortex at group level. Each hemisphere in each patient was treated as an individual subject. For each hemisphere, power was taken at the closest dipole to the posterior edge of the middle of Heschl’s gyrus. Relative power change was calculated, for each frequency, as 100(Phigh − Plow)/(Phigh + Plow). Points indicate the group mean and error bars indicate the standard error of the mean. The horizontal black bar denotes differences between groups significant at P < 0.05 uncorrected. RE = residual excitation; RI = residual inhibition.
Other cortical areas
Of the 30 significant clusters, 16 were positive (power increases associated with increased tinnitus) and 14 negative (power decreases with increased tinnitus). Clusters were heterogeneous in terms of their frequency ranges (including low, mid, high and mixed frequencies), and in terms of their directions of power change for a given cortical area between subjects. A wide range of brain regions was covered by the various clusters, but the most consistent besides auditory cortex were cerebellum (n = 12 clusters, 11 of high predominance, one of low predominance, six positive, six negative), anterior temporal lobe (n = 11, eight high predominance, five positive), posterior cingulate cortex (n = 14, seven high predominance, seven positive), ventromedial prefrontal cortex (n = 11, seven high predominance, five positive), medial occipital lobe (n = 13, five high predominance, seven positive) and anterior cingulate cortex (n = 12, three high predominance, five positive). These results are summarized in Table 2, and the clusters displayed in full in the Supplementary material. Due to the depth of the structures concerned, we were unable to distinguish activity in the cortex of the anterior temporal lobe from anterior mesial temporal lobe structures including amygdala and parahippocampal cortex, or to differentiate medial frontal lobe from anterior cingulate cortex or precuneus from posterior cingulate cortex. Power changes close to the Sylvian fissure were observed in many clusters (potentially including temporo-parietal junction and superior/middle temporal gyri) but could not confidently be distinguished as separate from auditory cortex activity, particularly as these always occurred as part of the same clusters. More power changes outside auditory cortex were observed in the residual inhibition group than the residual excitation group, but with no consistent relationship emerging. None of the areas covered by the clusters showed a consistent trend in terms of laterality, frequency band involved or direction of power change. Neither was observed heterogeneity of cluster characteristics clearly explicable by tinnitus laterality, duration, Tinnitus Handicap Inventory score or the presence of hearing loss, or by tinnitus character, the psychophysical measures of consistency index or standard deviation.
Table 2.
Summary of all clusters and power changes in the most frequently affected cortical areas
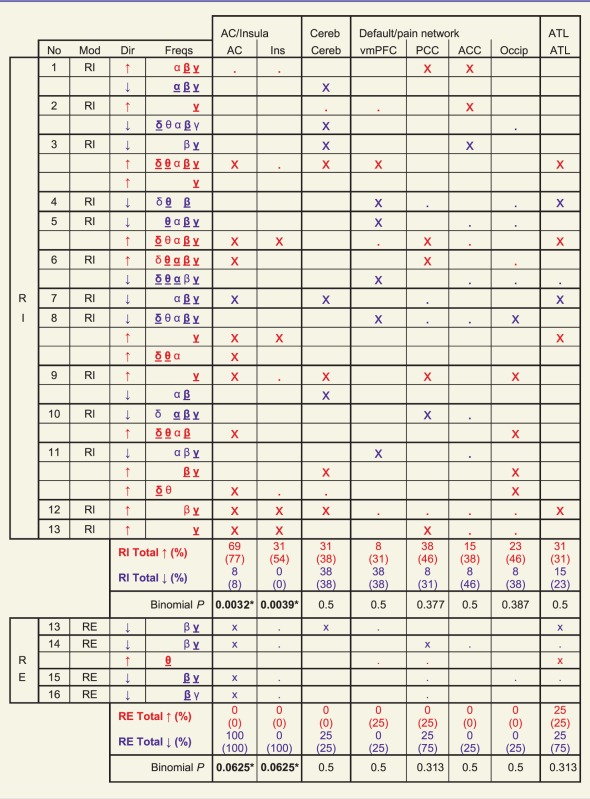 |
Each table row represents one cluster. No = subject number; Mod = type of tinnitus manipulation; Dir = direction of power change for cluster (red and blue text throughout table also denotes power increases and decreases respectively); Freqs = frequency bands covered by clusters (δ = 1.5–4, θ = 4–8, α = 8–12, β = 12–30, γ = 30–150 Hz); bold underlined symbol indicates max T score for frequency band ≥ 2/3 maximum for cluster, standard symbol indicates max T score ≥ 1/3 maximum. ‘x’ for a cortical area indicates max T score in that area ≥ 2/3 maximum for cluster, and ‘.’ indicates max T score ≥ 1/3 maximum for cluster. ‘Total’ rows indicate proportion of residual inhibition or residual excitation subjects showing at least one cluster with max T ≥ 2/3 maximum (open) and ≥1/3 maximum (parentheses) in that cortical area. See Supplementary Fig. 1 for an illustration of all 30 significant clusters in full. AC = auditory cortex; ACC = anterior cingulate cortex or adjacent mesial frontal lobe; ATL = anterior temporal lobe Cereb = cerebellum; Ins = insula; Occip = midline occipital cortex; PCC = posterior cingulate cortex or precuneus; RE = residual excitation; RI = residual inhibition; vmPFC = ventromedial prefrontal cortex.
Discussion
We studied a typical and heterogeneous group of patients with tinnitus, as evidenced by a range of ages, the presence or absence of overt hearing loss, tinnitus aetiology, distress, duration and laterality. Similarly heterogeneous across patients, though without any systematic relationship with these factors, were the frequency bands and directions of oscillatory power change in non-auditory cortical regions. The Supplementary material provides further interpretation of these findings and their relevance to the study of tinnitus and other perceptual situations, in which a similar degree of heterogeneity might be found. Despite this marked heterogeneity, subjects consistently demonstrated correlations, at individual level, between perceived tinnitus intensity and the strength of localized auditory cortex gamma oscillations in the residual inhibition and residual excitation conditions.
In the context of residual inhibition, auditory cortex gamma positively correlated with tinnitus intensity (i.e. decreased during residual inhibition). Residual inhibition is achieved by a transient and partial normalization of the deafferentation of auditory thalamus that leads to the generation of tinnitus. Our finding of increased delta/theta power in the auditory cortex of six subjects, with increased tinnitus intensity in the context of residual inhibition, was in keeping with this model (increases might also have existed in the other subjects, but did not reach statistical significance). As the presence of tinnitus is known to be associated with increased auditory cortex gamma, these findings are to be expected. However, they do not shed any further light on the role that auditory cortex gamma actually plays with respect to tinnitus. If auditory cortex gamma were the cornerstone and driving force behind the perception of tinnitus (as proposed in the theory of thalamocortical dysrhythmia) then it would be expected to decrease along with tinnitus decreases in residual inhibition. However, if auditory cortex gamma were an inhibitory force in tinnitus, it would also be expected to decrease in residual inhibition, during which the tinnitus drive to inhibition decreases.
In the context of residual excitation, auditory cortex gamma negatively correlated with tinnitus intensity (i.e. decreased during residual excitation). This finding is incompatible with any theory based on auditory cortex gamma as a driving force behind tinnitus (or as a driving force behind perception in general) and demands a reconsideration of what its role might be. Unlike residual inhibition, residual excitation cannot primarily operate at the level of the auditory periphery or thalamus, in which case the same relationship between tinnitus intensity and auditory cortex gamma should be demonstrated as in residual inhibition (i.e. increasing auditory cortex gamma power during excitation associated with increasing low-frequency power as a reflection of increased thalamocortical input). Rather, with increasing tinnitus intensity, we found decreasing gamma power and no change in delta or theta band power during residual excitation. It is also unlikely that it is primarily a top–down process from higher cortical areas, as our results showed extra-auditory cortical power changes in only a minority of residual excitation subjects, with no consistency between these. The consistent reduction in auditory cortex gamma oscillatory power in residual excitation suggests a local basis in auditory cortex, with modification of gamma oscillations as its fundamental mechanism.
Based on our experimental findings, we propose that auditory cortex gamma oscillations suppress, rather than cause, the perception of tinnitus. Our present data are insufficient to establish the mechanism by which this inhibitory process operates. However, our results are fully explicable by existing knowledge derived from the study of gamma oscillations at a local circuit level. We therefore offer a speculative model to explain how gamma oscillations might inhibit the perception of tinnitus, and how these oscillations might be disrupted to give rise to residual excitation. Figure 4 illustrates this model in the context of a simplified auditory pathway during spontaneous tinnitus, residual inhibition and residual excitation (both during and after masker presentation). In spontaneous tinnitus, cochlear dysfunction reduces thalamic inputs in the affected parts of the tonotopic axis. This thalamic deafferentation gives rise to regions of spontaneous low-frequency spiking activity. This in turn projects to auditory cortex in approximately the inverse tonotopic configuration to the thalamic input (i.e. areas of weak thalamic input give rise to strong thalamic outputs). Stimulated tonotopic regions in auditory cortex exert lateral inhibitory influences over neighbouring regions; as the thalamocortical input is broad, these lateral inhibitory connections are relatively balanced. There is strong evidence that gamma oscillations are driven by inhibitory interneurons and constitute a process of mutual inhibition whereby excitatory neurons are rhythmically and synchronously inhibited at gamma frequencies (Wang and Rinzel, 1992; Bartos et al., 2007). Furthermore, evidence from primary visual cortex indicates that increased gamma oscillations are associated with reduced firing rates of principal excitatory neurons, the authors proposing activation of a neuron’s suppressive surround as a mechanism for these phenomena (Gieselmann and Thiele, 2008). Similar work has also shown that gamma oscillations occur most strongly in response to large stimuli spanning multiple receptive fields and that selective attention towards a particular receptive field both reduces gamma oscillations and increases neuronal firing rates (Chalk et al., 2010). Modelling of cholinergic attentional mechanisms suggests that acetylcholine acts to increase lateral inhibition and reduce lateral excitation (Deco and Thiele, 2011).
Figure 4.

Model of the cause and role of auditory cortex gamma oscillations in the suppression of tinnitus. A simplified schematic of the auditory pathway (A) in association with tinnitus, during silence (i.e. no external auditory stimuli), (B) in the context of residual inhibition after the masking stimulus has ended, (Ci) during residual excitation while the masking stimulus is still present, and (Cii) during residual excitation once the masking stimulus has ended. The horizontal axis (and greyscale gradient) indicate the part of the tonotopic axis of the auditory pathways. Vertical arrows indicate forward connections, with thickness denoting connection strength. Spiking activity in auditory thalamus is represented at each frequency by the height of the line shown. Lateral inhibition, between cortical tonotopic regions, is denoted by diagonal flat-ended arrows, with strength of inhibition denoted by line thickness. Mutual inhibition, in the form of cortical gamma oscillations, is denoted by arrowed circles within auditory cortex, with strength denoted by circle thickness and phase by the position of the arrows on the circles. Mean firing rate of cortical excitatory neurons is denoted by the height of the line shown. Arrows projecting from auditory cortex denote the strength of cortical efferent connections to higher cognitive and perceptual networks, with strength represented by arrow thickness.
Based on these findings, we postulate that gamma oscillations are facilitated by activation of neighbouring tonotopic regions in the context of reciprocally balanced lateral inhibition, and that these oscillations act to mutually inhibit the firing rates of excitatory neurons. We also propose that in attentional states, imbalances in lateral inhibition lead to certain tonotopic regions ‘winning out’, which is associated with a reduction in gamma oscillation-mediated mutual inhibition. In tinnitus, we suggest that an area of auditory cortex spanning multiple tonotopic regions is chronically stimulated, and these regions are subject to relatively balanced lateral inhibition. These conditions lead to strong mutual inhibition via gamma oscillations that are synchronous across a relatively wide region of cortex and thus strongly detectable externally. Functionally, these oscillations attenuate the representation of a broad and information-poor input to auditory cortex, and are facilitated by its relative homogeneity and low recruitment of attentional mechanisms. In the case of residual inhibition, the difference is that the thalamic inputs are partially normalized. There is thus a weaker thalamocortical input, which results in gamma-mediated mutual inhibition that is less pronounced than in spontaneous tinnitus. In the case of residual excitation, the thalamic and thalamocortical inputs return to baseline after cessation of the masker, and the primary mechanism is a disruption of the gamma oscillations. Presentation of an auditory stimulus narrower in spectrum than the region of deafferentation may result in an imbalance of lateral inhibition at the edge frequencies of the stimulus (edge frequencies strongly inhibit their neighbours and are in turn only weakly inhibited). Once the stimulus has ended, the imbalance in lateral inhibition temporarily persists. This imbalance is perpetuated by the continued (albeit weaker) input at masker frequencies due to thalamocortical projections. It could also be promoted by cholinergic activity, either at a purely local level, or involving the action of the basal forebrain cholinergic system that mediates both stimulus-driven and top–down attention (Sarter et al., 2005). The imbalance of lateral inhibition disrupts gamma oscillations around these stimulus edge frequencies, leading to an overall pattern of gamma oscillations that is reduced in magnitude from baseline, and occurring incontiguously (due to anatomical discontinuity and/or phase dys-synchrony). The effect of this gamma disruption is a release from inhibition of neuronal activity and therefore strengthened projection to higher perceptual areas.
Regardless of our model’s correctness, the finding that auditory cortex gamma oscillations are an inhibitory process in tinnitus is an important one; cortical gamma oscillations are known to be generated by the action of gamma-aminobutyric acidergic interneurons (Candin et al., 2009) and to be influenced in vivo by local concentration of gamma-aminobutyric acid (Muthukumaraswamy et al., 2009). These factors are potentially amenable to pharmacological manipulation, and therefore a correct understanding of their role with respect to tinnitus is important for therapeutic exploitation. If our assertion is correct that cholinergic mechanisms influence gamma oscillations in tinnitus, then this might represent a further possible avenue of pharmacological intervention. Our findings suggest that auditory cortex gamma oscillations are not generators of tinnitus, but rather an intrinsic control mechanism that exerts tonic suppression of the phantom auditory percept, and might be augmented to therapeutic effect.
Conclusion
We have studied a group of patients with tinnitus who are typical, except for a higher than usual proportion with normal pure-tone audiograms, using a method that is capable of detecting dynamic correlates of tinnitus in the form of cortical oscillatory power changes. Our results indicate that, with the exception of auditory cortex delta/theta and gamma oscillations, these tinnitus correlates are highly heterogeneous across individuals in terms of the anatomical locations involved, laterality, frequency bands and directions of power change. We suggest that individual level analysis is an important part of the study of cortical tinnitus correlates, as otherwise homogeneity might be falsely assumed, and important changes might be cancelled out at group level and missed altogether.
Our striking and consistent finding was that in residual inhibition, auditory cortex gamma power positively correlates with tinnitus intensity, and in residual excitation it shows the opposite correlation. On this basis we conclude that these oscillations cannot constitute the perceptual or intensity code of tinnitus that they are argued to be in current models of tinnitus. We propose that these oscillations exert an inhibitory influence on tinnitus intensity, and suggest a model based on mutual inhibition to explain this assertion. This finding has wide-ranging implications for the study of tinnitus and future treatments aiming to manipulate the dynamics of cortical gamma oscillations.
Funding
T.D.G. is a Wellcome Trust Senior Clinical Fellow. This work was funded entirely by a Wellcome Trust programme grant awarded to T.D.G. entitled Cortical Bases for Auditory Perception, grant number WT091681MA.
Supplementary material
Supplementary material is available at Brain online.
Acknowledgements
We wish to thank David Bradbury and Janice Glensman, Wellcome Trust Centre for Neuroimaging, Queen Square, London, for their assistance and support with the acquisition of MEG data.
Glossary
Abbreviations
- MEG
magnetoencephalography
References
- Ashton H, Reid K, Marsh R, Johnson I, Alter K, Griffiths T. High frequency ‘hot spots’ in temporal lobes of patients with intractable tinnitus: a quantitative electroencephalographic (QEEG) study. Neurosci Lett. 2007;426:23, 8. doi: 10.1016/j.neulet.2007.08.034. [DOI] [PubMed] [Google Scholar]
- Bartos M, Vida I, Jonas P. Synaptic mechanisms of synchronized gamma oscillations in inhibitory interneuron networks. Nat Rev Neurosci. 2007;8:45–56. doi: 10.1038/nrn2044. [DOI] [PubMed] [Google Scholar]
- Bathellier B, Lagier S, Faure P, Lledo P-M. Circuit properties generating gamma oscillations in a network model of the olfactory bulb. J Neurophysiol. 2006;95:2678–91. doi: 10.1152/jn.01141.2005. [DOI] [PubMed] [Google Scholar]
- Börgers C, Epstein S, Kopell NJ. Gamma oscillations mediate stimulus competition and attentional selection in a cortical network model. Proc Natl Acad Sci USA. 2008;105:18023–8. doi: 10.1073/pnas.0809511105. [DOI] [PMC free article] [PubMed] [Google Scholar]
- Candin J, Carlén M, Meletis K, Knoblich U, Zhang F, Deisseroth K, et al. Driving fast-spiking cells induces gamma rhythm and controls sensory responses. Nature. 2009;459:663–7. doi: 10.1038/nature08002. [DOI] [PMC free article] [PubMed] [Google Scholar]
- Chalk M, Herrero J, Gieselmann M, Delicato L, Gotthardt S, Thiele A. Attention reduces stimulus-driven gamma frequency oscillations and spike field coherence in V1. Neuron. 2010;66:114–25. doi: 10.1016/j.neuron.2010.03.013. [DOI] [PMC free article] [PubMed] [Google Scholar]
- de Ridder D, Elgoyhen A, Romo R, Langguth B. Phantom percepts: tinnitus and pain as persisting aversive memory networks. Proc Natl Acad Sci USA. 2011a;108:8075–80. doi: 10.1073/pnas.1018466108. [DOI] [PMC free article] [PubMed] [Google Scholar]
- de Ridder D, van der Loo E, Vanneste S, Gais S, Plazier M, Kovacs S, et al. Theta-gamma dysrhythmia and auditory phantom perception. J Neurosurg. 2011a;114:912–21. doi: 10.3171/2010.11.JNS10335. [DOI] [PubMed] [Google Scholar]
- Deco G, Thiele A. Cholinergic control of cortical network interactions enables feedback-mediated attentional modulation. Eur J Neurosci. 2011;34:146–57. doi: 10.1111/j.1460-9568.2011.07749.x. [DOI] [PubMed] [Google Scholar]
- Deichmann R, Schwarzbauer C, Turner R. Optimisation of the 3D MDEfT sequence for anatomical brain imaging: technical implications at 1.5 and 3 T. Neuroimage. 2004;21:757–67. doi: 10.1016/j.neuroimage.2003.09.062. [DOI] [PubMed] [Google Scholar]
- Feldmann H. Homolateral and contralateral masking of tinnitus by noise-bands and by pure tones. Audiology. 1971;10:138–44. doi: 10.3109/00206097109072551. [DOI] [PubMed] [Google Scholar]
- Gieselmann M, Thiele A. Comparison of spatial integration and surround suppression characteristics in spiking activity and the local field potential in macaque V1. Eur J Neurosci. 2008;28:447–59. doi: 10.1111/j.1460-9568.2008.06358.x. [DOI] [PubMed] [Google Scholar]
- Glattke T, Robinette M. Transient evoked otoacoustic emissions. In: Robinette M, Glattke T, editors. Otoacoustic Emissions: Clinical Applications. New York: Thieme; 1997. pp. 63–82. [Google Scholar]
- Gross J, Kujala J, Hämäläinen M, Timmermann L, Schnitzler A, Salmelin R. Dynamic imaging of coherent sources: studying neural interactions in the human brain. Proc Natl Acad Sci USA. 2001;98:694–9. doi: 10.1073/pnas.98.2.694. [DOI] [PMC free article] [PubMed] [Google Scholar]
- Hipp J, Engel A, Siegel M. Oscillatory synchronization in large-scale cortical networks predicts perception. Neuron. 2011;69:387–96. doi: 10.1016/j.neuron.2010.12.027. [DOI] [PubMed] [Google Scholar]
- Kahlbrock N, Weisz N. Transient reduction of tinnitus intensity is marked by concomitant reductions of delta band power. BMC Biol. 2008;6:4. doi: 10.1186/1741-7007-6-4. [DOI] [PMC free article] [PubMed] [Google Scholar]
- Litvak V, Mattout J, Kiebel S, Phillips C, Henson R, Kilner J, et al. EEG and MEG data analysis in SPM8. Comp Intel Neurosci. 2011;2011:852961. doi: 10.1155/2011/852961. [DOI] [PMC free article] [PubMed] [Google Scholar]
- Llinás R, Urs R, Jeanmonod D, Kronberg E, Mitra P. Thalamocortical dysrhythmia: a neurological and neuropsychiatric syndrome characterised by magnetoencephalography. Proc Natl Acad Sci USA. 1999;96:15222–7. doi: 10.1073/pnas.96.26.15222. [DOI] [PMC free article] [PubMed] [Google Scholar]
- Moazami-Goudarzi M, Michels M, Weisz N, Jeanmonod D. Temporo-insular enhancement of EEG low and high frequencies in patients with chronic tinnitus. QEEG study of chronic tinnitus patients. BMC Neurosci. 2010;11:40. doi: 10.1186/1471-2202-11-40. [DOI] [PMC free article] [PubMed] [Google Scholar]
- Muthukumaraswamy S, Edden R, Jones D, Swettenham J, Singh K. Resting GABA concentration predicts peak gamma frequency and fMRI amplitude in response to visual stimulation in humans. Proc Natl Acad Sci USA. 2009;106:8356–61. doi: 10.1073/pnas.0900728106. [DOI] [PMC free article] [PubMed] [Google Scholar]
- Newman C, Jacobson G, Spitzer J. Development of the Tinnitus Handicap Inventory. Arch Otolaryngol Head Neck Surg. 1996;122:143–8. doi: 10.1001/archotol.1996.01890140029007. [DOI] [PubMed] [Google Scholar]
- Oostenveld R, Fries P, Maris E, Schoffelen J. FieldTrip: open source software for advanced analysis of MEG, EEG, and invasive electrophysiological data. Comp Intel Neurosci. 2011;2011:156869. doi: 10.1155/2011/156869. [DOI] [PMC free article] [PubMed] [Google Scholar]
- Ortmann M, Müller N, Schlee W, Weisz N. Rapid increases of gamma power in the auditory cortex following noise trauma in humans. Eur J Neurosci. 2011;33:568–75. doi: 10.1111/j.1460-9568.2010.07542.x. [DOI] [PubMed] [Google Scholar]
- Roberts L. Residual inhibition. Prog Brain Res. 2007;166:487–95. doi: 10.1016/S0079-6123(07)66047-6. [DOI] [PubMed] [Google Scholar]
- Roberts L, Moffatt G, Baumann M, Ward L, Bosnyak D. Residual inhibition functions overlap tinnitus spectra and the region of auditory threshold shift. J Assoc Res Otolaryngol. 2008;9:417–35. doi: 10.1007/s10162-008-0136-9. [DOI] [PMC free article] [PubMed] [Google Scholar]
- Roberts L, Moffat G, Bosnyak D. Residual inhibition functions in relation to tinnitus spectra and auditory threshold shift. Acta Otolaryngol. 2006;126:27–33. doi: 10.1080/03655230600895358. [DOI] [PubMed] [Google Scholar]
- Sarter M, Hasselmo M, Bruno J, Givens B. Unraveling the attentional functions of cortical cholinergic inputs: interactions between signal-driven and cognitive modulation of signal detection. Brain Res Rev. 2005;48:98–111. doi: 10.1016/j.brainresrev.2004.08.006. [DOI] [PubMed] [Google Scholar]
- Schaette R, McAlpine D. Tinnitus with a normal audiogram: physiological evidence for hidden hearing loss and computational model. J Neurosci. 2011;31:13452–7. doi: 10.1523/JNEUROSCI.2156-11.2011. [DOI] [PMC free article] [PubMed] [Google Scholar]
- Sedley W, Teki S, Kumar S, Overath T, Barnes G, Griffiths T. Gamma band pitch responses in human auditory cortex measured with magnetoencephalography. Neuroimage. 2012;59:1904–11. doi: 10.1016/j.neuroimage.2011.08.098. [DOI] [PMC free article] [PubMed] [Google Scholar]
- Shargorodsky J, Curhan GC, Farwell WR. Prevalence and characteristics of tinnitus among US adults. Am J Med. 2010;123:711–8. doi: 10.1016/j.amjmed.2010.02.015. [DOI] [PubMed] [Google Scholar]
- Tallon-Baudry C, Bertrand O. Oscillatory gamma activity in humans and its role in object representation. Trends Cogn Sci. 1999;3:151–62. doi: 10.1016/s1364-6613(99)01299-1. [DOI] [PubMed] [Google Scholar]
- van der Loo E, Gais S, Congedo N, Vanneste S, Plazier M, Menovsky T, et al. Tinnitus intensity dependent gamma oscillations of the contralateral auditory cortex. PLoS One. 2009;4:e7396. doi: 10.1371/journal.pone.0007396. [DOI] [PMC free article] [PubMed] [Google Scholar]
- Vanneste S, Focquaert F, van de Heyning P, de Ridder D. Different resting state brain activity and functional connectivity in patients who respond and not to bifrontal tDCS for tinnitus suppression. Exp Brain Res. 2011a;210:217–27. doi: 10.1007/s00221-011-2617-z. [DOI] [PubMed] [Google Scholar]
- Vanneste S, Plazier M, van der Loo E, van de Heyning P, de Ridder D. The difference between uni- and bilateral auditory phantom percept. Clin Neurophysiol. 2011b;122:576–87. doi: 10.1016/j.clinph.2010.07.022. [DOI] [PubMed] [Google Scholar]
- Vanneste S, Plazier P, van der Loo E, van de Heyning P, Congedo M, de Ridder D. The neural correlates of tinnitus-related distress. Neuroimage. 2010a;52:470–80. doi: 10.1016/j.neuroimage.2010.04.029. [DOI] [PubMed] [Google Scholar]
- Vanneste S, Plazier M, van der Loo E, van de Heyning P, de Ridder D. The differences in brain activity between narrow band noise and pure tone tinnitus. PLoS One. 2010b;5:e13618. doi: 10.1371/journal.pone.0013618. [DOI] [PMC free article] [PubMed] [Google Scholar]
- Vanneste S, van de Heyning P, de Ridder D. The neural network of phantom sound changes over time: a comparison between recent-onset and chronic tinnitus patients. Eur J Neurosci. 2011c;34:718–31. doi: 10.1111/j.1460-9568.2011.07793.x. [DOI] [PubMed] [Google Scholar]
- Wang X-J, Rinzel J. Alternating and synchronous rhythms in reciprocally inhibitory model neurons. Neural Comput. 1992;4:84–97. [Google Scholar]
- Weisz N, Moratti S, Meinzer M, Dohrmann K, Elbert T. Tinnitus perception and distress is related to abnormal spontaneous brain activity as measured by magnetoencephalography. PLoS Med. 2005;2:e153. doi: 10.1371/journal.pmed.0020153. [DOI] [PMC free article] [PubMed] [Google Scholar]
- Weisz N, Hartmann T, Dohrmann K, Schlee W, Norena A. High-frequency tinnitus without hearing loss does not mean absence of deafferentation. Hear Res. 2006;222:108–14. doi: 10.1016/j.heares.2006.09.003. [DOI] [PubMed] [Google Scholar]
- Weisz N, Müller S, Schlee W, Dohrmann K, Hartmann T, Elbert T. The neural code of auditory phantom perception. J Neurosci. 2007;27:1479–84. doi: 10.1523/JNEUROSCI.3711-06.2007. [DOI] [PMC free article] [PubMed] [Google Scholar]
Associated Data
This section collects any data citations, data availability statements, or supplementary materials included in this article.