Abstract
Body Adiposity Index (BAI), a new surrogate measure of body fat (hip circumference/[height1.5 -18]), has been proposed as an alternative to BMI. We compared BAI with BMI, and each of them with laboratory measures of body fat-derived from bioimpedance analysis (BIA), air displacement (ADP), and dual-energy x-ray absorptiometry (DXA) in clinically severe obese (CSO) participants. Nineteen pre-bariatric surgery CSO, non-diabetic women were recruited (age=32.6±7.7 SD; BMI=46.5±9.0 kg/m2). Anthropometrics and body fat percentage (% fat) were determined from BIA, ADP, and DXA. Scatter plots with lines of equality and Bland-Altman plots were used to compare BAI and BMI with % fat derived from BIA, ADP, and DXA. BAI and BMI correlated highly with each other (r=0.90, p<0.001). Both BAI and BMI correlated significantly with % fat from BIA and ADP. BAI, however, did not correlate significantly with % fat from DXA (r=0.42, p=0.08) whereas BMI did (r=0.65, p=0.003). BMI was also the single best predictor of % fat from both BIA (r2=0.80, p<0.001) and ADP (r2=0.65, p<0.001). The regression analysis showed that the standard error of the estimate (SEE) or residual error around the regression lines was greater for BAI comparisons than for BMI comparisons with BIA, ADP, and DXA. Consistent with this, the Bland and Altman plots indicated wider 95% confidence intervals for BAI difference comparisons than for BMI difference comparisons with their respective means with BIA, ADP, and DXA. Thus, BAI does not appear to be an appropriate proxy for BMI in clinically severe obese (CSO) women.
Keywords: Body Adiposity Index, Body Mass Index, DXA, BIA, ADP
Introduction
As obesity has become a pandemic (1,2), researchers as well as clinicians have become more interested in evaluating body composition to asses health risks related to excess body fat (3). Although there are numerous methods to assess body fat, ranging from anthropometrics, to more sophisticated methods, including bioimpedance analysis (BIA) (4), air displacement plethysmography (ADP) (5), and dual energy x-ray absorptiometry (DXA) (6), there is no universally agreed upon gold standard (7). In addition, the simple less invasive methods are more prone to measurement error, and the more accurate ones are not available for routine clinical practice.
BMI is a simple estimate of fat mass based on the ratio of weight to height squared (weight (kg)/height squared (m2). However, a higher BMI does not always reflect increased body fat as excess weight can be due to increased muscle mass, influenced by such factors as sex, age, genetics, exercise, and ethnicity (8). Recently, Body Adiposity Index (BAI) has been proposed as a new alternative to BMI. BAI is a nonlinear ratio of hip circumference to height (hip circumference in cm/[(height (m)1.5 -18]) (9). Bergman et al. (9) reported that BAI is strongly correlated with adiposity, and in contrast to BMI, BAI was equally good for both genders and for differing ethnicities. In this sample of clinically severe obese (CSO) women, we examined how BAI compared with BMI and in their correlations with more direct estimates of body fat derived from BIA, ADP, and DXA as well as in scatter plots with lines of equality and in Bland-Altman plots.
Methods and Procedures
Participants
Nineteen CSO non-diabetic women, age = 32.6±7.7 (mean ± SD) and BMI = 46.5±9.0 kg/m2, were recruited from candidates for bariatric surgery. There were 10 African-American, 7 Hispanic, and 2 Caucasian women. Each participant underwent a medical examination, including medical history, physical examination, and routine blood tests to exclude those with major organ disease, such as diabetes. Participants gave written informed consent to participate in the study protocol, which had been approved by the St. Luke’s-Roosevelt Hospital Center IRB.
Study protocol
Body composition was assessed following an overnight fast. Body fat percentage (% fat) was estimated with bioelectrical impedance analysis (BIA), air displacement plethysmography (ADP), and dual-energy x-ray absorptiometry (DXA). All body composition procedures were performed and interpreted by trained technologists in the Body Composition Core Lab of the NIH-funded New York Obesity Nutrition Research Center (NYONRC).
Anthropometric Measurements
Body weight was measured to the nearest 0.05 kg, using a calibrated scale (Weight Tronix, New York, NY). Height was measured to the nearest 0.1 cm, using a stadiometer (SECA 217). Hip circumference (HC) was measured at the level of the greater trochanter of the femoral bone, which was palpated laterally.
Bioimpedance Analysis (BIA)
Body fat was estimated by bioelectrical impedance analysis (BIA), using a Tanita instrument (TBF-300A).
Air displacement plethysmography (ADP)
ADP was performed using BodPod (Life Measurement Instruments, Concord CA, USA) to estimate body volume and density. Participants wore a tight-fitting bathing suit and acrylic bathing cap and were weighed to the nearest 0.01 kg using the ADP electronic scale (Tanita Corp., Tokyo, Japan).
Whole Body dual-energy X-ray absorptiometry (DXA)
DXA, which employs a 2-fan beam (GE Lunar Prodigy, Madison, WI), was used to estimate percent body fat. The intraclass correlation coefficient at our Core Lab for % fat estimation by DXA was 0.994.
Data Analysis
Descriptive statistics are expressed as mean ± SD (Table 1). Correlations between BAI and BMI indices with more direct measures of % fat were performed by Pearson’s r. The best predictors of % fat were assessed by stepwise linear regression when at least one predictor was significant. The coefficient of determination (r2) and standard error of the estimate (SEE), which is the standard deviation of the data points around the regression line, were calculated (Table 2). Bland-Altman plots were also used to compare BAI and BMI with standard body fat measures. A range of agreement was based on the mean bias, or mean difference between the means of the measures ± 2 SD, an interval within which 95% of the differences between BAI/BMI indices and the more direct % fat measurements (i.e., BIA, ADP, DXA) were expected to lie. Statistical analyses were performed with SPSS (SPSS for Windows, 18; SPSS, Chicago, IL). Two-tailed (a = 0.05) tests of significance were applied.
Table 1.
Participant Measures
| Baseline (n=19)
| |||
|---|---|---|---|
| Measures | Min | max | mean±SD |
| Age | 22 | 51 | 32.7±7.7 |
| Weight (kg) | 101.7 | 185.3 | 126.6±24.4 |
| Height (m) | 1.52 | 1.82 | 1.64±0.1 |
| Waist (cm) | 100.8 | 166.0 | 124.8±16.1 |
| Hip (cm) | 116.0 | 180.3 | 140.6±16.4 |
| WHR | 0.7 | 1.3 | 0.9±0.1 |
| BAI (% fat) | 38.7 | 77.8 | 48.9±9.6 |
| BMI (kg/m2) | 37.5 | 72.7 | 46.5±9.0 |
| BIA (% fat) | 45.6 | 60.7 | 50.1±4.4 |
| ADP (% fat) | 46.5 | 65.9 | 53.9±5.7 |
| DXA (% fat) | 46.7 | 75.7 | 58.7±8.7 |
WHR=Waist to Hip Ratio; BAI=Body Adiposity Index; BMI=Body Mass Index; BIA=Bioimpedance Analysis; ADP=Air Displacement Plethysmography; DXA=Dual-energy X-ray absorptiometry.
Table 2.
BAI and BMI in relation to % fat by BIA, ADP, and DXA
| % fat | r | r2 | SEE |
|---|---|---|---|
| BAI | |||
|
| |||
| BIA | 0.87** | 0.76 | 2.22 |
| ADP | 0.73* | 0.53 | 3.99 |
| DXA | 0.42 | 0.17 | 8.18 |
|
| |||
| BMI | |||
|
| |||
| BIA | 0.90** | 0.80 | 2.01 |
| ADP | 0.81** | 0.65 | 3.45 |
| DXA | 0.65* | 0.42 | 6.86 |
p < 0.05;
p < 0.01.
BIA=Bioimpedance Analysis; ADP=Air Displacement Plethysmography; DXA=Dual-energy X-ray Absorptiometry; r=correlation coefficient (Pearson’s r); r2=coeffiecient of determination; SEE= standard error of the estimate.
Results
Participant measures, including anthropometric data, are presented in Table 1. As expected, % fat estimated by BIA, ADP, and DXA were significantly correlated with each other. Estimates of % fat from BIA were significantly correlated with % fat from ADP (r=0.67, r=0.002) and DXA (r=0.65, p=0.003). Estimates of % fat from ADP were also significantly correlated with % fat from DXA (r=0.67, r=0.002). Estimates of % fat from DXA were somewhat higher than from BIA and ADP but not statistically different from each other.
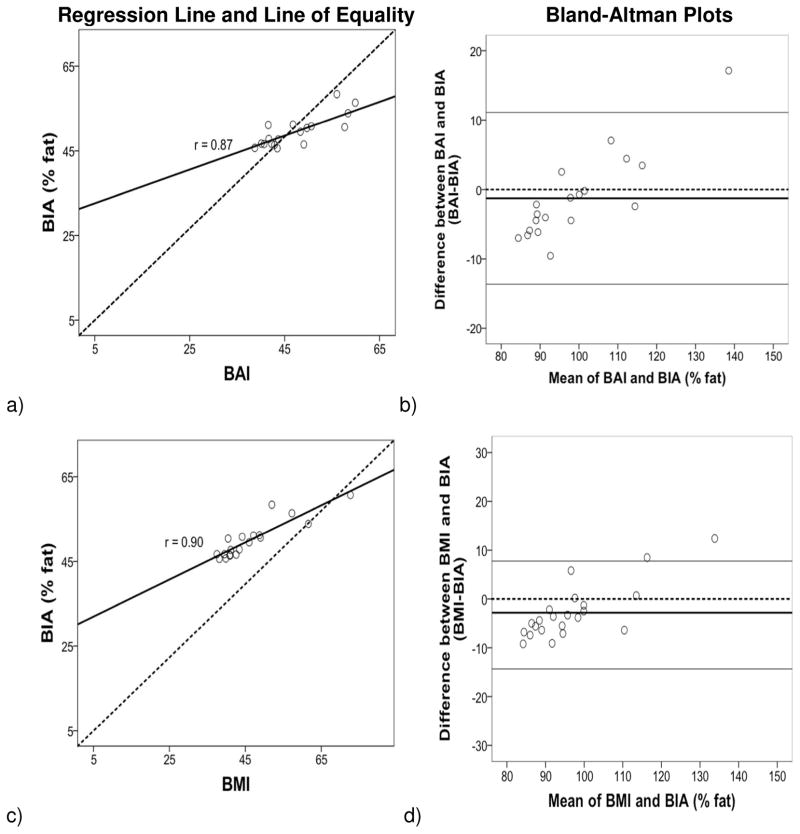
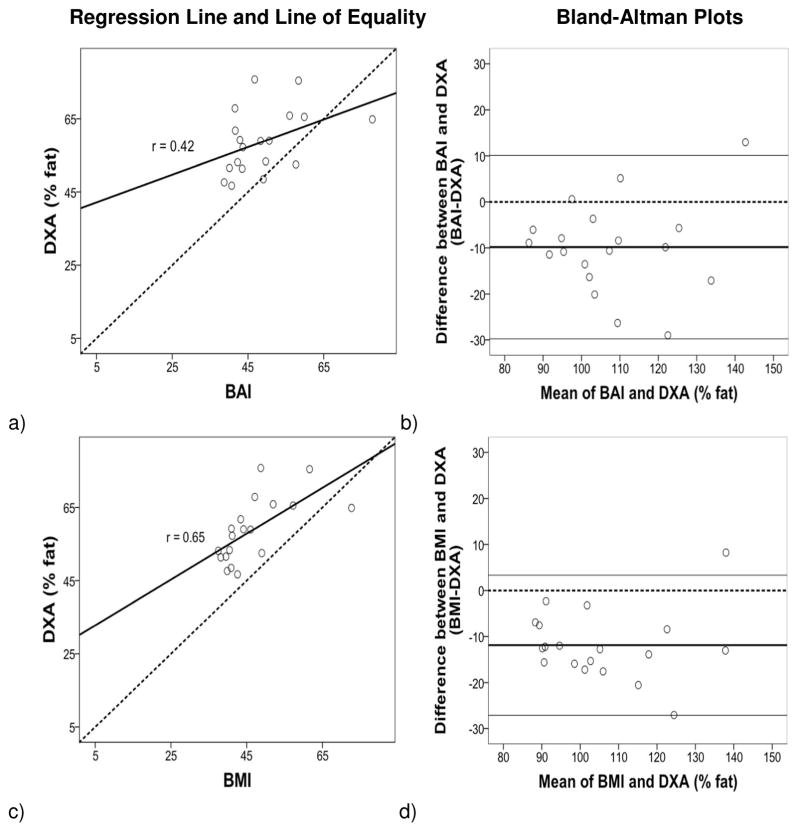
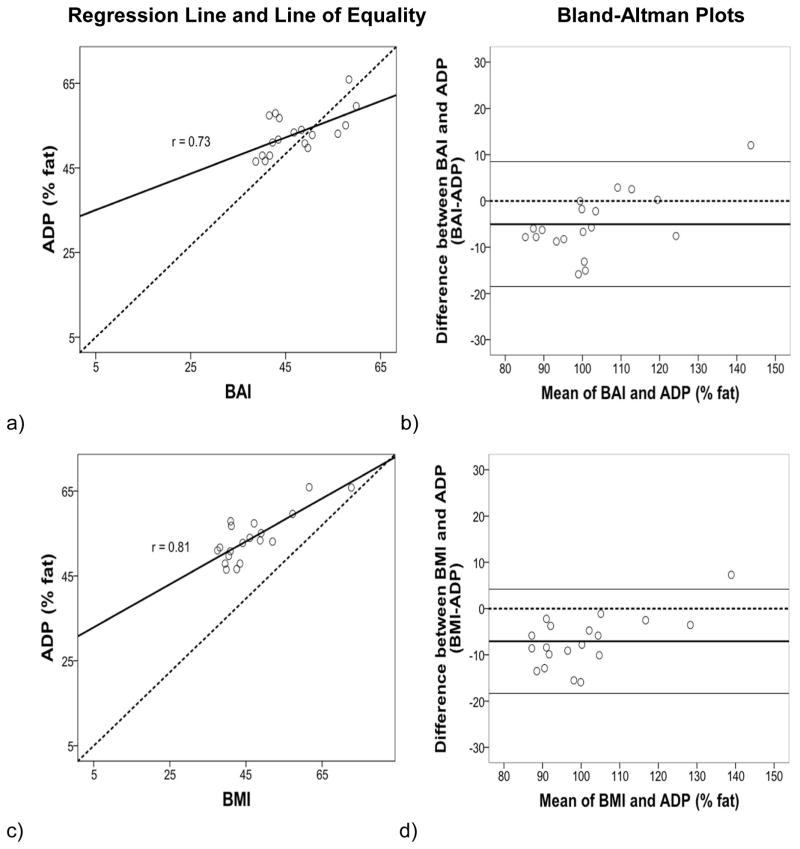
The accuracy and bias in measures of % fat by BIA, ADP, and DXA relative to BAI and BMI are given in Table 2. BAI correlated with BMI (r=0.90, p<0.001) as well as with % fat from BIA (r=0.87, p<0.001) and with % fat from ADP (r=0.73, p=0.001). Similarly, BMI correlated with % fat from BIA (r=0.90, p<0.001) and with ADP (r=0.81, p<0.001). BAI, however, did not correlate significantly with % fat from DXA (r=0.42, p=0.08), whereas BMI did (r=0.65, p=0.003) (Table 2). Stepwise linear regression analysis showed that BMI was the single best predictor of % fat derived from BIA (r2=0.80, p<0.001) and from ADP (r2=0.65, p<0.001).
The regression lines and lines of equality assessed the correlation and agreement between BAI and BMI with % fat estimates from BIA, ADP and DXA. Figures 1–3 (left panels) show that the variation (SEE) around the regression lines was greater for BAI comparisons than for BMI comparisons with BIA (BAI with BIA: SEE = 2.22 and BMI with BIA: SEE = 2.01) with ADP (BAI with ADP: SEE = 3.99 and BMI with ADP: SEE= 3.45), and with DXA (BAI with DXA: SEE = 8.18 and BMI with DXA: SEE= 6.86).
Figure 1.
Regression (left panel): Body fat percentage (% fat) from BIA compared with BAI (a, b) and BMI (c, d). The line of regression for a) BIA % fat and BAI, and for c) BIA % fat and BMI is represented by the solid line, and the line of equality by the dotted line. The variation (SEE) around the regression lines was greater for BAI comparisons than for BMI comparisons with BIA. Bland–Altman Plot (right panel) provides an interval within which 95% of differences between % fat derived from b) BAI-BIA and d) BMI-BIA are expected to lie. The thick black line represents the mean bias (mean of the differences), the dotted line (line of equality), and the two thin horizontal lines are drawn at the 95% confidence interval of limits of agreement (mean bias±2SD). The 95% confidence interval of limits was greater for BAI comparisons than for BMI comparisons with BIA.
Figure 3.
Regression: Body fat percentage (% fat) from DXA compared with BAI (a, b) and BMI (c, d). The variation (SEE) around the regression lines was greater for BAI comparisons than for BMI comparisons with DXA. Bland-Altman: The 95% confidence interval of limits was greater for BAI comparisons than for BMI comparisons.
The Bland and Altman (10) plots assessed the degree of individual agreement between differences between BAI and BMI with each of the % fat estimates from BIA, ADP and DXA and their respective means. Figures 1–3 (right panels) show that the limits of agreement found with BIA (ranging from 11.13 to −13.63 with BAI, and 7.75 to −14.33 with BMI), ADP (ranging from 8.49 to −18.47 with BAI, and 4.21 to −18.29 with BMI) and DXA (ranging from 10.09 to −29.75 with BAI, and 3.33 to −27.09 with BMI). A positive skew was observed for BIA and ADP data points in relation to BAI and BMI but not for DXA. The mean bias line was also somewhat lower in the Bland-Altman plots for DXA compared to BIA and ADP.
Discussion
This study was designed to compare BAI and BMI surrogate measures of body fat with those derived from more direct techniques, BIA, ADP and DXA, in CSO women. The results showed significant correlations between BMI and direct measures of adiposity (BIA, ADP, and DXA). Similarly BAI was significantly correlated with % fat derived from BIA and ADP, but in contrast to BMI, BAI was not significantly correlated with % fat from DXA. This differs from Bergman et al. (9), who found a significant correlation between BAI and DXA. The difference between studies may be due in part to the higher BMIs of our study participants (46.5±9.) compared to those in Bergman et al. (30.0±7.7).
Stepwise regression analysis found that BMI was the single best predictor of % fat from BIA and ADP, suggesting that BMI was a robust method of assessing body fat. Although correlations may be significant between two methods, it does not indicate the degree of agreement on actual values (10). By using lines of equality and Bland-Altman plots, Fig 1–3 (right panels), one can assess the agreement between two methods. Our findings showed that the SEE around the regression lines, Fig 1–3 (left panels), and the limits of agreement in the Bland-Altman plots, Fig 1–3 (right panels), were larger for comparisons between BAI than for BMI, with BIA, ADP, and DXA. A positive skew was also observed for BIA and ADP data points in relation to BAI and BMI, but not for DXA. This may be due to underestimation by BIA and ADP at the highest adiposity levels (as BIA and ADP % fat estimates were subtracted from BAI and BMI) relative to DXA (7,11,12). Moreover, the mean bias line was somewhat lower in the Bland-Altman plots for DXA compared to BIA and ADP, which may be due to DXA overestimating % fat in CSO women (13).
Limitations of the study include a relatively small sample of CSO middle-aged women. Despite these limitations, we can conclude that although BAI appears to be a reasonable ndex of body fat, it is not an appropriate substitute for BMI in CSO women.
Figure 2.
Regression: Body fat percentage (% fat) from ADP compared with BAI (a, b) and BMI (c, d). The variation (SEE) around the regression lines was greater for BAI comparisons than for BMI comparisons with ADP. Bland-Altman: The 95% confidence interval of limits was greater for BAI comparisons than for BMI comparisons.
Acknowledgments
Supported in part by the National Institute of Health (R01DK080153, RO3 DK61519, M01RR00645, and P30DK026687). We acknowledge the assistance of Drs. John Thornton, Dympna Gallagher, and Edward Colt of the Body Composition Core Lab of the NIH-funded New York Obesity Nutrition Research Center (NYONRC) as well as Don J. McMahon, biostatistician from the Dept. of Endocrinology at Columbia University.
Footnotes
Disclosure: No competing interests
References
- 1.Bleich S, Cutler D, Murray C, Adams A. Why is the developed world obese? Annu Rev Public Health. 2008;29:273–95. doi: 10.1146/annurev.publhealth.29.020907.090954. [DOI] [PubMed] [Google Scholar]
- 2.Sibbald B. Obesity may soon be leading cause of preventable death in US 2002. Canadian Medical Association Journal. 166:642. [PMC free article] [PubMed] [Google Scholar]
- 3.Wells JC, Fewtrell MS. Measuring body composition. Arch Dis Child. 2006;91:612–7. doi: 10.1136/adc.2005.085522. [DOI] [PMC free article] [PubMed] [Google Scholar]
- 4.Jaffrin MY. Body composition determination by bioimpedance: an update. Curr Opin Clin Nutr Metab Care. 2009;12:482–6. doi: 10.1097/MCO.0b013e32832da22c. [DOI] [PubMed] [Google Scholar]
- 5.Ginde SR, Geliebter A, Rubiano F, et al. Air displacement plethysmography: validation in overweight and obese subjects. Obes Res. 2005;13:1232–7. doi: 10.1038/oby.2005.146. [DOI] [PubMed] [Google Scholar]
- 6.Eisenmann JC, Heelan KA, Welk GJ. Assessing body composition among 3- to 8-year-old children: anthropometry, BIA, and DXA. Obes Res. 2004;12:1633–40. doi: 10.1038/oby.2004.203. [DOI] [PubMed] [Google Scholar]
- 7.Lazzer S, Bedogni G, Agosti F, De Col A, Mornati D, Sartorio A. Comparison of dual-energy X-ray absorptiometry, air displacement plethysmography and bioelectrical impedance analysis for the assessment of body composition in severely obese Caucasian children and adolescents. Br J Nutr. 2008;100:918–24. doi: 10.1017/S0007114508922558. [DOI] [PubMed] [Google Scholar]
- 8.Gallagher D, Visser M, Sepulveda D, Pierson RN, Harris T, Heymsfield SB. How useful is body mass index for comparison of body fatness across age, sex, and ethnic groups? Am J Epidemiol. 1996;143:228–39. doi: 10.1093/oxfordjournals.aje.a008733. [DOI] [PubMed] [Google Scholar]
- 9.Bergman RN, Stefanovski D, Buchanan TA, et al. A Better Index of Body Adiposity. Obesity (Silver Spring) 2011 doi: 10.1038/oby.2011.38. [DOI] [PMC free article] [PubMed] [Google Scholar]
- 10.Bland JM, Altman DG. Statistical methods for assessing agreement between two methods of clinical measurement. Lancet. 1986;1:307–10. [PubMed] [Google Scholar]
- 11.Neovius M, Hemmingsson E, Freyschuss B, Udden J. Bioelectrical impedance underestimates total and truncal fatness in abdominally obese women. Obesity (Silver Spring) 2006;14:1731–8. doi: 10.1038/oby.2006.199. [DOI] [PubMed] [Google Scholar]
- 12.Neovius M, Udden J, Hemmingsson E. Assessment of change in body fat percentage with DXA and eight-electrode BIA in centrally obese women. Medicine and science in sports and exercise. 2007;39:2199–203. doi: 10.1249/mss.0b013e3181579.38a. [DOI] [PubMed] [Google Scholar]
- 13.Sopher AB, Thornton JC, Wang J, Pierson RN, Jr, Heymsfield SB, Horlick M. Measurement of percentage of body fat in 411 children and adolescents: a comparison of dual-energy X-ray absorptiometry with a four-compartment model. Pediatrics. 2004;113:1285–90. doi: 10.1542/peds.113.5.1285. [DOI] [PMC free article] [PubMed] [Google Scholar]


