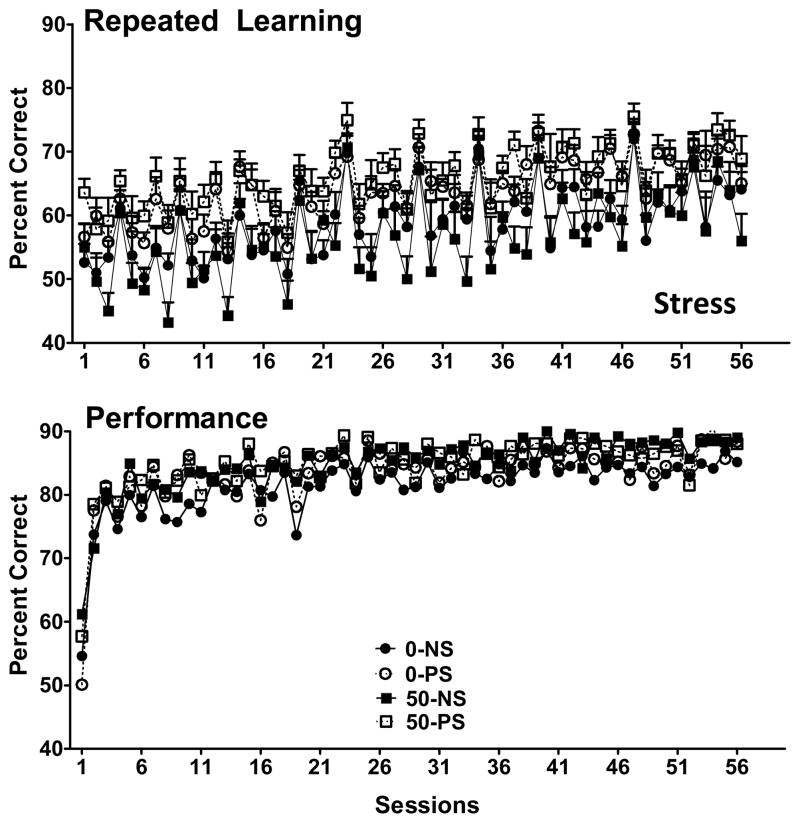
Figure 2.
Group mean ± S.E. values for percent correct (accuracy) during the repeated leaning (top; RL1) and performance (bottom; P1) components of the multiple schedule of RL and P schedule across sessions for groups exposed to lifetime Pb and PS. Group sample sizes were 12 for all groups. Stress = main effect of PS from the repeated measures ANOVA.

